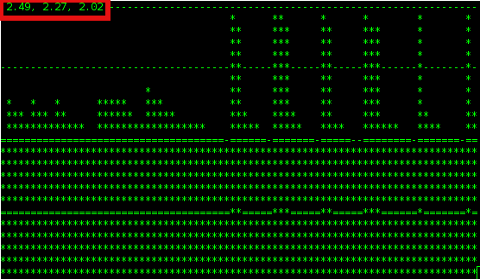
There is probably no Linux system administrator who, don't have idea about system Load Avarage. Most of admins however does have some brought idea about what kind of load avarage is critical but doesn't have good understanding on the 3 digits returned as a load avarage i.e. – load average: 2.47, 2.27, 2.02 shown in above ascii graphs ( generated by tload command).
What is Load Avarage ?
- The number of blocking processes in the run queue averaged over a certain time period.
A blocking process is a process that is waiting for something to continue. Typically, a process is waiting to use:
- CPU Time, Disk Input / Output oper. or Network I / O
Thus logically the higher the Load Avarage, the more processes has to wait for access to CPU, HDD and Network I/O.
The most two common commands used where load avarage appear are;
w – who
and
uptime
 mx:/home/hipo# w

 11:07:56 up 513 days,  1:04,  1 user,  load average: 1.92, 1.95, 1.84

USER     TTY      FROM              LOGIN@   IDLE   JCPU   PCPU WHAT

hipo     pts/0    www.pc-freak.net     Thu19    0.00s  0.06s  0.02s sshd: hipo [priv]
 mail:/home/hipo# uptime

 11:03:59 up 513 days,  1:00,  2 users,  load average: 2.11, 1.91, 1.81
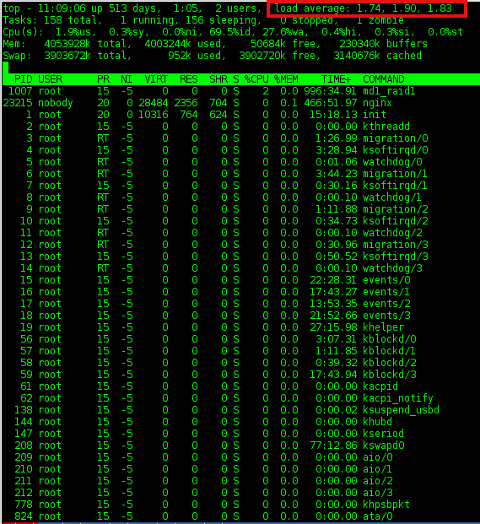
Other common place to check load avarage is in top cmd:
mail:/home/hipo# top

a) Optimum machine use – Load Avarage 1
So what does load avarage: 1.74, 1.90, 1.83 really means? The 3 digits are showing system load avarage over the last 1, 5 and 15 minutes time. Meaning;
– before 1 minute system had a load of 1.74
– 5 minutes before it was 1.90
– and 15 minutes back 1.83
Usually Load Avarage of more than 1 is considered critical. If a system is working with a load avarage of 1 this means the system is working capacity. In best cases in terms of optimizing processes on server with hardware it is good the system is working in load of 0.70 or 0.80. Whether a traffic the machine gets is planned in most cases a load avarage of exactly 1 means machine hardware is properly utilized. However whether the load avarage is hitting over 1 this usually means you have to think about moving server to new hardware. It is general rule of thumb that if system load is exceeeding 0.70 it is time to migrate to better hardware.
b) Load avarage on Multi-core / Multiprocessor servers
Load avarage of 4 on 4 CPU cores server hardware is optimum one. Each core / CPU on machine should get maximum of load avarage 1. Load avarage of 1 means CPU is utilized in 100%. Load avarage of 4 on 4 CPU server hardware means all 4 processors are working in their maximum power of 100%. For people who have multi processor server the best way to show utilization is by running htop. There all 4 CPUs will show idle of 0%.
Hence rule to calculate normal load avarage for server is;
1 Load Avarage per CPU. Therefore for 24 CPU Intel Xeon hardware. Load Avarage under 1*24.00 = 24.00 is considered normal. On such a server whether load avarage jumps to 50.00 / 70.00 or above server becomes totally irresponsive and it is very likely to hang because of over-heating. Even if it continues working it will work extremely slow and even simply operations like ssh to it will become hardly possible and sometimes even access via ssh will be not possible.
Therefore Rule of Thumb for calculating which load avarage is okay for a server is;
Number of CPU / Cores should not exceed digit returned in Load Avarage stats
c) Critical – Load avarage >5 – A sure sign for unresponsive or soon to hang server
On Computers with just 1 CPU, load avarage of 5 is sure sign running services will lag brutally and server will become inaccessible. For multicore / multiprocessor servers big troubles can be expected, whether load avarage is about 1/2 of the maximum number of of Load Avarage; (for 8 CPU Multicore hardware). A load avarage of 8 + ( 1/2 * 8 ) = 12 is sure sign system is stoned and running services inaccessible.
d) load avarage: 1.74, 1.90, 1.83 – Is 1 / 5 or 15 minutes LA numbers more important to consider?
All are important however 5 and 15 minutes load avg. give better indication on what's happening with machine as current load can peak for just a second to a higher number, being misleading.
To get number of CPU / Cores use cmd;
mail:/home/hipo# grep 'model name' /proc/cpuinfo | wc -l

24
For more precise info on CPU type and model use;
mail:/home/hipo# cat /proc/cpuinfo
processor : 0
vendor_id : GenuineIntel
cpu family : 6
model : 44
model name : Intel(R) Xeon(R) CPU E5645 @ 2.40GHz
stepping : 2
cpu MHz : 2400.094
cache size : 12288 KB
physical id : 0
siblings : 12
core id : 0
cpu cores : 6
apicid : 0
initial apicid : 0
fpu : yes
fpu_exception : yes
cpuid level : 11
wp : yes
flags : fpu vme de pse tsc msr pae mce cx8 apic sep mtrr pge mca cmov pat pse36 clflush dts acpi mmx fxsr sse sse2 ss ht tm pbe syscall nx pdpe1gb rdtscp lm constant_tsc arch_perfmon pebs bts rep_good xtopology nonstop_tsc aperfmperf pni dtes64 monitor ds_cpl vmx smx est tm2 ssse3 cx16 xtpr pdcm dca sse4_1 sse4_2 popcnt lahf_lm ida arat tpr_shadow vnmi flexpriority ept vpid
bogomips : 4800.18
clflush size : 64
cache_alignment : 64
address sizes : 40 bits physical, 48 bits virtual
power management:
……
………
If you hit abnormal high load avarage, it is useful to check in top process list what is top process / processes causing highest system load. It is useful to run ps with following arguments
mail:/home/hipo# ps axuwwf
Look in STAT column. Processes in STAT have 3 states;
- R – Running
- S – Sleeping
- D – Waiting for something
Usually processes with status of D – are ones causing problems. If you get D STAT-ed processes check further what's wrong with them and fix it. If there are none, simply, number of clients using machine pop-ed up meaning you need to quickly move to better hardware host.
e) Getting notified via email whether load avarage exceeds certain value
A good way to get notified or do certain action like restarting Apache WebServer or other common process causing high loads is through monit. Monit is very usefukl for notifying on high load avarages or even better for Restarting processes imposing high loads.
You can always use a few liners shell script to mail to email or SMS2Email mailbox similar to this tiny shell script to restart apache on high load.There is also a Ruby lang tool – Scout to monitor and report high load avarages
More helpful Articles

Tags: cpu time, digits, disk input, freak, good understanding, hipo, Linux, linux system administrator, mail, oper, queue, sshd, statistics, time period


