Posts Tagged ‘available’

Check the Type and Model of available installed Memory on Linux / Unix / BSD Server howto

Monday, October 30th, 2023

how-linux-kernel-manages-memory-picture

As a system administrator one of the common task, one has to do is Add / Remove or Replace (of Broken or failing Bank of RAM memory) a piece of additional Bank of memory Bank to a Linux / BSD / Unix server.  Lets say you need to fullfil the new RAM purchase and provide some information to the SDM (Service Delivery Manager) of the compnay you're hirder in or you need to place the purchase yourself. Then you  need to know the exact speed and type of RAM currently installed on the server installed.

In this article i'll shortly explain how do I find out ram (SDRAM) information from a via ordinary remote ssh shell session cmd prompt. In short will be shown how can one check RAM speed configured and detected by Linux / Unix kernel ? 
As well as  how to Check the type of memory (if it is DDR / DDR2 / DDR or DDR4) or ECC with no access to Hardware Console.  Please note this article will be definitely boring for the experienced sysadmins but might help to a starter sysadmins to get on board with a well know basic stuff.

There are several approaches, of course easiest one is to use remote hardware access interrace statistics web interface of ILO (on IBM machine) or the IDRAC on (Dell Server) or Fujitsu's servers iRMC. However as not always access to remote Remote hardware management interface is available to admin. Linux comes with few commands that can do the trick, that are available to most Linux distributions straight for the default package repositories.

Since mentioning about ECC a bit up, most old school admins and computer users knows pretty well about DDRs as they have been present over time but ECC is being used over actively on servers perhaps over the last 10 / 15 years and for those not dealt with it below is a short description on what is ECC RAM Memory.

ECC RAM, short for Error Correcting Code Random Access Memory, is a kind of RAM can detect most common kinds of memory errors and correct a subset of them. ECC RAM is common in enterprise deployments and most server-class hardware. Above a certain scale and memory density, single-bit errors which were up to this point are sufficiently statistically unlikely begin to occur with enough frequency that they can no longer be ignored. At certain scales and densities of memory arbitrary memory errors that are literally "one in a million chances" (or more) may in fact occur several times throughout a system's operational life.

Putting some basics, Lets proceed and Check RAM speed and type (line DDR or DDR2 or DDR3 or DDR4) without having to physically go to the the Data Center numbered rack that is containing the server.


Most famous and well known (also mentioned) on few occasions in my previous articles are: dmidecode and lshw

Quickest way to get a quick overview of installed servers memory is with:
 

root@server:~# dmidecode -t memory | grep -E "Speed:|Type:" | sort | uniq -c
      4     Configured Memory Speed: 2133 MT/s
     12     Configured Memory Speed: Unknown
      4     Error Correction Type: Multi-bit ECC
      2     Speed: 2133 MT/s
      2     Speed: 2400 MT/s
     12     Speed: Unknown
     16     Type: DDR4


To get more specifics on the exact type of memory installed on the server, the respective slots that are already taken and the free ones:

root@server:~# dmidecode –type 17 | less

Usually the typical output the command would produce regarding lets say 4 installed Banks of RAM memory on the server will be like:

Handle 0x002B, DMI type 17, 40 bytes
Memory Device
        Array Handle: 0x0029
        Error Information Handle: Not Provided
        Total Width: 72 bits
        Data Width: 64 bits
       
Size: 16 GB
        Form Factor: RIMM
        Set: None
        Locator: CPU1 DIMM A1
        Bank Locator: A1_Node0_Channel0_Dimm1
       
Type: DDR4
        Type Detail: Synchronous
       
Speed: 2400 MT/s
        Manufacturer: Micron
       
Serial Number: 15B36358
        Asset Tag: CPU1 DIMM A1_AssetTag
       
Part Number: 18ASF2G72PDZ-2G3B1 
        Rank: 2
       
Configured Memory Speed: 2133 MT/s
        Minimum Voltage: Unknown
        Maximum Voltage: Unknown
        Configured Voltage: Unknown

Handle 0x002E, DMI type 17, 40 bytes
Memory Device
        Array Handle: 0x0029
        Error Information Handle: Not Provided
        Total Width: Unknown
        Data Width: Unknown
        Size: No Module Installed
        Form Factor: RIMM
        Set: None
        Locator: CPU1 DIMM A2
        Bank Locator: A1_Node0_Channel0_Dimm2
        Type: DDR4
        Type Detail: Synchronous
        Speed: Unknown
        Manufacturer: NO DIMM
        Serial Number: NO DIMM
        Asset Tag: NO DIMM
        Part Number: NO DIMM
        Rank: Unknown
        Configured Memory Speed: Unknown
        Minimum Voltage: Unknown
        Maximum Voltage: Unknown
        Configured Voltage: Unknown


Handle 0x002D, DMI type 17, 40 bytes
Memory Device
        Array Handle: 0x0029
        Error Information Handle: Not Provided
        Total Width: 72 bits
        Data Width: 64 bits
        Size: 16 GB
        Form Factor: RIMM
        Set: None
        Locator: CPU1 DIMM B1
        Bank Locator: A1_Node0_Channel1_Dimm1
        Type: DDR4
        Type Detail: Synchronous
        Speed: 2400 MT/s
        Manufacturer: Micron
        Serial Number: 15B363AF
        Asset Tag: CPU1 DIMM B1_AssetTag
        Part Number: 18ASF2G72PDZ-2G3B1 
        Rank: 2
        Configured Memory Speed: 2133 MT/s
        Minimum Voltage: Unknown
        Maximum Voltage: Unknown
        Configured Voltage: Unknown

Handle 0x0035, DMI type 17, 40 bytes
Memory Device
        Array Handle: 0x0031
        Error Information Handle: Not Provided
        Total Width: 72 bits
        Data Width: 64 bits
        Size: 16 GB
        Form Factor: RIMM
        Set: None
        Locator: CPU1 DIMM D1
        Bank Locator: A1_Node0_Channel3_Dimm1
        Type: DDR4
        Type Detail: Synchronous
        Speed: 2133 MT/s
        Manufacturer: Micron
        Serial Number: 1064B491
        Asset Tag: CPU1 DIMM D1_AssetTag
        Part Number: 36ASF2G72PZ-2G1A2  
        Rank: 2
        Configured Memory Speed: 2133 MT/s
        Minimum Voltage: Unknown
        Maximum Voltage: Unknown
        Configured Voltage: Unknown

Handle 0x0033, DMI type 17, 40 bytes
Memory Device
        Array Handle: 0x0031
        Error Information Handle: Not Provided
        Total Width: 72 bits
        Data Width: 64 bits
        Size: 16 GB
        Form Factor: RIMM
        Set: None
        Locator: CPU1 DIMM C1
        Bank Locator: A1_Node0_Channel2_Dimm1
        Type: DDR4
        Type Detail: Synchronous
        Speed: 2133 MT/s
        Manufacturer: Micron
        Serial Number: 10643A5B
        Asset Tag: CPU1 DIMM C1_AssetTag
        Part Number: 36ASF2G72PZ-2G1A2  
        Rank: 2
        Configured Memory Speed: 2133 MT/s
        Minimum Voltage: Unknown
        Maximum Voltage: Unknown
        Configured Voltage: Unknown


The marked in green are the banks of memory that are plugged in the server. The

field Speed: and Configured Memory Speed: are fields indicating respectively the Maximum speed on which a plugged-in RAM bank can operate and the the actual Speed the Linux kernel has it configured and uses is at.

It is useful for the admin to usually check the complete number of available RAM slots on a server, this can be done with command like:

root@server:~#  dmidecode –type 17 | grep -i Handle | grep 'DMI'|wc -l
16


As you can see at this specific case 16 Memory slots are avaiable (4 are already occupied and working configured on the machine at 2133 Mhz and 12 are empty and can have installed a memory banks in).


Perhaps the most interesting information for the RAM replacement to be ordered is to know the data communication SPEED on which the Memory is working on the server and interacting with Kernel and Processor to find out.

root@server:~#  dmidecode –type 17 | grep -i "speed"|grep -vi unknown
    Speed: 2400 MT/s
    Configured Memory Speed: 2133 MT/s
    Speed: 2400 MT/s
    Configured Memory Speed: 2133 MT/s
    Speed: 2133 MT/s
    Configured Memory Speed: 2133 MT/s
    Speed: 2133 MT/s
    Configured Memory Speed: 2133 MT/s


If you're lazy to remember the exact dmidecode memory type 17 you can use also memory keyword:

root@server:~# dmidecode –type memory | more

For servers that have the lshw command installed, a quick overview of RAM installed and Full slots available for memory placement can be done with:
 

root@server:~#  lshw -short -C memory
H/W path                 Device        Class          Description
=================================================================
/0/0                                   memory         64KiB BIOS
/0/29                                  memory         64GiB System Memory
/0/29/0                                memory         16GiB RIMM DDR4 Synchronous 2400 MHz (0.4 ns)
/0/29/1                                memory         RIMM DDR4 Synchronous [empty]
/0/29/2                                memory         16GiB RIMM DDR4 Synchronous 2400 MHz (0.4 ns)
/0/29/3                                memory         RIMM DDR4 Synchronous [empty]
/0/29/4                                memory         16GiB RIMM DDR4 Synchronous 2133 MHz (0.5 ns)
/0/29/5                                memory         RIMM DDR4 Synchronous [empty]
/0/29/6                                memory         16GiB RIMM DDR4 Synchronous 2133 MHz (0.5 ns)
/0/29/7                                memory         RIMM DDR4 Synchronous [empty]
/0/29/8                                memory         RIMM DDR4 Synchronous [empty]
/0/29/9                                memory         RIMM DDR4 Synchronous [empty]
/0/29/a                                memory         RIMM DDR4 Synchronous [empty]
/0/29/b                                memory         RIMM DDR4 Synchronous [empty]
/0/29/c                                memory         RIMM DDR4 Synchronous [empty]
/0/29/d                                memory         RIMM DDR4 Synchronous [empty]
/0/29/e                                memory         RIMM DDR4 Synchronous [empty]
/0/29/f                                memory         RIMM DDR4 Synchronous [empty]
/0/43                                  memory         768KiB L1 cache
/0/44                                  memory         3MiB L2 cache
/0/45                                  memory         30MiB L3 cache

Now once we know the exact model and RAM Serial and Part number you can google it online and to purchase more of the same RAM Model and Type you need so the installed memory work on the same Megaherzes as the installed ones.
 

iSH, the best free SSH / Telnet client for iOS iPhone, iPad equivallent of MobaXterm and fully functional Alpine Linux emulator

Wednesday, February 8th, 2023

ish-linux-terminal-emulator-for-iphone-ipad-ios-logo-screenshoticon

Since few months I've switched my old BLU r1 HD Phone (a great old low budget phone for its price) to a friend's iPhone 10 ( X ) who gifted it for me. Coming from Android world, everyone who has experience with it is a pain in the ass as some of the Apps, which are into Google's play store does not have the same equivalent into Apple's install Package manager tool AppStore. Some of the crucial tools which I was interested as a freshly new migrated user from Android to iPhone was to have a decent SSH / Telnet client and Terminal, with which I can easily connect to my Linux servers both home and work. 

As Android Phone user, to connect and manage my SSH sessions I used most often some of the most popular Connectbot / SSHDroid / JuiceSSH.
On Android I've usually installed all of these tools but most frequently used Connectbot, which quickly become my favourite SSH client for Android over time.

The reasons why I really loved Connectbot and used it on Android OS in short:

  • It is Completely free
  • Ad-free
  • Open-source (too bad not Free software but still step better)
  • Copy and paste text between Applications
  • Customizable interface (i.e. font size, keyboard layout, SSH auth agent, etc.)


connectbot-android-ssh-remote-connect-client-screenshot

I've seen some people used and preferred Termius but never myself really liked this client, as it was including some Advertisements or for don't remember why reason.
Switching to iOS mobile operating system, of course was quite a shock especially the moment I found out the standard loved SSH Remote Client programs are used are not available or have only a paid version. Thus it took me quite a while of a research and googling until I found some decent stuff.

termius-ssh-telnet-client-ios-screenshot

Tried for a time with Termius as well but again, its Ads and lack of some functionality pissed me off, so I've moved on to Shelly.

shelly-iphone-ssh-telnet-client-ios-screenshot

Shelly is really not a bad tool but has limitation over the SSH sessions you can add and other limitations, which can only be unlocked with an "Upgrade", to its paid version, thus I decided after few weeks of attempts to make it my remote server management mobile tool for iPhone, I've dropped it off as well.

Then I found the Blink Shell App – Blink Shell is a professional, desktop grade terminal for iOS. As overall the tool is really great and is easy to use but again to have it used in its full power you need the paid version and until you pay for it every now and then you got interruption of your shell for some really annoying ads.
Thus even though I used it for a times this few tools with whom basicly you can do basic remote ssh / telnet session operations eventually,  started looking for a better SSH Client Free alternative for iPhone Users.

Then came a friend at home for a dinner my dear friend Milen (Static) and he show me iOS.
The moment I saw this tool I totally loved it, for its simplicity and its resemblance to a classical TTY Physical old Linux console I used back in the days and its ability to resemble easily any improved functionaltiy through simple screen (multiple session management) command tool or tmux.

Wait, what's iSH ? And why it is the Best SSH / Telnet client to manage your servers remotely on iOS Mobiles (iPhone and IPads) ? 

iSH is a project to get a Linux shell environment running locally on your iOS device, using a usermode x86 emulator.


In other wors iSH is Linux emulator with busybox and a package ports for many of the standard Linux tools you get by simple apt-get / yum or if I have to compare you get via the MobaXterm's advanced apt-cyg (Cygwin packages) tool capabilities.

Once iSH is installed it comes with pre-installed apk command line package management tool, with which you can install stuff like openssh-client / screen / tmux / mc (midnight commander) etc. apk, is an apt like command like tool which uses as a basis for installing its packages Alpine Linux repositories.
Alpine Linux is perhaps little known as it is not one of these main stream disributions, such as Fedora or Ubuntu, but for those more concerned about security  Alpine Linux is well known as it is a security-oriented, lightweight Linux distribution based on musl libc and busybox. What makes the Linux even more attractive and perhaps the reason why the iSH developers decided to use it as a basis for their iSH emulator is it being actively developed and its tightened security makes it a good compliment to the quite closed and security focused mobile platform iOS.

iSH is available straight from AppStore , so to use it install it and run it (it is really a great news that iOS does not require iphone to be jailbreak – ed, and it is an ordinary installable software straight from AppStore):
iSH, already comes with some of the standard programs you would expect in a Linux environment such as Vi, wget, zip / unzip, and tar.
However to fit it better for my use over ssh and improve its capabilities, as well as support and use multiple Virtual windows ssh, just like you do on a Linux xterm
run from ish shell: 

# apk add openssh-client
# apk add screen
# apk add vim
# apk add mc


ish-screenshot-terminal3-linux-emulator-iphone-alpine

ish-screenshot-terminal2-linux-emulator-iphone-alpine

ish-screenshot-terminal1-linux-emulator-iphone-alpine-linux

I also like to have a Midnight Commander and VIM Text editor installed out of the box to be able to move around in Ncurses interface through my iPhone.

ish-iphone-keyboard-key-shortcuts

Note that, just like most GNU / Linux distributions, iOS shell will run a normal bash shell.
From there on to use iSH as my default SSH client and enable my just installed GNU screen some Windowing beauty for readability whence I use the screen with multiple ssh logins to different servers as well make the screen Virtual consoles to have ability for scroll back and scroll up of console text to work, I do set up the following .screenrc inside my /home/iPhoneuser

The .screenrc to setup on the iSH to easify your work with screen is as follows:
 

# An alternative hardstatus to display a bar at the bottom listing the
# windownames and highlighting the current windowname in blue. (This is only
# enabled if there is no hardstatus setting for your terminal)
hardstatus on
hardstatus alwayslastline
hardstatus string "%{.bW}%-w%{.rW}%n %t%{-}%+w %=%{..G} %H %{..Y} %m/%d %C%a "
# Enable scrolling fix the annoying screen scrolling problem
termcapinfo xterm* ti@:te@
# Scroll up
bindkey -d "^[[5S" eval copy "stuff 5\025"
bindkey -m "^[[5S" stuff 5\025

# Scroll down
bindkey -d "^[[5T" eval copy "stuff 5\004"
bindkey -m "^[[5T" stuff 5\004

# Scroll up more
bindkey -d "^[[25S" eval copy "stuff \025"
bindkey -m "^[[25S" stuff \025

# Scroll down more
bindkey -d "^[[25T" eval copy "stuff \004"
bindkey -m "^[[25T" stuff \004

You can download the same .screenrc file from here straight with wget from the console:

# wget https://www.pc-freak.net/files/.screenrc


Run GNU screen manager


 # screen

You will end up with a screen session, to open a new session for Virtual Terminal use virtual keyboard from ISH and Press

CTRL + A + C

To open other Virtual Windows inside screen just press CTRL + A + C as many times as you need it, each session will appear ina small window on the down corner as you can see in screenshot

ish-terminal-with-screen-multiple-virtual-terminals-screenshot-iphone-ios

To move across the Screen unnamed 3 Virtual Windows 0 ash 1 ash and 2 ash use the Virtual keyboard

for next WIndow use key combination:
 

CTRL + A + N (where + is just to indicate you have to press them once after another and not actually press the + 🙂 )


For Previous Window use:

CTRL + A + P

Or use CTRL + A and type 

:number 3 (where number is the number of window)

The available iSH commands without adding any further packages which are part of the busybox install are as follows:

Available /bin/ directory commands:

arch  ash  base64  bbconfig  busybox  cat  chgrp  chmod  chown  conspy  cp  date  dd  df  dmesg  dnsdomainname  dumpkmap  echo  ed  egrep  false  fatattr  fdflush  fgrep  fsync  getopt  grep  gunzip  gzip  hostname  ionice  iostat  ipcalc  kbd_mode  kill  link  linux32  linux64  ln  login  ls  lzop  makemime  mkdir  mknod  mktemp  more  mount  mountpoint  mpstat  mv  netstat  nice  pidof  ping  ping6  pipe_progress  printenv  ps  pwd  reformime  rev  rm  rmdir  run-parts  sed  setpriv  setserial  sh  sleep  stty  su  sync  tar  touch  true  umount  uname  usleep  watch  zcat  


Available /usr/bin/ commands:    

awk  basename  beep  blkdiscard  bunzip2  bzcat  bzip2  cal  chvt  cksum  clear  cmp  comm  cpio  crontab  cryptpw  cut  dc  deallocvt  diff  dirname  dos2unix  du  dumpleases  eject  env  expand  expr  factor  fallocate  find  flock  fold  free  fuser  getconf  getent  groups  hd  head  hexdump  hostid  iconv  id  install  ipcrm  ipcs  killall  ldd  less  logger  lsof  lsusb  lzcat  lzma  lzopcat  md5sum  mesg  microcom  mkfifo  mkpasswd  nc  nl  nmeter  nohup  nproc  nsenter  nslookup  od  passwd  paste  patch  pgrep  pkill  pmap  printf  pscan  pstree  pwdx  readlink  realpath  renice  reset  resize  scanelf  seq  setkeycodes  setsid  sha1sum  sha256sum  sha3sum  sha512sum  showkey  shred  shuf  smemcap  sort  split  ssl_client  strings  sum  tac  tail  tee  test  time  timeout  top  tr  traceroute  traceroute6  truncate  tty  ttysize  udhcpc6  unexpand  uniq  unix2dos  unlink  unlzma  unlzop  unshare  unxz  unzip  uptime  uudecode  uuencode  vi  vlock  volname  wc  wget  which  whoami  whois  xargs  xxd  xzcat  yes  


If you're a maniac developer you can even use iSH, to do some programs development with vim with Python / Perl or PHP as these are available from the Alpine repositories and installable via a simple apk add packagename for security experts nmap and some security tools are also available but unfortunately not everything is still working as this project is in active development and iOS has some security limitations if OS is not ROOTED 🙂

Hence some of the packages you can install via apk manager will be failing actually.
There is a list of What works and what doesn't still on iSH on the project github wiki check it out here.

There is much more funny stuff you can do with it, and actually my quick research on how people use iSH on their phones lead me to some Videos talking about iOS and Ethical hacking etc, but I'll stop here as I dont have the time to dig deeper to it. 
If you know or have some good use of iSH or some other goody you are using as a hack please share in comments.

Enjoy ! 🙂

How to test RAM Memory for errors in Linux / UNIX OS servers. Find broken memory RAM banks

Friday, December 3rd, 2021

test-ram-memory-for-errors-linux-unix-find-broken-memory-logo


1. Testing the memory with motherboard integrated tools
 

Memory testing has been integral part of Computers for the last 50 years. In the dawn of computers those older perhaps remember memory testing was part of the computer initialization boot. And this memory testing was delaying the boot with some seconds and the user could see the memory numbers being counted up to the amount of memory. With the increased memory modern computers started to have and the annoyance to wait for a memory check program to check the computer hardware memory on modern computers this check has been mitigated or completely removed on some hardware.
Thus under some circumstances sysadmins or advanced computer users might need to check the memory, especially if there is some suspicion for memory damages or if for example a home PC starts crashing with Blue screens of Death on Windows without reason or simply the PC or some old arcane Linux / UNIX servers gets restarted every now and then for now apparent reason. When such circumstances occur it is an idea to start debugging the hardware issue with a simple memory check.

There are multiple ways to test installed memory banks on a server laptop or local home PC both integrated and using external programs.
On servers that is usually easily done from ILO or IPMI or IDRAC access (usually web) interface of the vendor, on laptops and home usage from BIOS or UEFI (Unified Extensible Firmware Interface) acces interface on system boot that is possible as well.
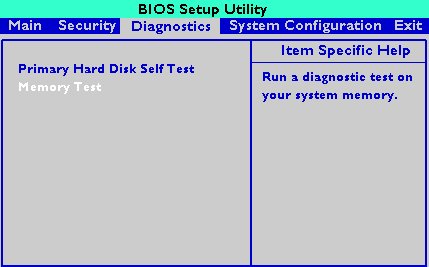
memtest-hp
HP BIOS Setup

An old but gold TIP, more younger people might not know is the


Prolonged SHIFT key press which once held with the user instructs the machine to initiate a memory test before the computer starts reading what is written in the boot loader.

So before anything else from below article it might be a good idea to just try HOLD SHIFT for 15-20 seconds after a complete Shut and ON from the POWER button.

If this test does not triggered or it is triggered and you end up with some corrupted memory but you're not sure which exact Memory bank is really crashing and want to know more on what memory Bank and segments are breaking up you might want to do a more thorough testing. In below article I'll try to explain shortly how this can be done.


2. Test the memory using a boot USB Flash Drive / DVD / CD 
 

Say hello to memtest86+. It is a Linux GRUB boot loader bootable utility that tests physical memory by writing various patterns to it and reading them back. Since memtest86+ runs directly off the hardware it does not require any operating system support for execution. Perhaps it is important to mention that memtest86 (is PassMark memtest86)and memtest86+ (An Advanced Memory diagnostic tool) are different tools, the first is freeware and second one is FOSS software.

To use it all you'll need is some version of Linux. If you don't already have some burned in somewhere at your closet, you might want to burn one.
For Linux / Mac users this is as downloading a Linux distribution ISO file and burning it with

# dd if=/path/to/iso of=/dev/sdbX bs=80M status=progress


Windows users can burn a Live USB with whatever Linux distro or download and burn the latest versionof memtest86+ from https://www.memtest.org/  on Windows Desktop with some proggie like lets say UnetBootIn.
 

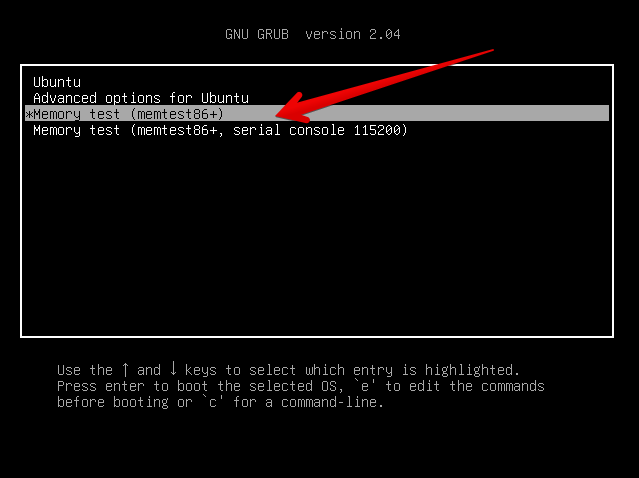
2.1. Run memtest86+ on Ubuntu

Many Linux distributions such as Ubuntu 20.0 comes together with memtest86+, which can be easily invoked from GRUB / GRUB2 Kernel boot loader.
Ubuntu has a separate menu pointer for a Memtest.

ubuntu-grub-2-04-boot-loader-memtest86-menu-screenshot

Other distributions RPM based distributions such as CentOS, Fedora Linux, Redhat things differ.

2.2. memtest86+ on Fedora


Fedora used to have the memtest86+ menu at the GRUB boot selection prompt, but for some reason removed it and in newest Fedora releases as of time such as Fedora 35 memtest86+ is preinstalled and available but not visible, to start on  already and to start a memtest memory test tool:

  •   Boot a Fedora installation or Rescue CD / USB. At the prompt, type "memtest86".

boot: memtest86

2.3 memtest86+ on RHEL Linux

The memtest86+tool is available as an RPM package from Red Hat Network (RHN) as well as a boot option from the Red Hat Enterprise Linux rescue disk.
And nowadays Red Hat Enterprise Linux ships by default with the tool.

Prior redhat (now legacy) releases such as on RHEL 5.0 it has to be installed and configure it with below 3 commands.

[root@rhel ~]# yum install memtest86+
[root@rhel ~]# memtest-setup
[root@rhel ~]# grub2-mkconfig -o /boot/grub2/grub.cfg


    Again as with CentOS to boot memtest86+ from the rescue disk, you will need to boot your system from CD 1 of the Red Hat Enterprise Linux installation media, and type the following at the boot prompt (before the Linux kernel is started):

boot: memtest86

memtestx86-8gigabytes-of-memory-boot-screenshot
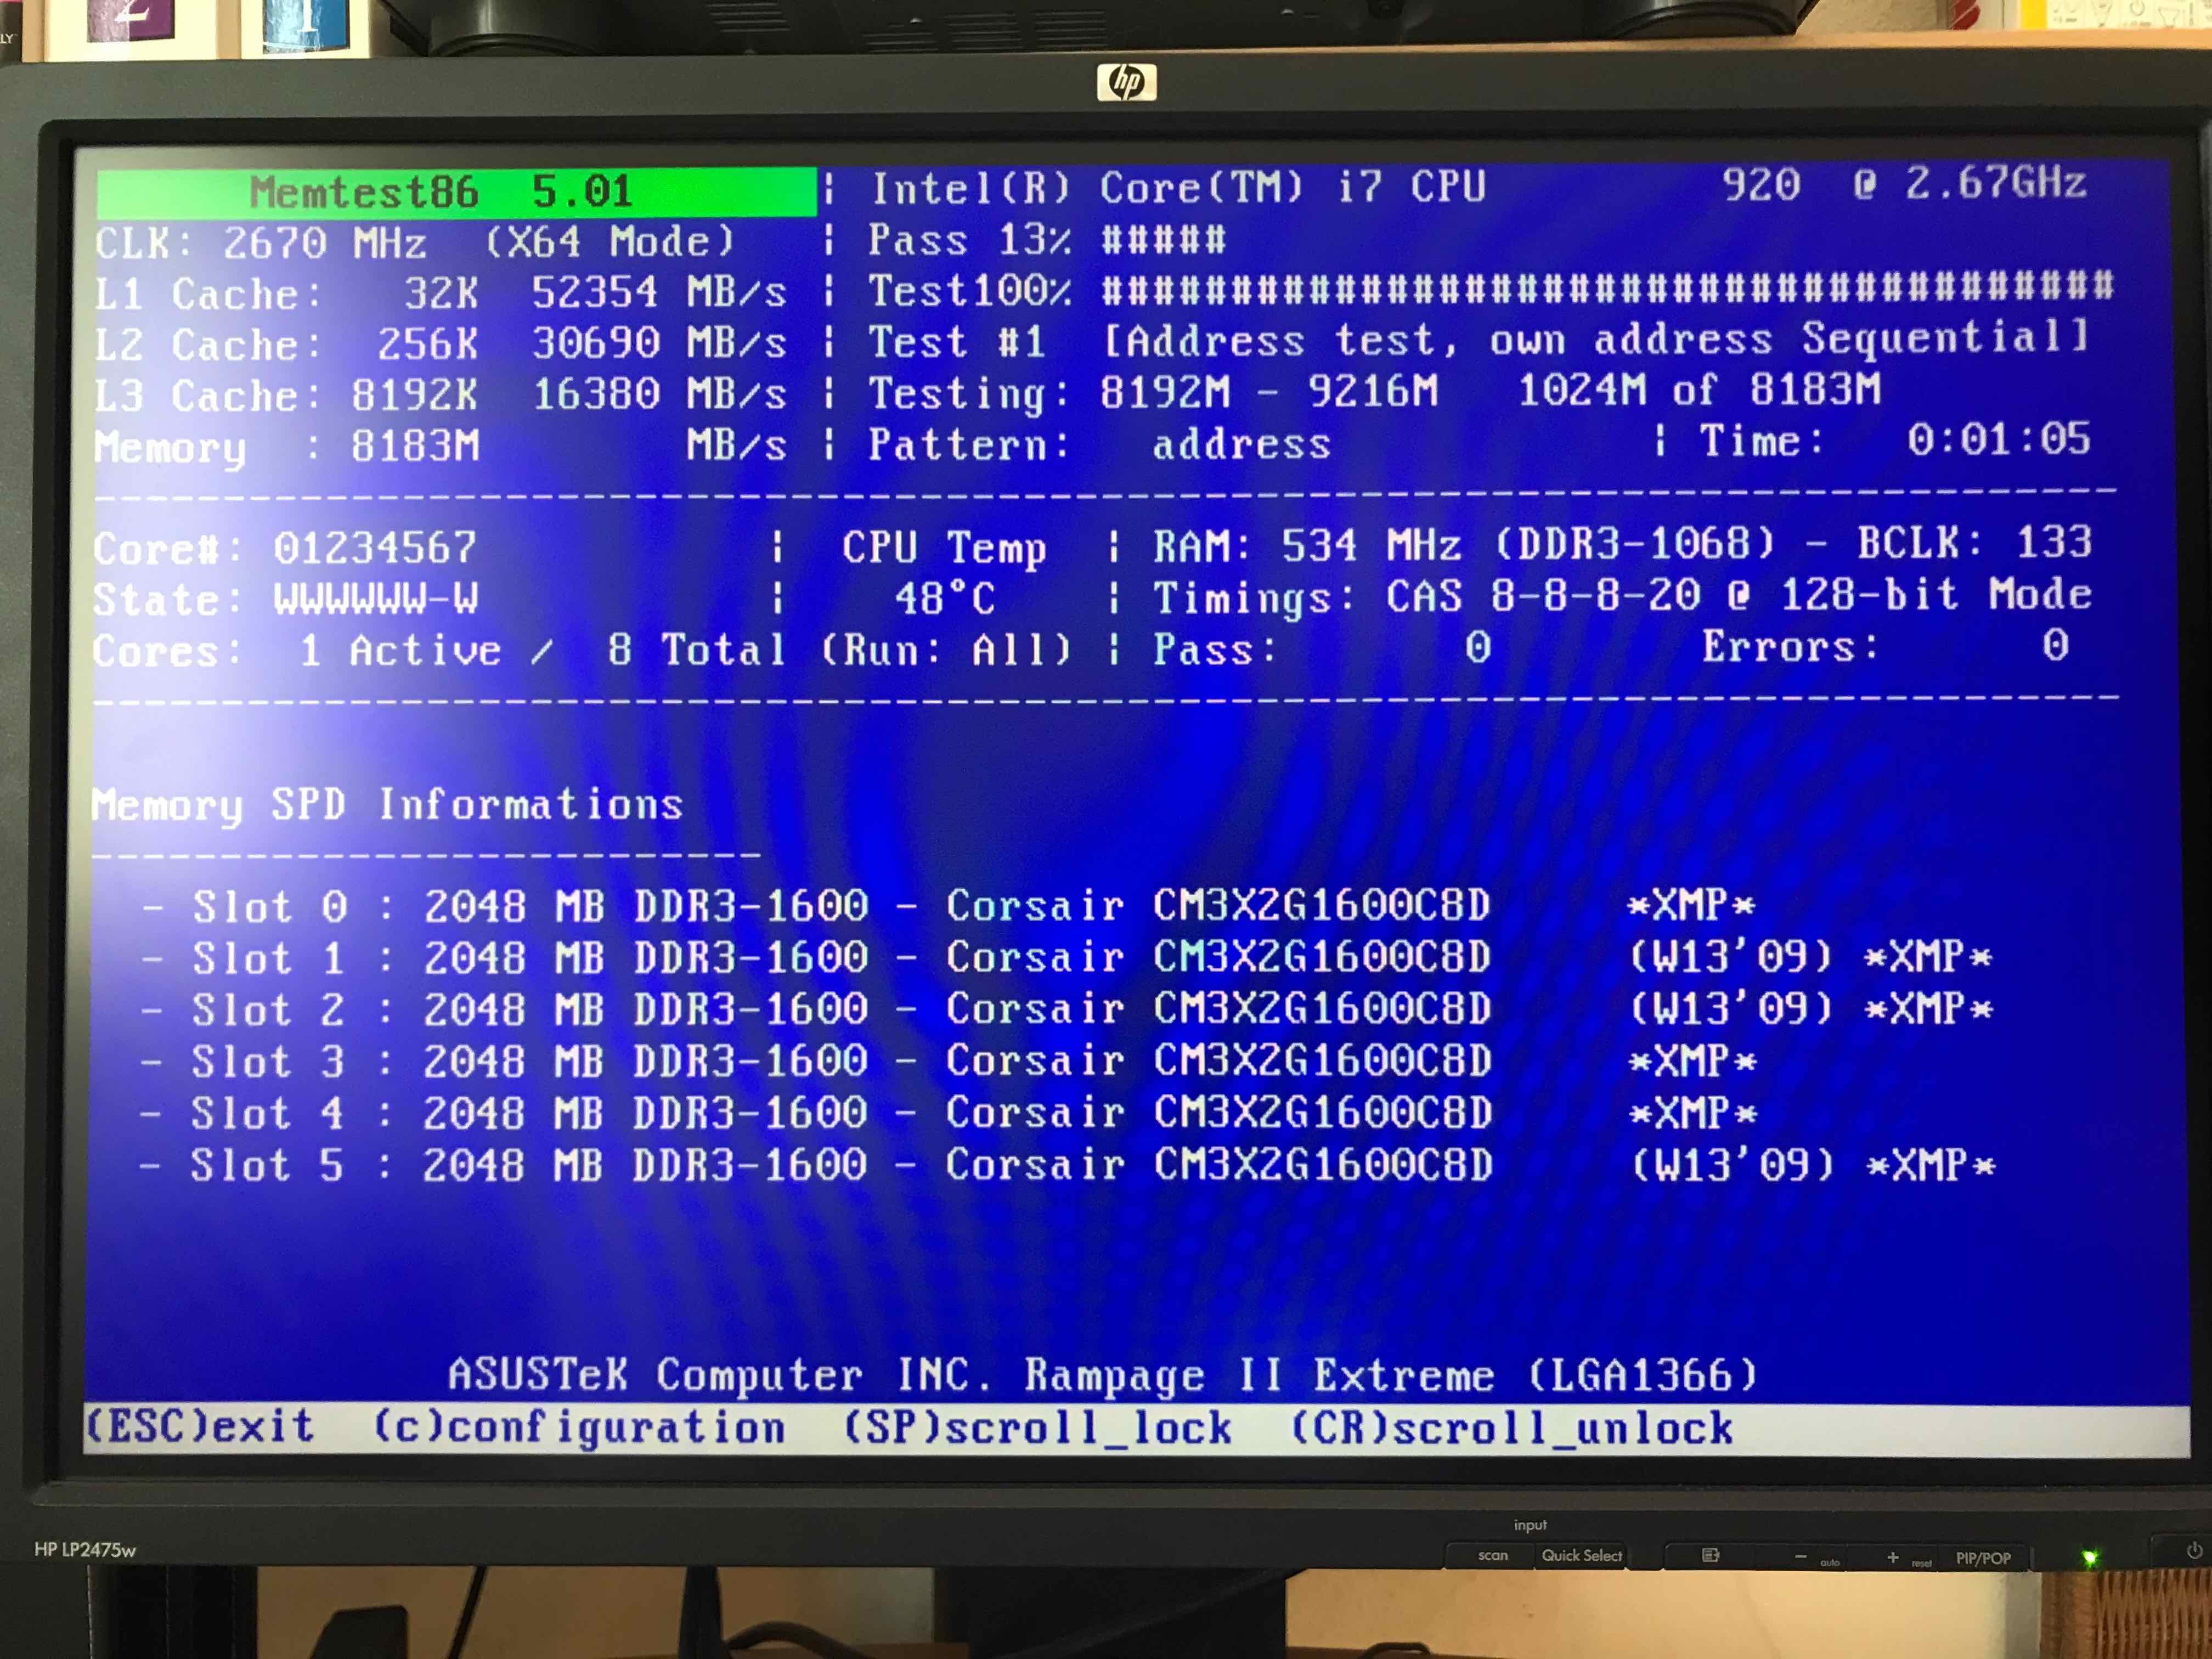
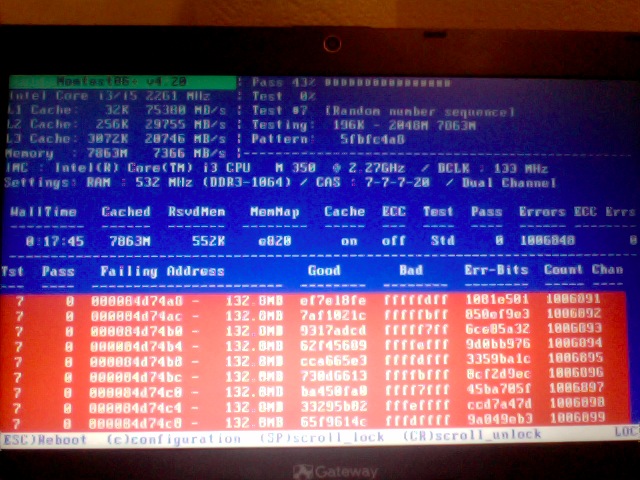
memtest86+ testing 5 memory slots

As you see all on above screenshot the Memory banks are listed as Slots. There are a number of Tests to be completed until
it can be said for sure memory does not have any faulty cells. 
The

Pass: 0
Errors: 0 

Indicates no errors, so in the end if memtest86 does not find anything this values should stay at zero.
memtest86+ is also usable to detecting issues with temperature of CPU. Just recently I've tested a PC thinking that some memory has defects but it turned out the issue on the Computer was at the CPU's temperature which was topping up at 80 – 82 Celsius.

If you're unfortunate and happen to get some corrupted memory segments you will get some red fields with the memory addresses found to have corrupted on Read / Write test operations:

memtest86-returning-memory-address-errors-screenshot


2.4. Install and use memtest and memtest86+ on Debian / Mint Linux

You can install either memtest86+ or just for the fun put both of them and play around with both of them as they have a .deb package provided out of debian non-free /etc/apt/sources.list repositories.


root@jeremiah:/home/hipo# apt-cache show memtest86 memtest86+
Package: memtest86
Version: 4.3.7-3
Installed-Size: 302
Maintainer: Yann Dirson <dirson@debian.org>
Architecture: amd64
Depends: debconf (>= 0.5) | debconf-2.0
Recommends: memtest86+
Suggests: hwtools, memtester, kernel-patch-badram, grub2 (>= 1.96+20090523-1) | grub (>= 0.95+cvs20040624), mtools
Description-en: thorough real-mode memory tester
 Memtest86 scans your RAM for errors.
 .
 This tester runs independently of any OS – it is run at computer
 boot-up, so that it can test *all* of your memory.  You may want to
 look at `memtester', which allows testing your memory within Linux,
 but this one won't be able to test your whole RAM.
 .
 It can output a list of bad RAM regions usable by the BadRAM kernel
 patch, so that you can still use you old RAM with one or two bad bits.
 .
 This is the last DFSG-compliant version of this software, upstream
 has opted for a proprietary development model starting with 5.0.  You
 may want to consider using memtest86+, which has been forked from an
 earlier version of memtest86, and provides a different set of
 features.  It is available in the memtest86+ package.
 .
 A convenience script is also provided to make a grub-legacy-based
 floppy or image.

Description-md5: 0ad381a54d59a7d7f012972f613d7759
Homepage: http://www.memtest86.com/
Section: misc
Priority: optional
Filename: pool/main/m/memtest86/memtest86_4.3.7-3_amd64.deb
Size: 45470
MD5sum: 8dd2a4c52910498d711fbf6b5753bca9
SHA256: 09178eca21f8fd562806ccaa759d0261a2d3bb23190aaebc8cd99071d431aeb6

Package: memtest86+
Version: 5.01-3
Installed-Size: 2391
Maintainer: Yann Dirson <dirson@debian.org>
Architecture: amd64
Depends: debconf (>= 0.5) | debconf-2.0
Suggests: hwtools, memtester, kernel-patch-badram, memtest86, grub-pc | grub-legacy, mtools
Description-en: thorough real-mode memory tester
 Memtest86+ scans your RAM for errors.
 .
 This tester runs independently of any OS – it is run at computer
 boot-up, so that it can test *all* of your memory.  You may want to
 look at `memtester', which allows to test your memory within Linux,
 but this one won't be able to test your whole RAM.
 .
 It can output a list of bad RAM regions usable by the BadRAM kernel
 patch, so that you can still use your old RAM with one or two bad bits.
 .
 Memtest86+ is based on memtest86 3.0, and adds support for recent
 hardware, as well as a number of general-purpose improvements,
 including many patches to memtest86 available from various sources.
 .
 Both memtest86 and memtest86+ are being worked on in parallel.
Description-md5: aa685f84801773ef97fdaba8eb26436a
Homepage: http://www.memtest.org/

Tag: admin::benchmarking, admin::boot, hardware::storage:floppy,
 interface::text-mode, role::program, scope::utility, use::checking
Section: misc
Priority: optional
Filename: pool/main/m/memtest86+/memtest86+_5.01-3_amd64.deb
Size: 75142
MD5sum: 4f06523532ddfca0222ba6c55a80c433
SHA256: ad42816e0b17e882713cc6f699b988e73e580e38876cebe975891f5904828005


root@jeremiah:/home/hipo# apt-get install –yes memtest86+

root@jeremiah:/home/hipo# apt-get install –yes memtest86

Reading package lists… Done
Building dependency tree       
Reading state information… Done
Suggested packages:
  hwtools kernel-patch-badram grub2 | grub
The following NEW packages will be installed:
  memtest86
0 upgraded, 1 newly installed, 0 to remove and 21 not upgraded.
Need to get 45.5 kB of archives.
After this operation, 309 kB of additional disk space will be used.
Get:1 http://ftp.de.debian.org/debian buster/main amd64 memtest86 amd64 4.3.7-3 [45.5 kB]
Fetched 45.5 kB in 0s (181 kB/s)     
Preconfiguring packages …
Selecting previously unselected package memtest86.
(Reading database … 519985 files and directories currently installed.)
Preparing to unpack …/memtest86_4.3.7-3_amd64.deb …
Unpacking memtest86 (4.3.7-3) …
Setting up memtest86 (4.3.7-3) …
Generating grub configuration file …
Found background image: saint-John-of-Rila-grub.jpg
Found linux image: /boot/vmlinuz-4.19.0-18-amd64
Found initrd image: /boot/initrd.img-4.19.0-18-amd64
Found linux image: /boot/vmlinuz-4.19.0-17-amd64
Found initrd image: /boot/initrd.img-4.19.0-17-amd64
Found linux image: /boot/vmlinuz-4.19.0-8-amd64
Found initrd image: /boot/initrd.img-4.19.0-8-amd64
Found linux image: /boot/vmlinuz-4.19.0-6-amd64
Found initrd image: /boot/initrd.img-4.19.0-6-amd64
Found linux image: /boot/vmlinuz-4.19.0-5-amd64
Found initrd image: /boot/initrd.img-4.19.0-5-amd64
Found linux image: /boot/vmlinuz-4.9.0-8-amd64
Found initrd image: /boot/initrd.img-4.9.0-8-amd64
Found memtest86 image: /boot/memtest86.bin
Found memtest86+ image: /boot/memtest86+.bin
Found memtest86+ multiboot image: /boot/memtest86+_multiboot.bin
File descriptor 3 (pipe:[66049]) leaked on lvs invocation. Parent PID 22581: /bin/sh
done
Processing triggers for man-db (2.8.5-2) …


After this both memory testers memtest86+ and memtest86 will appear next to the option of booting a different version kernels and the Advanced recovery kernels, that you usually get in the GRUB boot prompt.

2.5. Use memtest embedded tool on any Linux by adding a kernel variable

Edit-Grub-Parameters-add-memtest-4-to-kernel-boot

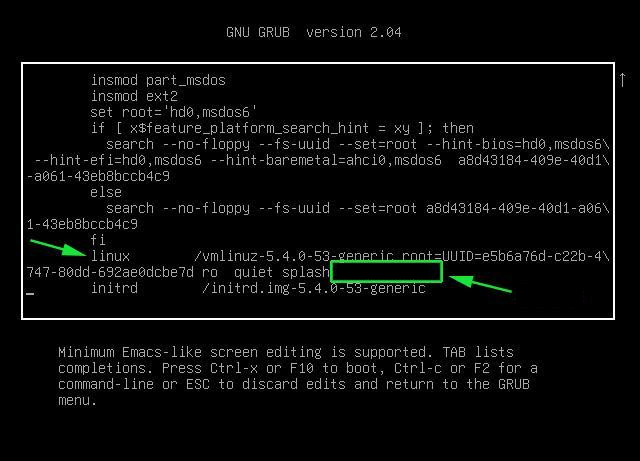
2.4.1. Reboot your computer

# reboot

2.4.2. At the GRUB boot screen (with UEFI, press Esc).

2.4.3 For 4 passes add temporarily the memtest=4 kernel parameter.
 

memtest=        [KNL,X86,ARM,PPC,RISCV] Enable memtest
                Format: <integer>
                default : 0 <disable>
                Specifies the number of memtest passes to be
                performed. Each pass selects another test
                pattern from a given set of patterns. Memtest
                fills the memory with this pattern, validates
                memory contents and reserves bad memory
                regions that are detected.


3. Install and use memtester Linux tool
 

At some condition, memory is the one of the suspcious part, or you just want have a quick test. memtester  is an effective userspace tester for stress-testing the memory subsystem.  It is very effective at finding intermittent and non-deterministic faults.

The advantage of memtester "live system check tool is", you can check your system for errors while it's still running. No need for a restart, just run that application, the downside is that some segments of memory cannot be thoroughfully tested as you already have much preloaded data in it to have the Operating Sytstem running, thus always when possible try to stick to rule to test the memory using memtest86+  from OS Boot Loader, after a clean Machine restart in order to clean up whole memory heap.

Anyhow for a general memory test on a Critical Legacy Server  (if you lets say don't have access to Remote Console Board, or don't trust the ILO / IPMI Hardware reported integrity statistics), running memtester from already booted is still a good idea.


3.1. Install memtester on any Linux distribution from source

wget http://pyropus.ca/software/memtester/old-versions/memtester-4.2.2.tar.gz
# tar zxvf memtester-4.2.2.tar.gz
# cd memtester-4.2.2
# make && make install

3.2 Install on RPM based distros


On Fedora memtester is available from repositories however on many other RPM based distros it is not so you have to install it from source.

[root@fedora ]# yum install -y memtester


3.3. Install memtester on Deb based Linux distributions from source
 

To install it on Debian / Ubuntu / Mint etc. , open a terminal and type:
 

root@linux:/ #  apt install –yes memtester

The general run syntax is:

memtester [-p PHYSADDR] [ITERATIONS]


You can hence use it like so:

hipo@linux:/ $ sudo memtester 1024 5

This should allocate 1024MB of memory, and repeat the test 5 times. The more repeats you run the better, but as a memtester run places a great overall load on the system you either don't increment the runs too much or at least run it with  lowered process importance e.g. by nicing the PID:

hipo@linux:/ $ nice -n 15 sudo memtester 1024 5


  • If you have more RAM like 4GB or 8GB, it is upto you how much memory you want to allocate for testing.
  • As your operating system, current running process might take some amount of RAM, Please check available Free RAM and assign that too memtester.
  • If you are using a 32 Bit System, you cant test more than 4 GB even though you have more RAM( 32 bit systems doesnt support more than 3.5 GB RAM as you all know).
  • If your system is very busy and you still assigned higher than available amount of RAM, then the test might get your system into a deadlock, leads to system to halt, be aware of this.
  • Run the memtester as root user, so that memtester process can malloc the memory, once its gets hold on that memory it will try to apply lock. if specified memory is not available, it will try to reduce required RAM automatically and try to lock it with mlock.
  • if you run it as a regular user, it cant auto reduce the required amount of RAM, so it cant lock it, so it tries to get hold on that specified memory and starts exhausting all system resources.


If you have 8 Gigas of RAM plugged into the PC motherboard you have to multiple 1024*8 this is easily done with bc (An arbitrary precision calculator language) tool:

root@linux:/ # bc -l
bc 1.07.1
Copyright 1991-1994, 1997, 1998, 2000, 2004, 2006, 2008, 2012-2017 Free Software Foundation, Inc.
This is free software with ABSOLUTELY NO WARRANTY.
For details type `warranty'. 
8*1024
8192


 for example you should run:

root@linux:/ # memtester 8192 5

memtester version 4.3.0 (64-bit)
Copyright (C) 2001-2012 Charles Cazabon.
Licensed under the GNU General Public License version 2 (only).

pagesize is 4096
pagesizemask is 0xfffffffffffff000
want 8192MB (2083520512 bytes)
got  8192MB (2083520512 bytes), trying mlock …Loop 1/1:
  Stuck Address       : ok        
  Random Value        : ok
  Compare XOR         : ok
  Compare SUB         : ok
  Compare MUL         : ok
  Compare DIV         : ok
  Compare OR          : ok
  Compare AND         : ok
  Sequential Increment: ok
  Solid Bits          : ok        
  Block Sequential    : ok        
  Checkerboard        : ok        
  Bit Spread          : ok        
  Bit Flip            : ok        
  Walking Ones        : ok        
  Walking Zeroes      : ok        
  8-bit Writes        : ok
  16-bit Writes       : ok

Done.


4. Shell Script to test server memory for corruptions
 

If for some reason the machine you want to run a memory test doesn't have connection to the external network such as the internet and therefore you cannot configure a package repository server and install memtester, the other approach is to use a simple memory test script such as memtestlinux.sh
 

#!/bin/bash
# Downloaded from https://www.srv24x7.com/memtest-linux/
echo "ByteOnSite Memory Test"
cpus=`cat /proc/cpuinfo | grep processor | wc -l`
if [ $cpus -lt 6 ]; then
threads=2
else
threads=$(($cpus / 2))
fi
echo "Detected $cpus CPUs, using $threads threads.."
memory=`free | grep 'Mem:' | awk {'print $2'}`
memoryper=$(($memory / $threads))
echo "Detected ${memory}K of RAM ($memoryper per thread).."
freespace=`df -B1024 . | tail -n1 | awk {'print $4'}`
if [ $freespace -le $memory ]; then
echo You do not have enough free space on the current partition. Minimum: $memory bytes
exit 1
fi
echo "Clearing RAM Cache.."
sync; echo 3 > /proc/sys/vm/drop_cachesfile
echo > dump.memtest.img
echo "Writing to dump file (dump.memtest.img).."
for i in `seq 1 $threads`;
do
# 1044 is used in place of 1024 to ensure full RAM usage (2% over allocation)
dd if=/dev/urandom bs=$memoryper count=1044 >> dump.memtest.img 2>/dev/null &
pids[$i]=$!
echo $i
done
for pid in "${pids[@]}"
do
wait $pid
done

echo "Reading and analyzing dump file…"
echo "Pass 1.."
md51=`md5sum dump.memtest.img | awk {'print $1'}`
echo "Pass 2.."
md52=`md5sum dump.memtest.img | awk {'print $1'}`
echo "Pass 3.."
md53=`md5sum dump.memtest.img | awk {'print $1'}`
if [ “$md51” != “$md52” ]; then
fail=1
elif [ “$md51” != “$md53” ]; then
fail=1
elif [ “$md52” != “$md53” ]; then
fail=1
else
fail=0
fi
if [ $fail -eq 0 ]; then
echo "Memory test PASSED."
else
echo "Memory test FAILED. Bad memory detected."
fi
rm -f dump.memtest.img
exit $fail

Nota Bene !: Again consider the restults might not always be 100% trustable if possible restart the server and test with memtest86+

Consider also its important to make sure prior to script run,  you''ll have enough disk space to produce the dump.memtest.img file – file is created as a test bed for the memory tests and if not scaled properly you might end up with a full ( / ) root directory!


4.1 Other memory test script with dd and md5sum checksum

I found this solution on the well known sysadmin site nixCraft cyberciti.biz, I think it makes sense and quicker.

First find out memory site using free command.
 

# free
             total       used       free     shared    buffers     cached
Mem:      32867436   32574160     293276          0      16652   31194340
-/+ buffers/cache:    1363168   31504268
Swap:            0          0          0


It shows that this server has 32GB memory,
 

# dd if=/dev/urandom bs=32867436 count=1050 of=/home/memtest


free reports by k and use 1050 is to make sure file memtest is bigger than physical memory.  To get better performance, use proper bs size, for example 2048 or 4096, depends on your local disk i/o,  the rule is to make bs * count > 32 GB.
run

# md5sum /home/memtest; md5sum /home/memtest; md5sum /home/memtest


If you see md5sum mismatch in different run, you have faulty memory guaranteed.
The theory is simple, the file /home/memtest will cache data in memory by filling up all available memory during read operation. Using md5sum command you are reading same data from memory.


5. Other ways to test memory / do a machine stress test

Other good tools you might want to check for memory testing is mprime – ftp://mersenne.org/gimps/ 
(https://www.mersenne.org/ftp_root/gimps/)

  •  (mprime can also be used to stress test your CPU)

Alternatively, use the package stress-ng to run all kind of stress tests (including memory test) on your machine.
Perhaps there are other interesting tools for a diagnosis of memory if you know other ones I miss, let me know in the comment section.

ASCII Art studio – A powerful ASCII art editor for Windows / Playscii a cool looking text editor for Linux

Monday, June 28th, 2021

This post is just informative for Text Geeks who are in love with ASCII Art, it is a bit of rant as I will say nothing new, but I thought it might be of interest to some console maniac out there 🙂

ascii art studio aas program windows xp professional drawing program screenshot

While checking stuff on Internet I've stumbled on interesting ASCII arts freak software – >ASCII Art Studio. ASCII Art Studio is unfortunately needs licensing is not Free Software. But anyways, for anyone willing to draw pro ASCII art pictures it is a must see. Check it out;

Isn't it like a Plain Text pro Photoshop ? 🙂 Its a pity we don't have a Linux / BSD Release of this wonderful piece of software. I've tried with WINE (Windows Emulator) on Linux to make the Ascii Art Studio work but that was a fail. It seems only way to make it work is have Windows as a worst case install a Virtual Machine with VirtualBox / Vmware and run it inside if you don't have a Windows PC at hand.

Of course there are stuff on Linux to ascii art edit you can use if you want to have a native software to edit ASCIIs such as Playscii. Unfortunately Playscii is not an easy one to install and the software doesn't have a prepared rpm or deb binary you can easily roll on the OS and you have to manually build all required python modules and have a working version of python3 to be able to make it work.

I did not have much time to test to install it and since I faced issues with plascii install I just abandoned it. If some geek has some more time anyways I guess it is worse to give it a try below is 2 screenshots from PLAYSCII official download page. 

playscii_shot1-official.

As you see authors of the open source playscii whose source is available via github choose to have an amazing looking ascii art text menus, though for daily ASCII art editing it is perhaps much more complicated to use than the simlistic ASCII Art Studio

playscii_shot2-official

There is other stuff for Linux to do ASCII Art files text edit like:
JaVE (this one I don't personally like because it is Java Based),  Ascii Art Maker or Pablow Draw Linux (unfortunately this 2 ones are proprietary).

Postfix copy every email to a central mailbox (send a copy of every mail sent via mail server to a given email)

Wednesday, October 28th, 2020

Postfix-logo-always-bcc-email-option-send-all-emails-to-a-single-address-with-postfix.svg

Say you need to do a mail server migration, where you have a local configured Postfix on a number of Linux hosts named:

Linux-host1
Linux-host2
Linux-host3

etc.


all configured to send email via old Email send host (MailServerHostOld.com) in each linux box's postfix configuration's /etc/postfix/main.cf.
Now due to some infrastructure change in the topology of network or anything else, you need to relay Mails sent via another asumably properly configured Linux host relay (MailServerNewHost.com).

Usually such a migrations has always a risk that some of the old sent emails originating from local running scripts on Linux-host1, Linux-Host2 … or some application or anything else set to send via them might not properly deliver emails to some external Internet based Mailboxes via the new relayhost MailServerNewHost.com.

E.g. in /etc/postfix/main.cf Linux-Host* machines, you have below config after the migration:

relayhost = [MailServerNewHost.com]

Lets say that you want to make sure, that you don't end up with lost emails as you can't be sure whether the new email server will deliver correctly to the old repicient emails. What to do then?

To make sure will not end up in undelivered state and get lost forever after a week or so (depending on the mail queue configuration retention period made on Linux sent MTAs and mailrelay MailServerNewHost.com, it is a very good approach to temprorary set all email communication that will be sent via MailServerNewHost.com a BCC emaills (A Blind Carbon Copy) of each sent mail via relay that is set on your local configured Postfix-es on Linux-Host*.

In postfix to achieve that it is very easy all you have to do is set on your MailServerNewHost.com a postfix config variable always_bcc smartly included by postfix Mail Transfer Agent developers for cases exactly like this.

To forward all passed emails via the mail server just place in the end of /etc/postfix/mail.conf after login via ssh on MailServerNewHost.com

always_bcc=All-Emails@your-diresired-redirect-email-address.com


Now all left is to reload the postfix to force the new configuration to get loaded on systemd based hosts as it is usually today do:

# systemctl reload postfix


Finally to make sure all works as expected and mail is sent do from do a testing via local MTAs. 
 

Linux-Host:~# echo -e "Testing body" | mail -s "testing subject" -r "testing@test.com" georgi.stoyanov@remote-user-email-whatever-address.com

Linux-Host:~# echo -e "Testing body" | mail -s "testing subject" -r "testing@test.com" georgi.stoyanov@sample-destination-address.com


As you can see I'm using the -r to simulate a sender address, this is a feature of mailx and is not available on older Linux Os hosts that are bundled with mail only command.
Now go to and open the All-Emails@your-diresired-redirect-email-address.com in Outlook (if it is M$ Office 365 MX Shared mailbox), Thunderbird or whatever email fetching software that supports POP3 or IMAP (in case if you configured the common all email mailbox to be on some other Postfix / Sendmail / Qmail MTA). and check whether you started receiving a lot of emails 🙂

That's all folks enjoy ! 🙂

How to check how many processor and volume groups IBM AIX eServer have

Monday, July 13th, 2020

how-many-cpus-are-on-commands-Linux-sysadmin-and-user-show-know-AIX-logo
In daily sysadmin duties I have been usually administrating GNU / Linux or FreeBSD servers.
However now in my daily sysadmin jobs I've been added to do some minor sysadmin activities on  a few IBM AIX eServers UNIX machines.

As the eServers were completely unknown to me and I logged in for a first time I needed a way to get idea on what kind of hardware I'm logging in so I wanted to get information about the Central Processing UNIT CPUs on the host.

On Linux I'm used to do a cat /proc/cpuinfo or do dmidecode etc. to get the number of CPUs, however AIX does not have /proc/cpuinfo and has its own way to get information about the system hardware.
As I've red in the IBM AIX's RedBook to get system information on AIX there is the lscfg command.
 

aix:/# lscfg
INSTALLED RESOURCE LIST

The following resources are installed on the machine.
+/- = Added or deleted from Resource List.
*   = Diagnostic support not available.

  Model Architecture: chrp
  Model Implementation: Multiple Processor, PCI bus

+ sys0                                                            System Object
+ sysplanar0                                                      System Planar
* vio0                                                            Virtual I/O Bus
* vscsi3           U8205.E6B.068D6AP-V4-C21-T1                    Virtual SCSI Client Adapter
* vscsi2           U8205.E6B.068D6AP-V4-C20-T1                    Virtual SCSI Client Adapter
* vscsi1           U8205.E6B.068D6AP-V4-C11-T1                    Virtual SCSI Client Adapter
* hdisk1           U8205.E6B.068D6AP-V4-C11-T1-L8100000000000000  Virtual SCSI Disk Drive
* vscsi0           U8205.E6B.068D6AP-V4-C10-T1                    Virtual SCSI Client Adapter
* hdisk0           U8205.E6B.068D6AP-V4-C10-T1-L8100000000000000  Virtual SCSI Disk Drive
* ent3             U8205.E6B.068D6AP-V4-C5-T1                     Virtual I/O Ethernet Adapter (l-lan)
* ent2             U8205.E6B.068D6AP-V4-C4-T1                     Virtual I/O Ethernet Adapter (l-lan)
* ent1             U8205.E6B.068D6AP-V4-C3-T1                     Virtual I/O Ethernet Adapter (l-lan)
* ent0             U8205.E6B.068D6AP-V4-C2-T1                     Virtual I/O Ethernet Adapter (l-lan)
* vsa0             U8205.E6B.068D6AP-V4-C0                        LPAR Virtual Serial Adapter
* vty0             U8205.E6B.068D6AP-V4-C0-L0                     Asynchronous Terminal
+ L2cache0                                                        L2 Cache
+ mem0                                                            Memory
+ proc0                                                           Processor
+ proc4                                                           Processor


To get the number of processors on the host I've had to use:


aix:/# lscfg|grep -i proc
  Model Implementation: Multiple Processor, PCI bus
+ proc0                                                           Processor
+ proc4                                                           Processor


Another way to get the CPU number is with:

aix:/# lsdev -C -c processor
proc0 Available 00-00 Processor
proc4 Available 00-04 Processor


aix:/# lsattr -EH -l proc4
attribute   value          description           user_settable


frequency   3720000000     Processor Speed       False
smt_enabled true           Processor SMT enabled False
smt_threads 4              Processor SMT threads False
state       enable         Processor state       False
type        PowerPC_POWER7 Processor type        False

aix:/# lsattr -EH -l proc0
attribute   value          description           user_settable


frequency   3720000000     Processor Speed       False
smt_enabled true           Processor SMT enabled False
smt_threads 4              Processor SMT threads False
state       enable         Processor state       False
type        PowerPC_POWER7 Processor type        False


As you can see each of the processor is multicore has 2 Cores and each of the cores have for Threads, to get the overall number of CPUs on the system including the threaded Virtual CPUs:

aix:/# bindprocessor -q
The available processors are:  0 1 2 3 4 5 6 7


This specific machine has overall of 8 CPUs cores.

lscfg can be used to get various useful other info of the iron:

aix:/# lscfg -s
INSTALLED RESOURCE LIST


The following resources are installed on the machine.
+/- = Added or deleted from Resource List.
*   = Diagnostic support not available.

  Model Architecture: chrp
  Model Implementation: Multiple Processor, PCI bus

+ sys0
        System Object
+ sysplanar0
        System Planar
* vio0
        Virtual I/O Bus
* vscsi3           U8305…………….
        Virtual SCSI Client Adapter
* vscsi2           U8305…………….
        Virtual SCSI Client Adapter
* vscsi1           U8305…………….
        Virtual SCSI Client Adapter
* hdisk1           U8305…………….
        Virtual SCSI Disk Drive
* vscsi0           U8305……………..
        Virtual SCSI Client Adapter
* hdisk0           U8305…………….
        Virtual SCSI Disk Drive
* ent3             U8305…………….
        Virtual I/O Ethernet Adapter (l-lan)
* ent2             U8305.E6B…………….
        Virtual I/O Ethernet Adapter (l-lan)
* ent1             U8305.E6B…………….
        Virtual I/O Ethernet Adapter (l-lan)
* ent0             U8305.E6B…………….
        Virtual I/O Ethernet Adapter (l-lan)
* vsa0             U8305.E7B…………….
        LPAR Virtual Serial Adapter
* vty0             U8305.E7B…………….
        Asynchronous Terminal
+ L2cache0
        L2 Cache
+ mem0
        Memory
+ proc0
        Processor
+ proc4
        Processor

aix:/# lscfg -p
INSTALLED RESOURCE LIST

The following resources are installed on the machine.

  Model Architecture: chrp
  Model Implementation: Multiple Processor, PCI bus

  sys0                                                            System Object
  sysplanar0                                                      System Planar
  vio0                                                            Virtual I/O Bus
  vscsi3           U8305.E7B…………….V6-C40-T1                    Virtual SCSI Client Adapter
  vscsi2           U8305.E7B…………….V6-C40-T1                     Virtual SCSI Client Adapter
  vscsi1           U8305.E7B…………….V6-C40-T1                    Virtual SCSI Client Adapter
  hdisk1           U8305.E7B…………….V6-C40-T1-L8500000000000000  Virtual SCSI Disk Drive
  vscsi0           U8305.E7B…………….V6-C40-T1                    Virtual SCSI Client Adapter
  hdisk0           U8305.E7B…………….V6-C40-T1-L8500000000000000  Virtual SCSI Disk Drive
  ent3             U8305.E7B…………….V6-C40-T1                     Virtual I/O Ethernet Adapter (l-lan)
  ent2             U8305.E7B…………….V6-C40-T1                     Virtual I/O Ethernet Adapter (l-lan)
  ent1             U8305.E7B…………….V6-C40-T1                     Virtual I/O Ethernet Adapter (l-lan)
  ent0             U8305.E7B…………….V6-C40-T1                     Virtual I/O Ethernet Adapter (l-lan)
  vsa0             U8305.E7B.069D7AP-V5-C1                        LPAR Virtual Serial Adapter
  vty0             U8305.E7B.069D7AP-V5-D1-L0                     Asynchronous Terminal
  L2cache0                                                        L2 Cache
  mem0                                                            Memory
  proc0                                                           Processor
  proc4                                                           Processor

  PLATFORM SPECIFIC

  Name:  IBM,8305-E7B
    Model:  IBM,8305-E7B
    Node:  /
    Device Type:  chrp

  Name:  openprom
    Model:  IBM,AL730_158
    Node:  openprom

  Name:  interrupt-controller
    Model:  IBM, Logical PowerPC-PIC, 00
    Node:  interrupt-controller@0
    Device Type:  PowerPC-External-Interrupt-Presentation

  Name:  vty
    Node:  vty@30000000
    Device Type:  serial
    Physical Location: …………………………………………..

  Name:  l-lan
    Node:  l-lan@30000002
    Device Type:  network
    Physical Location: …………………………………………..

  Name:  l-lan
    Node:  l-lan@30000003
    Device Type:  network
    Physical Location: …………………………………………..

  Name:  l-lan
    Node:  l-lan@30000004
    Device Type:  network
    Physical Location: …………………………………………..

  Name:  l-lan
    Node:  l-lan@30000005
    Device Type:  network
    Physical Location: …………………………………………..

  Name:  v-scsi
    Node:  v-scsi@3000005a
    Device Type:  vscsi
    Physical Location: …………………………………………..

  Name:  v-scsi
    Node:  v-scsi@3000005b
    Device Type:  vscsi
    Physical Location: …………………………………………..

  Name:  v-scsi
    Node:  v-scsi@30000014
    Device Type:  vscsi
    Physical Location: ………………………………..

  Name:  v-scsi
    Node:  v-scsi@30000017
    Device Type:  vscsi
    Physical Location: …………………………………


Another useful command I found is to list the equivalent of Linux's LVM Logical Volumes configured on the system, below is how:

aix:/# lspv hdisk0
00f68c6a84acb0d5 rootvg active hdisk1 00f69d6a85400468 dsvg active

To get more info on a volume group:

aix:/# lspv hdisk0 PHYSICAL VOLUME: hdisk0 VOLUME GROUP: rootvg PV IDENTIFIER: 00f68d6a85acb0d5 VG IDENTIFIER 00f68d6a00004c0000000131353444a5 PV STATE: active STALE PARTITIONS: 0 ALLOCATABLE: yes PP SIZE: 32 megabyte(s) LOGICAL VOLUMES: 12 TOTAL PPs: 959 (30688 megabytes) VG DESCRIPTORS: 2 FREE PPs: 493 (15776 megabytes) HOT SPARE: no USED PPs: 466 (14912 megabytes) MAX REQUEST: 256 kilobytes FREE DISTRIBUTION: 191..00..00..110..192 USED DISTRIBUTION: 01..192..191..82..00 MIRROR POOL: None


You can get which local configured partition is set on which ( PV )Physical Volume

aix:/# lspv -l hdisk0
hdisk0:
LV NAME               LPs     PPs     DISTRIBUTION          MOUNT POINT
lg_dumplv             64      64      00..64..00..00..00    N/A
hd8                   1       1       00..00..01..00..00    N/A
hd6                   16      16      00..16..00..00..00    N/A
hd2                   166     166     00..45..89..32..00    /usr
hd4                   29      29      00..11..18..00..00    /
hd3                   40      40      00..04..04..32..00    /tmp
hd9var                55      55      00..00..37..18..00    /var
hd10opt               74      74      00..37..37..00..00    /opt
hd1                   8       8       00..07..01..00..00    /home
hd5                   1       1       01..00..00..00..00    N/A

Report haproxy node switch script useful for Zabbix or other monitoring

Tuesday, June 9th, 2020

zabbix-monitoring-logo
For those who administer corosync clustered haproxy and needs to build monitoring in case if the main configured Haproxy node in the cluster is changed, I've developed a small script to be integrated with zabbix-agent installed to report to a central zabbix server via a zabbix proxy.
The script  is very simple it assumed DC1 variable is the default used haproxy node and DC2 and DC3 are 2 backup nodes. The script is made to use crm_mon which is not installed by default on each server by default so if you'll be using it you'll have to install it first, but anyways the script can easily be adapted to use pcs cmd instead.

Below is the bash shell script:

UserParameter=active.dc,f=0; for i in $(sudo /usr/sbin/crm_mon -n -1|grep -i 'Node ' |awk '{ print $2 }'); do ((f++)); DC[$f]="$i"; done; \
DC=$(sudo /usr/sbin/crm_mon -n -1 | grep 'Current DC' | awk '{ print $1 " " $2 " " $3}' | awk '{ print $3 }'); \
if [ “$DC” == “${DC[1]}” ]; then echo “1 Default DC Switched to ${DC[1]}”; elif [ “$DC” == “${DC[2]}” ]; then \
echo "2 Default DC Switched to ${DC[2]}”; elif [ “$DC” == “${DC[3]}” ]; then echo “3 Default DC: ${DC[3]}"; fi


To configure it with zabbix monitoring it can be configured via UserParameterScript.

The way I configured  it in Zabbix is as so:


1. Create the userpameter_active_node.conf

Below script is 3 nodes Haproxy cluster

# cat > /etc/zabbix/zabbix_agentd.d/userparameter_active_node.conf

UserParameter=active.dc,f=0; for i in $(sudo /usr/sbin/crm_mon -n -1|grep -i 'Node ' |awk '{ print $2 }'); do ((f++)); DC[$f]="$i"; done; \
DC=$(sudo /usr/sbin/crm_mon -n -1 | grep 'Current DC' | awk '{ print $1 " " $2 " " $3}' | awk '{ print $3 }'); \
if [ “$DC” == “${DC[1]}” ]; then echo “1 Default DC Switched to ${DC[1]}”; elif [ “$DC” == “${DC[2]}” ]; then \
echo "2 Default DC Switched to ${DC[2]}”; elif [ “$DC” == “${DC[3]}” ]; then echo “3 Default DC: ${DC[3]}"; fi

Once pasted to save the file press CTRL + D


The version of the script with 2 nodes slightly improved is like so:
 

UserParameter=active.dc,f=0; for i in $(sudo /usr/sbin/crm_mon -n -1|grep -i 'Node ' |awk '{ print $2 }' | sed -e 's#:##g'); do DC_ARRAY[$f]=”$i”; ((f++)); done; GET_CURR_DC=$(sudo /usr/sbin/crm_mon -n -1 | grep ‘Current DC’ | awk ‘{ print $1 ” ” $2 ” ” $3}’ | awk ‘{ print $3 }’); if [ “$GET_CURR_DC” == “${DC_ARRAY[0]}” ]; then echo “1 Default DC ${DC_ARRAY[0]}”; fi; if [ “$GET_CURR_DC” == “${DC_ARRAY[1]}” ]; then echo “2 Default Current DC Switched to ${DC_ARRAY[1]} Please check “; fi; if [ -z “$GET_CURR_DC” ] || [ -z “$DC_ARRAY[1]” ]; then printf "Error something might be wrong with HAProxy Cluster on  $HOSTNAME "; fi;


The haproxy_active_DC_zabbix.sh script with a bit of more comments as explanations is available here 
2. Configure access for /usr/sbin/crm_mon for zabbix user in sudoers


# vim /etc/sudoers

zabbix          ALL=NOPASSWD: /usr/sbin/crm_mon


3. Configure in Zabbix for active.dc key Trigger and Item

active-node-switch1

Why du and df reporting different on a filesystem / How to fix inconsistency between used space on FS and disk showing full strangeness

Wednesday, July 24th, 2019

linux-why-du-and-df-shows-different-result-inconsincy-explained-filesystem-full-oddity

If you're a sysadmin on a large server environment such as a couple of hundred of Virtual Machines running Linux OS on either physical host or OpenXen / VmWare hosted guest Virtual Machine, you might end up sometimes at an odd case where some mounted partition mount point reports its file use different when checked with
df
cmd than when checked with du command, like for example:
 

root@sqlserver:~# df -hT /var/lib/mysql
Filesystem   Type  Size Used Avail Use% Mounted On
/dev/sdb5      ext4    19G  3,4G    14G  20% /var/lib/mysql

Here the '-T' argument is used to show us the filesystem.

root@sqlserver:~# du -hsc /var/lib/mysql
0K    /var/lib/mysql/
0K    total


1. Simple debug on what might be the root cause for df / du inconsistency reporting


Of course the basic thing to do when in that weird situation is to be totally shocked how this is possible and to investigate a bit what is the biggest first level sub-directories that eat up the space on the mounted location, with du:


# du -hkx –max-depth=1 /var/lib/mysql/|uniq|sort -n
4       /var/lib/mysql/test
8       /var/lib/mysql/ezmlm
8       /var/lib/mysql/micropcfreak
8       /var/lib/mysql/performance_schema
12      /var/lib/mysql/mysqltmp
24      /var/lib/mysql/speedtest
64      /var/lib/mysql/yourls
144     /var/lib/mysql/narf
320     /var/lib/mysql/webchat_plus
424     /var/lib/mysql/goodfaithair
528     /var/lib/mysql/moonman
648     /var/lib/mysql/daniel
852     /var/lib/mysql/lessn
1292    /var/lib/mysql/gallery

The given output is in Kilobytes so it is a little bit hard to read, if you're used to Mbytes instead, do


 # du -hmx –max-depth=1 /var/lib/mysql/|uniq|sort -n|less


I've also investigated on the complete /var directory contents sorted by size with:


 # du -akx ./ | sort -n
5152564    ./cache/rsnapshot/hourly.2/localhost
5255788    ./cache/rsnapshot/hourly.2
5287912    ./cache/rsnapshot
7192152    ./cache


Even after finding out the bottleneck dirs and trying to clear up a bit, continued facing that inconsistently shown in two commands and if you're likely to be stunned like me and try … to move some files to a different filesystem to free up space or assigned inodes with a hope that shown inconsitency output will be fixed as it might be caused  due to some kernel / FS caching ?? and this will eventually make the mounted FS to refresh …

But unfortunately, if you try it you'll figure out clearing up a couple of Megas or Gigas will make no difference in cmd output.

In my exact case /var/lib/mysql is a separate mounted ext4 filesystem, however same issue was present also on a Network Filesystem (NFS) and thus, my first thought that this is caused by a network failure problem or NFS bug turned to be wrong.

After further short investigation on the inodes on the Filesystem, it was clear enough inodes are available:
 

# df -i /var/lib/mysql
Filesystem       Inodes  IUsed   IFree IUse% Mounted on
/dev/sdb5      1221600  2562 1219038   1% /var/lib/mysql


So the filled inodes count assumed issue also has been rejected.
P.S. (if you're not well familiar with them read manual, i.e. – man 7 inode).
 

– Remounting the mounted filesystem

To make sure the filesystem shown inconsistency between du and df is not due to some hanging network mount or bug, first logical thing I did is to remount the filesytem showing different in size, in my case this was done with:
 

# mount -o remount,rw -t ext4 /var/lib/mysql

For machines with NFS remote mounted storage locations, used:

# mount -o remount,rw -t nfs /var/www


FS remount did not solved it so I continued to ponder what oddity and of course I thought of a workaround (in case if this issues are caused by kernel bug or OS lib issue) reboot might be the solution, however unfortunately restarting the VMs was not a wanted easy to do solution, thus I continued investigating what is wrong …

Next check of course was to check, what kind of network connections are opened to the affected hosts with:
 

# netstat -tupanl


Did not found anything that might point me to the reported different Megabytes issue, so next step was to check what is the situation with currently opened files by running processes on the weird df / du reported systems with lsof, and boom there I observed oddity such as multiple files


# lsof -nP | grep '(deleted)'

COMMAND   PID   USER   FD   TYPE DEVICE    SIZE NLINK  NODE NAME
mysqld   2588  mysql    4u   REG 253,17      52     0  1495 /var/lib/mysql/tmp/ibY0cXCd (deleted)
mysqld   2588  mysql    5u   REG 253,17    1048     0  1496 /var/lib/mysql/tmp/ibOrELhG (deleted)
mysqld   2588  mysql    6u   REG 253,17       777884290     0  1497 /var/lib/mysql/tmp/ibmDFAW8 (deleted)
mysqld   2588  mysql    7u   REG 253,17       123667875     0 11387 /var/lib/mysql/tmp/ib2CSACB (deleted)
mysqld   2588  mysql   11u   REG 253,17       123852406     0 11388 /var/lib/mysql/tmp/ibQpoZ94 (deleted)


Notice that There were plenty of '(deleted)' STATE files shown in memory an overall of 438:


# lsof -nP | grep '(deleted)' |wc -l
438


As I've learned a bit online about the problem, I found it is also possible to find deleted unlinked files only without any greps (to list all deleted files in memory files with lsof args only):


# lsof +L1|less


The SIZE field (fourth column)  shows a number of files that are really hard in size and that are kept in open on filesystem and in memory, totally messing up with the filesystem. In my case this is temp files created by MYSQLD daemon but depending on the server provided service this might be apache's www-data, some custom perl / bash script executed via a cron job, stalled rsync jobs etc.
 

2. Check all the list open files with the mysql / root user as part of the the server filesystem inconsistency debugging with:


– Grep opened files on server by user

# lsof |grep mysql
mysqld    1312                       mysql  cwd       DIR               8,21       4096          2 /var/lib/mysql
mysqld    1312                       mysql  rtd       DIR                8,1       4096          2 /
mysqld    1312                       mysql  txt       REG                8,1   20336792   23805048 /usr/sbin/mysqld
mysqld    1312                       mysql  mem       REG               8,21      24576         20 /var/lib/mysql/tc.log
mysqld    1312                       mysql  DEL       REG               0,16                 29467 /[aio]
mysqld    1312                       mysql  mem       REG                8,1      55792   14886933 /lib/x86_64-linux-gnu/libnss_files-2.28.so


# lsof | grep root
COMMAND    PID   TID TASKCMD          USER   FD      TYPE             DEVICE   SIZE/OFF       NODE NAME
systemd      1                        root  cwd       DIR                8,1       4096          2 /
systemd      1                        root  rtd       DIR                8,1       4096          2 /
systemd      1                        root  txt       REG                8,1    1489208   14928891 /lib/systemd/systemd
systemd      1                        root  mem       REG                8,1    1579448   14886924 /lib/x86_64-linux-gnu/libm-2.28.so

Other command that helped to track the discrepancy between df and du different file usage on FS is:
 

# du -hxa  / | egrep '^[[:digit:]]{1,1}G[[:space:]]*'


3. Fixing large files kept in memory filesystem problem


What is the real reason for ending up with this file handlers opened by running backgrounded programs on the Linux OS?
It could be multiple  but most likely it is due to exceeded server / client interactions or breaking up RAM or HDD drive with writing plenty of logs on the FS without ending keeping space occupied or Programming library bugs used by hanged service leaving the FH opened on storage.

What is the solution to file system files left in memory problem?

The best solution is to first fix custom script or hanged service and then if possible to simply restart the server to make the kernel / services reload or if this is not possible just restart the problem creation processes.

Once the process is identified like in my case this was MySQL on systemd enabled newer OS distros, just do:


# systemctl restart mysqld.service


or on older init.d system V ones:

# /etc/init.d/service restart


For custom hanged scripts being listed in ps axuwef you can grep the pid and do a kill -HUP (if the script is written in a good way to recognize -HUP and restart the sub-running process properly – BE EXTRA CAREFUL IF YOU'RE RESTARTING BROKEN SCRIPTS as this might cause your running service disruptions …).

# pgrep -l script.sh
7977 script.sh


# kill -HUP PID


Now finally this should either mitigate or at best case completely solve the reported disagreement between df and du, after which the calculated / reported disk space should be back to normal and show up approximately the same (note that size changes a bit as mysql service is writting data) constantly extending the size between the two checks.


# df -hk /var/lib/mysql; du -hskc /var/lib/mysql
Filesystem       Inodes  IUsed   IFree IUse% Mounted on
/dev/sdb5        19097172 3472744 14631296  20% /var/lib/mysql
3427772    /var/lib/mysql
3427772    total


What we learned?

What I've explained in this article is why and how it comes that 'zoombie' files reside on a filesystem
appearing to be eating disk space on a mounted local or network partition, giving strange inconsistent
reports, leading to system service disruptions and impossibility to have correctly shown information on used
disk space on mounted drive.

I went through with some standard logic on debugging service / filesystem / inode issues up explainat, that led me to the finding about deleted files being kept in filesystem and producing the filesystem strange sized / showing not correct / filled even after it was extended with tune2fs and was supposed to have extra 50GBs.

Finally it was explained shortly how to HUP / restart hanging script / service to fix it.

Some few good readings that helped to fix the issue:

What to do when du and df report different usage is here
df in linux not showing correct free space after file removal is here
Why do “df” and “du” commands show different disk usage?