Posts Tagged ‘checks’

Enable zabbix agent to work with SeLinux enabled on CentOS 7 Linux

Wednesday, October 19th, 2022

If you have the task to install and use zabbix-agent or zabbix-proxy to report to zabbix-server on CentOS 7 with enabled SeLinux services for security reasons and you have no mean to disable the selinux which is a common step to take under this circumstances, you will have to add the zabbix services to be exluded as permissive in selinux. In below article I'll show you how this is done in few easy steps.

zabbix-agent-service-selinux-linux-real-time-operating-sytems


1. Check the system sestatus

[root@linux zabbix]# sestatus
SELinux status:                 enabled
SELinuxfs mount:                /sys/fs/selinux
SELinux root directory:         /etc/selinux
Loaded policy name:             targeted
Current mode:                   enforcing
Mode from config file:          enforcing

Policy MLS status:              enabled
Policy deny_unknown status:     allowed
Max kernel policy version:      28


2. Enable zabbix to be permissive in selinux

To be able to set zabbix to be in permissive mode as well as for further troubleshooting if you have to enable other  linux services inside selinux you have to install below RPM packs.

[root@linux zabbix]# yum install setroubleshoot.x86_64 setools.x86_64 setools-console.x86_64 policycoreutils-python.x86_64

Set the zabbix permissive exclude rule in SeLINUX

[root@linux zabbix]# semanage permissive –add zabbix_t

Re-run the zabbix proxy (if you have a local zabbix-proxy running and the zabbix-agent)

[root@linux zabbix]# systemctl start zabbix-proxy.service

[root@linux zabbix]# systemctl start zabbix-agent.service

[root@linux zabbix]# systemctl status zabbix-agent
● zabbix-agent.service – Zabbix Agent
   Loaded: loaded (/usr/lib/systemd/system/zabbix-agent.service; enabled; vendor preset: disabled)
   Active: active (running) since Tue 2022-10-18 09:30:16 CEST; 1 day 7h ago
 Main PID: 962952 (zabbix_agentd)
    Tasks: 6 (limit: 100884)
   Memory: 5.1M
   CGroup: /system.slice/zabbix-agent.service
           ├─962952 /usr/sbin/zabbix_agentd -c /etc/zabbix/zabbix_agentd.conf
           ├─962955 /usr/sbin/zabbix_agentd: collector [idle 1 sec]
           ├─962956 /usr/sbin/zabbix_agentd: listener #1 [waiting for connection]
           ├─962957 /usr/sbin/zabbix_agentd: listener #2 [waiting for connection]
           ├─962958 /usr/sbin/zabbix_agentd: listener #3 [waiting for connection]
           └─962959 /usr/sbin/zabbix_agentd: active checks #1 [idle 1 sec]

Oct 18 09:30:16 linux systemd[1]: Starting Zabbix Agent…
Oct 18 09:30:16 linux systemd[1]: Started Zabbix Agent.

3. Check inside audit logs all is OK

To make sure zabbix is really enabled to be omitted by selinux rules check audit.log

[root@linux zabbix]# grep zabbix_proxy /var/log/audit/audit.log

That's all folks, Enjoy ! 🙂

How to set up dsmc client Tivoli ( TSM ) release version and process check monitoring with Zabbix

Thursday, December 17th, 2020

zabbix-monitor-dsmc-client-monitor-ibm-tsm-with-zabbix-howto

As a part of Monitoring IBM Spectrum (the new name of IBM TSM) if you don't have the money to buy something like HP Open View monitoring or other kind of paid monitoring system but you use Zabbix open source solution to monitor your Linux server infrastructure and you use Zabbix as a main Services and Servers monitoring platform you will want to monitor at least whether the running Tivoli dsmc backup clients run fine on each of the server (e.g. the dsmc client) runs normally as a backup solution with its common /usr/bin/dsmc process service that connects towards remote IBM TSM server where the actual Data storage is kept.

It might be a kind of weird monitoring to setup to have the tsm version frequently reported to a Zabbix server on a first glimpse, but in reality this is quite useful especially if you want to have a better overview of your multiple servers environment IBM (Spectrum Protect) Storage manager backup solution actual release.
 
So the goal is to have reported dsmc interactive storage manager version as reported from
 

[root@server ~]# dsmc

IBM Spectrum Protect
Command Line Backup-Archive Client Interface
  Client Version 8, Release 1, Level 11.0
  Client date/time: 12/17/2020 15:59:32
(c) Copyright by IBM Corporation and other(s) 1990, 2020. All Rights Reserved.

Node Name: Sub-Hostname.FQDN.COM
Session established with server TSM_SERVER: AIX
  Server Version 8, Release 1, Level 10.000
  Server date/time: 12/17/2020 15:59:34  Last access: 12/17/2020 13:28:01


into zabbix and set reports in case if your sysadmins have changed version of a IBM TSM to a newer version. Thus for non sysadmins and less technical persons as Service Delivery Managers (SDMs) it is much easier to track changes of multiple servers Tivoli version to a newer one.

Enough talk let me next show you how to setup the required with a small UserParameter one liner bash shell script.
 

1. Create TSM Userparameter script


With Userparameter key and content as below:

[root@server ~]# vim /etc/zabbix/zabbix_agentd.d/userparameter_TSM.conf


UserParameter=dsmc.version,cat /var/tsm/sched.log | grep Clie | tail -n 1 | awk '{print $7 " " $8 " " $9 " " $10 " " $11 " " $12 " " $13}'


The script output of TivSM version will be reported as so:

[root@server ~]# cat /var/tsm/sched.log | grep Clie | tail -n 1 | awk '{print $7 " " $8 " " $9 " " $10 " " $11 " " $12 " " $13}'
Client Version 8, Release 1, Level 11.0


If you want to get only a major version report from dsmc:

UserParameter=dsmc.version,cat /var/tsm/sched.log | grep Clie | tail -n 1 | awk '{print $7 " " $8 " " $9}'


The output as a major version you will get is

[root@server ~]# cat /var/tsm/sched.log | grep Clie | tail -n 1 | awk '{print $7 " " $8 " " $9}'
Client Version 8,


2. Restart the zabbix agent to load userparam script

To load above configured Userparameter script we need to restart zabbix-agent client

[root@server ~]# systemctl restart zabbix-agent

[root@server ~]#  systemctl status zabbix-agent
● zabbix-agent.service – Zabbix Agent
   Loaded: loaded (/usr/lib/systemd/system/zabbix-agent.service; enabled; vendor preset: disabled)
   Active: active (running) since Wed 2020-07-22 16:17:17 CEST; 4 months 26 days ago
 Main PID: 7817 (zabbix_agentd)
   CGroup: /system.slice/zabbix-agent.service
           ├─7817 /usr/sbin/zabbix_agentd -c /etc/zabbix/zabbix_agentd.conf
           ├─7818 /usr/sbin/zabbix_agentd: collector [idle 1 sec]
           ├─7819 /usr/sbin/zabbix_agentd: listener #1 [waiting for connection]
           ├─7820 /usr/sbin/zabbix_agentd: listener #2 [waiting for connection]
           ├─7821 /usr/sbin/zabbix_agentd: listener #3 [waiting for connection]
           └─7822 /usr/sbin/zabbix_agentd: active checks #1 [idle 1 sec]


3. Create template for TSM Service check and TSM Version


You will need to create 1 Trigger and 2 Items for the Service check and for TSM version reporting

tsm-service-version-screenshot-zabbix
As you see necessery names / keys to create are:

Name / Key: TSM – Service State proc.num{dsmcad}

Name / key: TSM version dmsc.version


3.1 Create the trigger


Now lets create the trigger that will report the Service State

tsm-service-state-zabbix-screenshot


Linux TSM:proc.num[dsmcad].last()}=0


3.2 Create the Items


zabbix-dsmc-proc-num-item-setting-screenshot-linux


Name: dsmcad
Key: proc.num{dsmcad}


tsm-version-item-zabbix-screenshot
 

Update interval: 1d
History Storage period: 90d
Applications: TSM


3.3 Create Zabbix Action

As usual if you want to receive some Email Alerting or lets say send SMS in case of Trigger is matched create the necessery Action with
instructions on how to solve the problem if there is a Standard Operation Procedure ( SOP ) as often called in the corporate world for that.

That's all folks ! 🙂


Fix Out of inodes on Postfix Linux Mail Cluster. How to clean up filesystem running out of Inodes, Filesystem inodes on partition is 100% full

Wednesday, August 25th, 2021

Inode_Entry_inode-table-content

Recently we have faced a strange issue with with one of our Clustered Postfix Mail servers (the cluster is with 2 nodes that each has configured Postfix daemon mail servers (running on an OpenVZ virtualized environment).
A heartbeat that checks liveability of clusters and switches nodes in case of one of the two gets broken due to some reason), pretty much a standard SMTP cluster.

So far so good but since the cluster is a kind of abondoned and is pretty much legacy nowadays and used just for some Monitoring emails from different scripts and systems on servers, it was not really checked thoroughfully for years and logically out of sudden the alarming email content sent via the cluster stopped working.

The normal sysadmin job here  was to analyze what is going on with the cluster and fix it ASAP. After some very basic analyzing we catched the problem is caused by a  "inodes full" (100% of available inodes were occupied) problem, e.g. file system run out of inodes on both machines perhaps due to a pengine heartbeat process  bug  leading to producing a high number of .bz2 pengine recovery archive files stored in /var/lib/pengine>

Below are the few steps taken to analyze and fix the problem.
 

1. Finding out about the the system run out of inodes problem


After logging on to system and not finding something immediately is wrong with inodes, all I can see from crm_mon is cluster was broken.
A plenty of emails were left inside the postfix mail queue visible with a standard command

[root@smtp1: ~ ]# postqueue -p

It took me a while to find ot the problem is with inodes because a simple df -h  was showing systems have enough space but still cluster quorum was not complete.
A bit of further investigation led me to a  simple df -i reporting the number of inodes on the local filesystems on both our SMTP1 and SMTP2 got all occupied.

[root@smtp1: ~ ]# df -i
Filesystem            Inodes   IUsed   IFree IUse% Mounted on
/dev/simfs            500000   500000  0   100% /
none                   65536      61   65475    1% /dev

As you can see the number of inodes on the Virual Machine are unfortunately depleted

Next step was to check directories occupying most inodes, as this is the place from where files could be temporary moved to a remote server filesystem or moved to another partition with space on a server locally attached drives.
Below command gives an ordered list with directories locally under the mail root filesystem / and its respective occupied number files / inodes,
the more files under a directory the more inodes are being occupied by the files on the filesystem.


run-out-if-inodes-what-is-inode-find-out-which-filesystem-or-directory-eating-up-all-your-system-inodes-linux_inode_diagram.gif
1.1 Getting which directory consumes most of the inodes on the systems


[root@smtp1: ~ ]# { find / -xdev -printf '%h\n' | sort | uniq -c | sort -k 1 -n; } 2>/dev/null
….
…..

…….
    586 /usr/lib64/python2.4
    664 /usr/lib64
    671 /usr/share/man/man8
    860 /usr/bin
   1006 /usr/share/man/man1
   1124 /usr/share/man/man3p
   1246 /var/lib/Pegasus/prev_repository_2009-03-10-1236698426.308128000.rpmsave/root#cimv2/classes
   1246 /var/lib/Pegasus/prev_repository_2009-05-18-1242636104.524113000.rpmsave/root#cimv2/classes
   1246 /var/lib/Pegasus/prev_repository_2009-11-06-1257494054.380244000.rpmsave/root#cimv2/classes
   1246 /var/lib/Pegasus/prev_repository_2010-08-04-1280907760.750543000.rpmsave/root#cimv2/classes
   1381 /var/lib/Pegasus/prev_repository_2010-11-15-1289811714.398469000.rpmsave/root#cimv2/classes
   1381 /var/lib/Pegasus/prev_repository_2012-03-19-1332151633.572875000.rpmsave/root#cimv2/classes
   1398 /var/lib/Pegasus/repository/root#cimv2/classes
   1696 /usr/share/man/man3
   400816 /var/lib/pengine

Note, the above command orders the files from bottom to top order and obviosuly the bottleneck directory that is over-eating Filesystem inodes with an exceeding amount of files is
/var/lib/pengine
 

2. Backup old multitude of files just in case of something goes wrong with the cluster after some files are wiped out


The next logical step of course is to check what is going on inside /var/lib/pengine just to find a very ,very large amount of pe-input-*NUMBER*.bz2 files were suddenly produced.


[root@smtp1: ~ ]# ls -1 pe-input*.bz2 | wc -l
 400816


The files are produced by the pengine process which is one of the processes that is controlling the heartbeat cluster state, presumably it is done by running process:

[root@smtp1: ~ ]# ps -ef|grep -i pengine
24        5649  5521  0 Aug10 ?        00:00:26 /usr/lib64/heartbeat/pengine


Hence in order to fix the issue, to prevent some inconsistencies in the cluster due to the file deletion,  copied the whole directory to another mounted parition (you can mount it remotely with sshfs for example) or use a local one if you have one:

[root@smtp1: ~ ]# cp -rpf /var/lib/pengine /mnt/attached_storage


and proceeded to clean up some old multitde of files that are older than 2 years of times (720 days):


3. Clean  up /var/lib/pengine files that are older than two years with short loop and find command


First I made a list with all the files to be removed in external text file and quickly reviewed it by lessing it like so

[root@smtp1: ~ ]#  cd /var/lib/pengine
[root@smtp1: ~ ]# find . -type f -mtime +720|grep -v pe-error.last | grep -v pe-input.last |grep -v pe-warn.last -fprint /home/myuser/pengine_older_than_720days.txt
[root@smtp1: ~ ]# less /home/myuser/pengine_older_than_720days.txt


Once reviewing commands I've used below command to delete the files you can run below command do delete all older than 2 years that are different from pe-error.last / pe-input.last / pre-warn.last which might be needed for proper cluster operation.

[root@smtp1: ~ ]#  for i in $(find . -type f -mtime +720 -exec echo '{}' \;|grep -v pe-error.last | grep -v pe-input.last |grep -v pe-warn.last); do echo $i; done


Another approach to the situation is to simply review all the files inside /var/lib/pengine and delete files based on year of creation, for example to delete all files in /var/lib/pengine from 2010, you can run something like:
 

[root@smtp1: ~ ]# for i in $(ls -al|grep -i ' 2010 ' | awk '{ print $9 }' |grep -v 'pe-warn.last'); do rm -f $i; done


4. Monitor real time inodes freeing

While doing the clerance of old unnecessery pengine heartbeat archives you can open another ssh console to the server and view how the inodes gets freed up with a command like:


# check if inodes is not being rapidly decreased

[root@csmtp1: ~ ]# watch 'df -i'


5. Restart basic Linux services producing pid files and logs etc. to make then workable (some services might not be notified the inodes on the Hard drive are freed up)

Because the hard drive on the system was full some services started to misbehaving and /var/log logging was impacted so I had to also restart them in our case this is the heartbeat itself
that  checks clusters nodes availability as well as the logging daemon service rsyslog


# restart rsyslog and heartbeat services
[root@csmtp1: ~ ]# /etc/init.d/heartbeat restart
[root@csmtp1: ~ ]# /etc/init.d/rsyslog restart

The systems had been a data integrity legacy service samhain so I had to restart this service as well to reforce the /var/log/samhain log file to again continusly start writting data to HDD.

# Restart samhain service init script 
[root@csmtp1: ~ ]# /etc/init.d/samhain restart


6. Check up enough inodes are freed up with df

[root@smtp1 log]# df -i
Filesystem Inodes IUsed IFree IUse% Mounted on
/dev/simfs 500000 410531 19469 91% /
none 65536 61 65475 1% /dev


I had to repeat the same process on the second Postfix cluster node smtp2, and after all the steps like below check the status of smtp2 node and the postfix queue, following same procedure made the second smtp2 cluster member as expected 🙂


7. Check the cluster node quorum is complete, e.g. postfix cluster is operating normally


# Test if email cluster is ok with pacemaker resource cluster manager – lt-crm_mon
 

[root@csmtp1: ~ ]# crm_mon -1
============
Last updated: Tue Aug 10 18:10:48 2021
Stack: Heartbeat
Current DC: smtp2.fqdn.com (bfb3d029-89a8-41f6-a9f0-52d377cacd83) – partition with quorum
Version: 1.0.12-unknown
2 Nodes configured, unknown expected votes
4 Resources configured.
============

Online: [ smtp2.fqdn.com smtp1.fqdn.com ]

failover-ip (ocf::heartbeat:IPaddr2): Started csmtp1.ikossvan.de
Clone Set: postfix_clone
Started: [ smtp2.fqdn.com smtp1fqdn.com ]
Clone Set: pingd_clone
Started: [ smtp2.fqdn.com smtp1.fqdn.com ]
Clone Set: mailto_clone
Started: [ smtp2.fqdn.com smtp1.fqdn.com ]


8.  Force resend a few hundred thousands of emails left in the email queue


After some inodes gets freed up due to the file deletion, i've reforced a couple of times the queued mail servers to be immediately resent to remote mail destinations with cmd:


# force emails in queue to be resend with postfix

[root@smtp1: ~ ]# sendmail -q


– It was useful to watch in real time how the queued emails are quickly decreased (queued mails are successfully sent to destination addresses) with:


# Monitor  the decereasing size of the email queue
[root@smtp1: ~ ]# watch 'postqueue -p|grep -i '@'|wc -l'

Add Zabbix time synchronization ntp userparameter check script to Monitor Linux servers

Tuesday, December 8th, 2020

Zabbix-logo-how-to-make-ntpd-time-server-monitoring-article


How to add Zabbix time synchronization ntp userparameter check script to Monitor Linux servers?

We needed to set on some servers at my work an elementary check with Zabbix monitoring to check whether servers time is correctly synchronized with ntpd time service as well report if the ntp daemon is correctly running on the machine. For that a userparameter script was developed called userparameter_ntp.conf the script is simplistic and few a lines of bash shell scripting 
stuff is based on gresping information required from ntpq and ntpstat common ntp client commands to get information about the status of time synchronization on the servers.
 

[root@linuxserver ]# ntpstat
synchronised to NTP server (10.80.200.30) at stratum 3
   time correct to within 47 ms
   polling server every 1024 s


[root@linuxserver ]# ntpq -c peers
     remote           refid      st t when poll reach   delay   offset  jitter
==============================================================================
+timeserver1 10.26.239.41     2 u  319 1024  377   15.864    1.270   0.262
+timeserver2 10.82.239.41     2 u  591 1024  377   16.287   -0.334   1.748
*timeserver3 10.82.239.43     2 u   47 1024  377   15.613   -0.553   0.251
 timeserver4 .INIT.          16 u    – 1024    0    0.000    0.000   0.000


Below is Zabbix UserParameter script that does report us 3 important values we monitor to make sure time server synchronization works as expected the zabbix keys we set are ntp.offset, ntp.sync, ntp.exact in attempt to describe what we're fetching from ntp client:

[root@linuxserver ]# cat /etc/zabbix/zabbix-agent.d/userparameter_ntp.conf

UserParameter=ntp.offset,(/usr/sbin/ntpq -pn | /usr/bin/awk 'BEGIN { offset=1000 } $1 ~ /\*/ { offset=$9 } END { print offset }')
#UserParameter=ntp.offset,(/usr/sbin/ntpq -pn | /usr/bin/awk 'FNR==4{print $9}')
UserParameter=ntp.sync,(/usr/bin/ntpstat | cut -f 1 -d " " | tr -d ' \t\n\r\f')
UserParameter=ntp.exact,(/usr/bin/ntpstat | /usr/bin/awk 'FNR==2{print $5,$6}')

In Zabbix the monitored ntpd parameters set-upped looks like this:


ntp_time_synchronization_check-zabbix-screenshot.


!Note that in above userparameter example, the commented userparameter script is a just another way to do an ntpd offset returned value which was developed before the more sophisticated with more regular expression checks from the /usr/sbin/ntpd via ntpq, perhaps if you want to extend it you can also use another script to report more verbose information to Zabbix if that is required like ouput from ntpq -c peers command:
 

UserParameter=ntp.verbose,(/usr/sbin/ntpq -c peers)

Of course to make the Zabbix fetch necessery data from monitored hosts, we need to set-up further new Zabbix Template with the respective Trigger and Items.

Below are few screenshots including the triggers used.

ntpd_server-time_synchronization_check-zabbix-screenshot-triggers

  • ntpd.trigger

{NTP:net.udp.service[ntp].last(0)}<1

  • NTP Synchronization trigger

{NTP:ntp.sync.iregexp(unsynchronised)}=1


As you can see from history we have setup our items to Store history of reported data to Zabbix from parameter script for 90 days and update our monitor check, every 30 seconds from the monitored hosts to which Tempate is applied.

Well that's all folks, time synchronization issues we'll be promptly triggering a new Alarm in Zabbix !

Find when cron.daily cron.weekly and cron.monthly run on Redhat / CentOS / Debian Linux and systemd-timers

Wednesday, March 25th, 2020

Find-when-cron.daily-cron.monthly-cron.weekly-run-on-Redhat-CentOS-Debian-SuSE-SLES-Linux-cron-logo


The problem – Apache restart at random times


I've noticed today something that is occuring for quite some time but was out of my scope for quite long as I'm not directly involved in our Alert monitoring at my daily job as sys admin. Interestingly an Apache HTTPD webserver is triggering alarm twice a day for a short downtime that lasts for 9 seconds.

I've decided to investigate what is triggering WebServer restart in such random time and investigated on the system for any background running scripts as well as reviewed the system logs. As I couldn't find nothing there the only logical place to check was cron jobs.
The usual
 

crontab -u root -l


Had no configured cron jobbed scripts so I digged further to check whether there isn't cron jobs records for a script that is triggering the reload of Apache in /etc/crontab /var/spool/cron/root and /var/spool/cron/httpd.
Nothing was found there and hence as there was no anacron service running but /usr/sbin/crond the other expected place to look up for a trigger even was /etc/cron*


1. Configured default cron execution times, every day, every hour every month


# ls -ld /etc/cron.*
drwxr-xr-x 2 root root 4096 feb 27 10:54 /etc/cron.d/
drwxr-xr-x 2 root root 4096 dec 27 10:55 /etc/cron.daily/
drwxr-xr-x 2 root root 4096 dec  7 23:04 /etc/cron.hourly/
drwxr-xr-x 2 root root 4096 dec  7 23:04 /etc/cron.monthly/
drwxr-xr-x 2 root root 4096 dec  7 23:04 /etc/cron.weekly/


After a look up to each of above directories, finally I found the very expected logrorate shell script set to execute from /etc/cron.daily/logrotate and inside it I've found after the log files were set to be gzipped and moved to execute WebServer restart with:

systemctl reload httpd 


My first reaction was to ponder seriously why the script is invoking systemctl reload httpd instead of the good oldschool

apachectl -k graceful


But it seems on Redhat and CentOS since RHEL / CentOS version 6.X onwards systemctl reload httpd is supposed to be identical and a substitute for apachectl -k graceful.
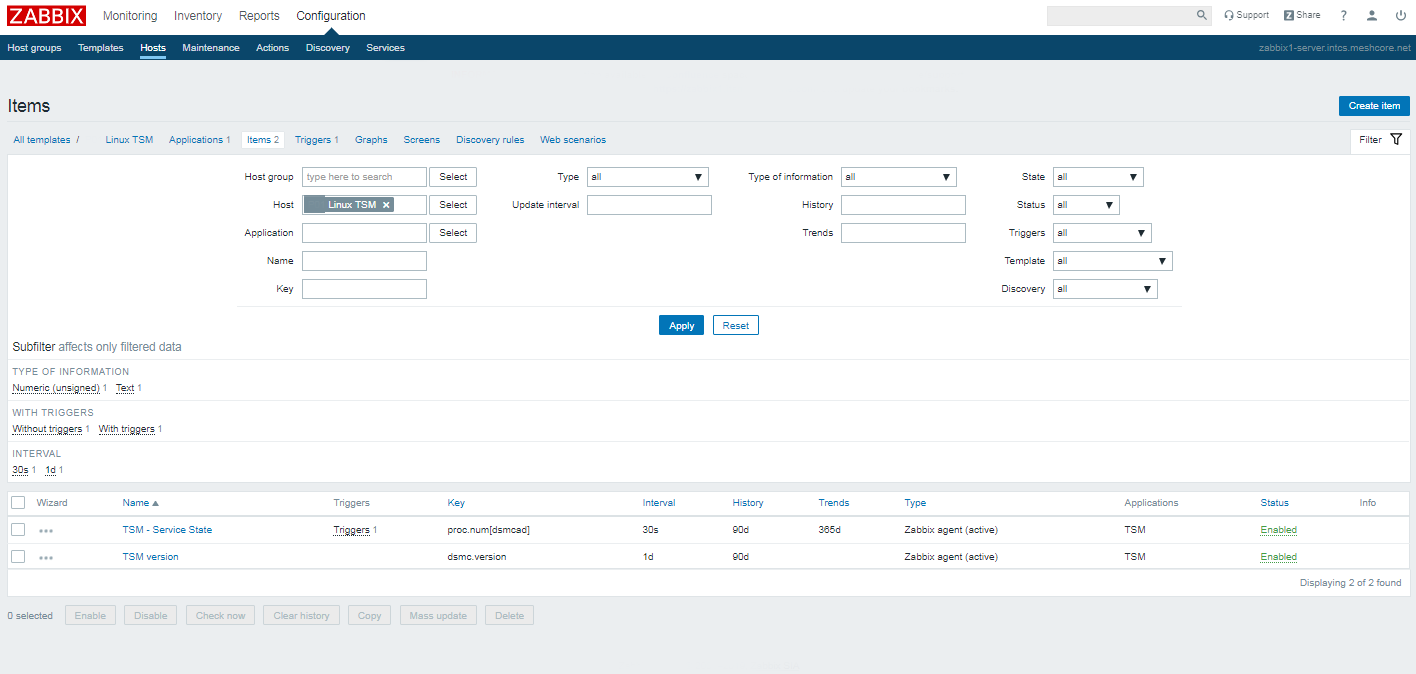
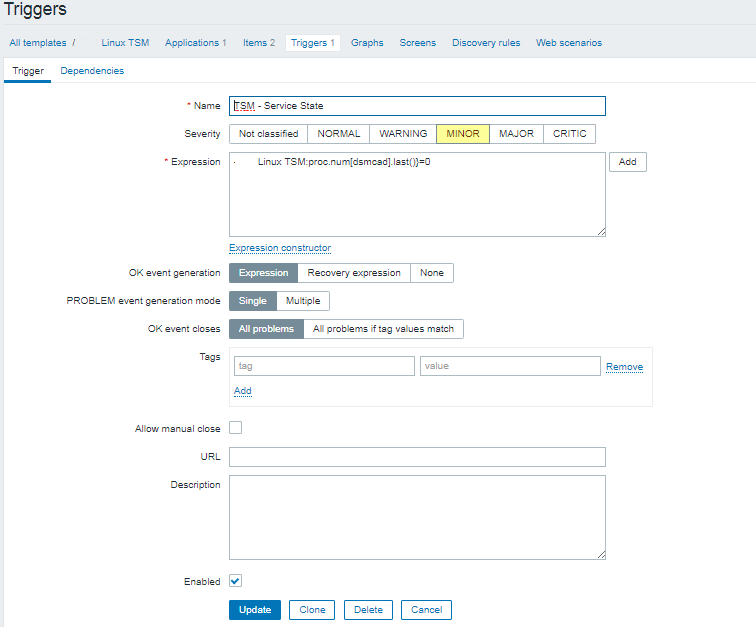
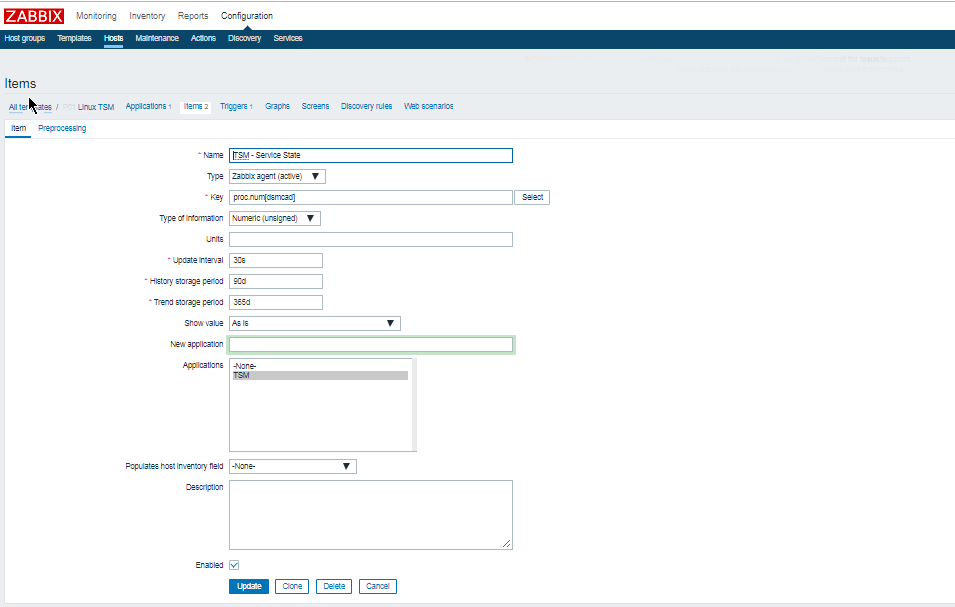
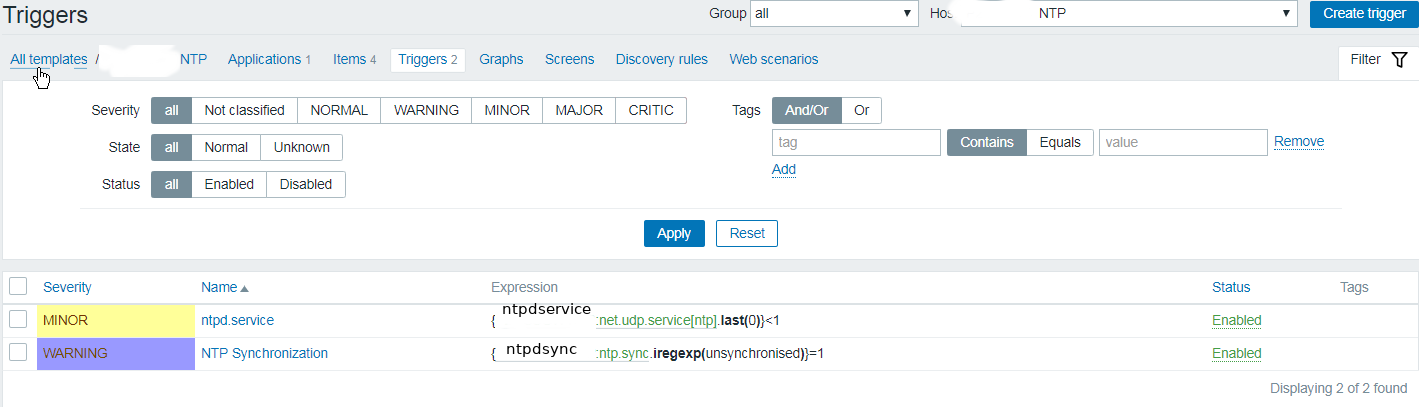
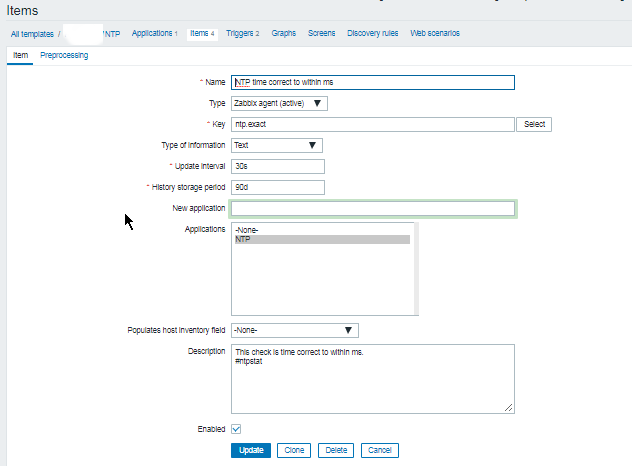
Okay the craziness of innovation continued as obviously the reload was causing a Downtime to be visible in the Zabbix HTTPD port Monitoring graph …
Now as the problem was identified the other logical question poped up how to find out what is the exact timing scheduled to run the script in that unusual random times each time ??
 

2. Find out cron scripts timing Redhat / CentOS / Fedora / SLES


/etc/cron.{daily,monthly,weekly} placed scripts's execution method has changed over the years, causing a chaos just like many Linux standard things we know due to the inclusion of systemd and some other additional weird OS design changes. The result is the result explained above scripts are running at a strange unexpeted times … one thing that was intruduced was anacron – which is also executing commands periodically with a different preset frequency. However it is considered more thrustworhty by crond daemon, because anacron does not assume the machine is continuosly running and if the machine is down due to a shutdown or a failure (if it is a Virtual Machine) or simply a crond dies out, some cronjob necessery for overall set environment or application might not run, what anacron guarantees is even though that and even if crond is in unworking defunct state, the preset scheduled scripts will still be served.
anacron's default file location is in /etc/anacrontab.

A standard /etc/anacrontab looks like so:
 

[root@centos ~]:# cat /etc/anacrontab
# /etc/anacrontab: configuration file for anacron
 
# See anacron(8) and anacrontab(5) for details.
 
SHELL=/bin/sh
PATH=/sbin:/bin:/usr/sbin:/usr/bin
MAILTO=root
# the maximal random delay added to the base delay of the jobs
RANDOM_DELAY=45
# the jobs will be started during the following hours only
START_HOURS_RANGE=3-22
 
#period in days   delay in minutes   job-identifier   command
1    5    cron.daily        nice run-parts /etc/cron.daily
7    25    cron.weekly        nice run-parts /etc/cron.weekly
@monthly 45    cron.monthly        nice run-parts /etc/cron.monthly


START_HOURS_RANGE : The START_HOURS_RANGE variable sets the time frame, when the job could started. 
The jobs will start during the 3-22 (3AM-10PM) hours only.

  • cron.daily will run at 3:05 (After Midnight) A.M. i.e. run once a day at 3:05AM.
  • cron.weekly will run at 3:25 AM i.e. run once a week at 3:25AM.
  • cron.monthly will run at 3:45 AM i.e. run once a month at 3:45AM.

If the RANDOM_DELAY env var. is set, a random value between 0 and RANDOM_DELAY minutes will be added to the start up delay of anacron served jobs. 
For instance RANDOM_DELAY equels 45 would therefore add, randomly, between 0 and 45 minutes to the user defined delay. 

Delay will be 5 minutes + RANDOM_DELAY for cron.daily for above cron.daily, cron.weekly, cron.monthly config records, i.e. 05:01 + 0-45 minutes

A full detailed explanation on automating system tasks on Redhat Enterprise Linux is worthy reading here.

!!! Note !!! that listed jobs will be running in queue. After one finish, then next will start.
 

3. SuSE Enterprise Linux cron jobs not running at desired times why?


in SuSE it is much more complicated to have a right timing for standard default cron jobs that comes preinstalled with a service 

In older SLES release /etc/crontab looked like so:


SHELL=/bin/bash
PATH=/sbin:/bin:/usr/sbin:/usr/bin
MAILTO=root
HOME=/

# run-parts
01 * * * * root run-parts /etc/cron.hourly
02 4 * * * root run-parts /etc/cron.daily
22 4 * * 0 root run-parts /etc/cron.weekly
42 4 1 * * root run-parts /etc/cron.monthly


As time of writting article it looks like:


SHELL=/bin/sh
PATH=/usr/bin:/usr/sbin:/sbin:/bin:/usr/lib/news/bin
MAILTO=root
#
# check scripts in cron.hourly, cron.daily, cron.weekly, and cron.monthly
#
-*/15 * * * *   root  test -x /usr/lib/cron/run-crons && /usr/lib/cron/run-crons >/dev/null 2>&1


This runs any scripts placed in /etc/cron.{hourly, daily, weekly, monthly} but it may not run them when you expect them to run. 
/usr/lib/cron/run-crons compares the current time to the /var/spool/cron/lastrun/cron.{time} file to determine if those jobs need to be run.

For hourly, it checks if the current time is greater than (or exactly) 60 minutes past the timestamp of the /var/spool/cron/lastrun/cron.hourly file.

For weekly, it checks if the current time is greater than (or exactly) 10080 minutes past the timestamp of the /var/spool/cron/lastrun/cron.weekly file.

Monthly uses a caclucation to check the time difference, but is the same type of check to see if it has been one month after the last run.

Daily has a couple variations available – By default it checks if it is more than or exactly 1440 minutes since lastrun.
If DAILY_TIME is set in the /etc/sysconfig/cron file (again a suse specific innovation), then that is the time (within 15minutes) when daily will run.

For systems that are powered off at DAILY_TIME, daily tasks will run at the DAILY_TIME, unless it has been more than x days, if it is, they run at the next running of run-crons. (default 7days, can set shorter time in /etc/sysconfig/cron.)
Because of these changes, the first time you place a job in one of the /etc/cron.{time} directories, it will run the next time run-crons runs, which is at every 15mins (xx:00, xx:15, xx:30, xx:45) and that time will be the lastrun, and become the normal schedule for future runs. Note that there is the potential that your schedules will begin drift by 15minute increments.

As you see this is very complicated stuff and since God is in the simplicity it is much better to just not use /etc/cron.* for whatever scripts and manually schedule each of the system cron jobs and custom scripts with cron at specific times.


4. Debian Linux time start schedule for cron.daily / cron.monthly / cron.weekly timing

As the last many years many of the servers I've managed were running Debian GNU / Linux, my first place to check was /etc/crontab which is the standard cronjobs file that is setting the { daily , monthly , weekly crons } 


 debian:~# ls -ld /etc/cron.*
drwxr-xr-x 2 root root 4096 фев 27 10:54 /etc/cron.d/
drwxr-xr-x 2 root root 4096 фев 27 10:55 /etc/cron.daily/
drwxr-xr-x 2 root root 4096 дек  7 23:04 /etc/cron.hourly/
drwxr-xr-x 2 root root 4096 дек  7 23:04 /etc/cron.monthly/
drwxr-xr-x 2 root root 4096 дек  7 23:04 /etc/cron.weekly/


debian:~# cat /etc/crontab 
# /etc/crontab: system-wide crontab
# Unlike any other crontab you don't have to run the `crontab'
# command to install the new version when you edit this file
# and files in /etc/cron.d. These files also have username fields,
# that none of the other crontabs do.

SHELL=/bin/sh
PATH=/usr/local/sbin:/usr/local/bin:/sbin:/bin:/usr/sbin:/usr/bin# Example of job definition:
# .—————- minute (0 – 59)
# |  .————- hour (0 – 23)
# |  |  .———- day of month (1 – 31)
# |  |  |  .——- month (1 – 12) OR jan,feb,mar,apr …
# |  |  |  |  .—- day of week (0 – 6) (Sunday=0 or 7) OR sun,mon,tue,wed,thu,fri,sat
# |  |  |  |  |
# *  *  *  *  * user-name command to be executed
17 *    * * *    root    cd / && run-parts –report /etc/cron.hourly
25 6    * * *    root    test -x /usr/sbin/anacron || ( cd / && run-parts –report /etc/cron.daily )
47 6    * * 7    root    test -x /usr/sbin/anacron || ( cd / && run-parts –report /etc/cron.weekly )
52 6    1 * *    root    test -x /usr/sbin/anacron || ( cd / && run-parts –report /etc/cron.monthly )

What above does is:

– Run cron.hourly once at every hour at 1:17 am
– Run cron.daily once at every day at 6:25 am.
– Run cron.weekly once at every day at 6:47 am.
– Run cron.monthly once at every day at 6:42 am.

As you can see if anacron is present on the system it is run via it otherwise it is run via run-parts binary command which is reading and executing one by one all scripts insude /etc/cron.hourly, /etc/cron.weekly , /etc/cron.mothly

anacron – few more words

Anacron is the canonical way to run at least the jobs from /etc/cron.{daily,weekly,monthly) after startup, even when their execution was missed because the system was not running at the given time. Anacron does not handle any cron jobs from /etc/cron.d, so any package that wants its /etc/cron.d cronjob being executed by anacron needs to take special measures.

If anacron is installed, regular processing of the /etc/cron.d{daily,weekly,monthly} is omitted by code in /etc/crontab but handled by anacron via /etc/anacrontab. Anacron's execution of these job lists has changed multiple times in the past:

debian:~# cat /etc/anacrontab 
# /etc/anacrontab: configuration file for anacron

# See anacron(8) and anacrontab(5) for details.

SHELL=/bin/sh
PATH=/usr/local/sbin:/usr/local/bin:/sbin:/bin:/usr/sbin:/usr/bin
HOME=/root
LOGNAME=root

# These replace cron's entries
1    5    cron.daily    run-parts –report /etc/cron.daily
7    10    cron.weekly    run-parts –report /etc/cron.weekly
@monthly    15    cron.monthly    run-parts –report /etc/cron.monthly

In wheezy and earlier, anacron is executed via init script on startup and via /etc/cron.d at 07:30. This causes the jobs to be run in order, if scheduled, beginning at 07:35. If the system is rebooted between midnight and 07:35, the jobs run after five minutes of uptime.
In stretch, anacron is executed via a systemd timer every hour, including the night hours. This causes the jobs to be run in order, if scheduled, beween midnight and 01:00, which is a significant change to the previous behavior.
In buster, anacron is executed via a systemd timer every hour with the exception of midnight to 07:00 where anacron is not invoked. This brings back a bit of the old timing, with the jobs to be run in order, if scheduled, beween 07:00 and 08:00. Since anacron is also invoked once at system startup, a reboot between midnight and 08:00 also causes the jobs to be scheduled after five minutes of uptime.
anacron also didn't have an upstream release in nearly two decades and is also currently orphaned in Debian.

As of 2019-07 (right after buster's release) it is planned to have cron and anacron replaced by cronie.

cronie – Cronie was forked by Red Hat from ISC Cron 4.1 in 2007, is the default cron implementation in Fedora and Red Hat Enterprise Linux at least since Version 6. cronie seems to have an acive upstream, but is currently missing some of the things that Debian has added to vixie cron over the years. With the finishing of cron's conversion to quilt (3.0), effort can begin to add the Debian extensions to Vixie cron to cronie.

Because cronie doesn't have all the Debian extensions yet, it is not yet suitable as a cron replacement, so it is not in Debian.
 

5. systemd-timers – The new crazy systemd stuff for script system job scheduling


Timers are systemd unit files with a suffix of .timer. systemd-timers was introduced with systemd so older Linux OS-es does not have it.
 Timers are like other unit configuration files and are loaded from the same paths but include a [Timer] section which defines when and how the timer activates. Timers are defined as one of two types:


  • Realtime timers (a.k.a. wallclock timers) activate on a calendar event, the same way that cronjobs do. The option OnCalendar= is used to define them.
  • Monotonic timers activate after a time span relative to a varying starting point. They stop if the computer is temporarily suspended or shut down. There are number of different monotonic timers but all have the form: OnTypeSec=. Common monotonic timers include OnBootSec and OnActiveSec.


    For each .timer file, a matching .service file exists (e.g. foo.timer and foo.service). The .timer file activates and controls the .service file. The .service does not require an [Install] section as it is the timer units that are enabled. If necessary, it is possible to control a differently-named unit using the Unit= option in the timer’s [Timer] section.

    systemd-timers is a complex stuff and I'll not get into much details but the idea was to give awareness of its existence for more info check its manual man systemd.timer

Its most basic use is to list all configured systemd.timers, below is from my home Debian laptop
 

debian:~# systemctl list-timers –all
NEXT                         LEFT         LAST                         PASSED       UNIT                         ACTIVATES
Tue 2020-03-24 23:33:58 EET  18s left     Tue 2020-03-24 23:31:28 EET  2min 11s ago laptop-mode.timer            lmt-poll.service
Tue 2020-03-24 23:39:00 EET  5min left    Tue 2020-03-24 23:09:01 EET  24min ago    phpsessionclean.timer        phpsessionclean.service
Wed 2020-03-25 00:00:00 EET  26min left   Tue 2020-03-24 00:00:01 EET  23h ago      logrotate.timer              logrotate.service
Wed 2020-03-25 00:00:00 EET  26min left   Tue 2020-03-24 00:00:01 EET  23h ago      man-db.timer                 man-db.service
Wed 2020-03-25 02:38:42 EET  3h 5min left Tue 2020-03-24 13:02:01 EET  10h ago      apt-daily.timer              apt-daily.service
Wed 2020-03-25 06:13:02 EET  6h left      Tue 2020-03-24 08:48:20 EET  14h ago      apt-daily-upgrade.timer      apt-daily-upgrade.service
Wed 2020-03-25 07:31:57 EET  7h left      Tue 2020-03-24 23:30:28 EET  3min 11s ago anacron.timer                anacron.service
Wed 2020-03-25 17:56:01 EET  18h left     Tue 2020-03-24 17:56:01 EET  5h 37min ago systemd-tmpfiles-clean.timer systemd-tmpfiles-clean.service


8 timers listed.


N ! B! If a timer gets out of sync, it may help to delete its stamp-* file in /var/lib/systemd/timers (or ~/.local/share/systemd/ in case of user timers). These are zero length files which mark the last time each timer was run. If deleted, they will be reconstructed on the next start of their timer.

Summary

In this article, I've shortly explain logic behind debugging weird restart events etc. of Linux configured services such as Apache due to configured scripts set to run with a predefined scheduled job timing. I shortly explained on how to figure out why the preset default install configured cron jobs such as logrorate – the service that is doing system logs archiving and nulling run at a certain time. I shortly explained the mechanism behind cron.{daily, monthy, weekly} and its execution via anacron – runner program similar to crond that never misses to run a scheduled job even if a system downtime occurs due to a crashed Docker container etc. run-parts command's use was shortly explained. A short look at systemd.timers was made which is now essential part of almost every new Linux release and often used by system scripts for scheduling time based maintainance tasks.

A tiny minimalistic CHAT Client Program writen in C

Sunday, July 29th, 2012

A friend of mine (Dido) who is learning C programming, has written a tiny chat server / client (peer to peer) program in C. His program is a very good learning curve for anyone desiring to learn basic C socket programming.
The program is writen in a way so it can be easily modified to work over UDP protocol with code:

struct sockaddr_in a;
a_sin_family=AF_INET;
a_sin_socktype=SOCK_DGRAM;

Here are links to the code of the Chat server/client progs:

Tiny C Chat Server Client source code

Tiny C Chat Client source code

To Use the client/server compile on the server host tiny-chat-serer-client.c with:

$ cc -o tiny-chat-server tiny-chat-server.c

Then on the client host compile the client;

$ cc -o tiny-chat-client tiny-chat-client.c

On the server host tiny-chat-server should be ran with port as argument, e.g. ;

$ ./tiny-chat-server 8888

To chat with the person running tiny-chat-server the compiled server should be invoked with:

$ ./tiny-chat-client 123.123.123.123 8888

123.123.123.123 is the IP address of the host, where tiny-chat-server is executed.
The chat/server C programs are actually a primitive very raw version of talk.

The programs are in a very basic stage, there are no condition checks for incorrectly passed arguments and with wrongly passed arguments it segfaults. Still for C beginners its useful …

How to disable spammer domain in QMAIL mail server with badmailto variable

Thursday, July 12th, 2012

I've recently noticed one of the qmail SMTP servers I adminster had plenty of logged spammer emails originating from yahoo.com.tw destined to reache some random looking like emails (probably unexisting) again to *@yahoo.com.tw

The spam that is tried by the spammer is probably a bounce spam, since it seems there is no web-form or anything wrong with the qmail server that might be causing the spam troubles.
As a result some of the emails from the well configured qmail (holding SPF checks), having a correct existing MX, PTR record and even having configured Domain Keys (DKIM) started being marked, whether emails are sent to *@yahoo.com legit emails.

To deal with the shits, since we don't have any Taiwanese (tw) clients, I dediced to completely prohibit any emails destined to be sent via the mail server to *@yahoo.com.tw. This is done via /var/qmail/control/badmailto qmail control variable;

Here is content of /var/qmail/control/badmailto after banning outgoing emails to yahoo.com.tw;;;

qmail:~# cat /var/qmail/control/badmailto
[!%#:\*\^]
[\(\)]
[\{\}]
@.*@
*@yahoo.com.tw

The first 4 lines are default rules, which are solving a lot of badmailto common sent emails. Thanks God after a qmail restart:

qmail:~# qmailct restart
....

Checking in /var/log/qmail-sent/current, there are no more outgoing *@yahoo.com.tw destined emails. Problem solved …

Check and Restart Apache if it is malfunctioning (not returning HTML content) shell script

Monday, March 19th, 2012

Check and Restart Apache Webserver on Malfunction, Apache feather logo

One of the company Debian Lenny 5.0 Webservers, where I'm working as sys admin sometimes stops to properly server HTTP requests.
Whenever this oddity happens, the Apache server seems to be running okay but it is not failing to return requested content

I can see the webserver listens on port 80 and establishing connections to remote hosts – the apache processes show normally as I can see in netstat …:

apache:~# netstat -enp 80
Active Internet connections (w/o servers)
Proto Recv-Q Send-Q Local Address Foreign Address State User Inode PID/Program name
tcp 0 0 xxx.xxx.xxx.xx:80 46.253.9.36:5665 SYN_RECV 0 0 -
tcp 0 0 xxx.xxx.xxx.xx:80 78.157.26.24:5933 SYN_RECV 0 0 -
...

Also the apache forked child processes show normally in process list:

apache:~# ps axuwwf|grep -i apache
root 46748 0.0 0.0 112300 872 pts/1 S+ 18:07 0:00 \_ grep -i apache
root 42530 0.0 0.1 217392 6636 ? Ss Mar14 0:39 /usr/sbin/apache2 -k start
www-data 42535 0.0 0.0 147876 1488 ? S Mar14 0:01 \_ /usr/sbin/apache2 -k start
root 28747 0.0 0.1 218180 4792 ? Sl Mar14 0:00 \_ /usr/sbin/apache2 -k start
www-data 31787 0.0 0.1 219156 5832 ? S Mar14 0:00 | \_ /usr/sbin/apache2 -k start

In spite of that, in any client browser to any of the Apache (Virtual hosts) websites, there is no HTML content returned…
This weird problem continues until the Apache webserver is retarted.
Once webserver is restarted everything is back to normal.
I use Apache Check Apache shell script set on few remote hosts to regularly check with nmap if port 80 (www) of my server is open and responding, anyways this script just checks if the open and reachable and thus using it was unable to detect Apache wasn't able to return back HTML content.
To work around the malfunctions I wrote tiny script – retart_apache_if_empty_content_is_returned.sh

The scripts idea is very simple;
A request is made a remote defined host with lynx text browser, then the output of lines is counted, if the output returned by lynx -dump http://someurl.com is less than the number returned whether normally invoked, then the script triggers an apache init script restart.

I've set the script to periodically run in a cron job, every 5 minutes each hour.
# check if apache returns empty content with lynx and if yes restart and log it
*/5 * * * * /usr/sbin/restart_apache_if_empty_content.sh >/dev/null 2>&1

This is not perfect as sometimes still, there will be few minutes downtime, but at least the downside will not be few hours until I am informed ssh to the server and restart Apache manually

A quick way to download and set from cron execution my script every 5 minutes use:

apache:~# cd /usr/sbin
apache:/usr/sbin# wget -q https://www.pc-freak.net/bscscr/restart_apache_if_empty_content.sh
apache:/usr/sbin# chmod +x restart_apache_if_empty_content.sh
apache:/usr/sbin# crontab -l > /tmp/file; echo '*/5 * * * *' /usr/sbin/restart_apache_if_empty_content.sh 2>&1 >/dev/null


How to resolve (fix) WordPress wp-cron.php errors like “POST /wp-cron.php?doing_wp_cron HTTP/1.0″ 404” / What is wp-cron.php and what it does

Monday, March 12th, 2012

fix wordpress wp-cron.php 404 HTTP error, what is wp-cron.php schedule logo

One of the WordPress websites hosted on our dedicated server produces all the time a wp-cron.php 404 error messages like:

xxx.xxx.xxx.xxx - - [15/Apr/2010:06:32:12 -0600] "POST /wp-cron.php?doing_wp_cron HTTP/1.0

I did not know until recently, whatwp-cron.php does, so I checked in google and red a bit. Many of the places, I've red are aa bit unclear and doesn't give good exlanation on what exactly wp-cron.php does. I wrote this post in hope it will shed some more light on wp-config.php and how this major 404 issue is solved..
So

what is wp-cron.php doing?


  • wp-cron.php is acting like a cron scheduler for WordPress.
  • wp-cron.php is a wp file that controls routine actions for particular WordPress install.
  • Updates the data in SQL database on every, request, every day or every hour etc. – (depending on how it's set up.).
  • wp-cron.php executes automatically by default after EVERY PAGE LOAD!
  • Checks all pending comments for spam with Akismet (if akismet or anti-spam plugin alike is installed)
  • Sends all scheduled emails (e.g. sent a commentor email when someone comments on his comment functionality, sent newsletter subscribed persons emails etc.)
  • Post online scheduled articles for a day and time of particular day

Suppose you're writting a new post and you want to take advantage of WordPress functionality to schedule a post to appear Online at specific time:

What is wordpress wp-cron.php, Scheduling wordpress post screenshot

The Publish Immediately, field execution is being issued on the scheduled time thanks to the wp-cron.php periodic invocation.

Another example for wp-cron.php operation is in handling flushing of WP old HTML Caches generated by some wordpress caching plugin like W3 Total Cache
wp-cron.php takes care for dozens of other stuff silently in the background. That's why many wordpress plugins are depending heavily on wp-cron.php proper periodic execution. Therefore if something is wrong with wp-config.php, this makes wordpress based blog or website partially working or not working at all.
 

Our company wp-cron.php errors case

In our case the:
212.235.185.131 – – [15/Apr/2010:06:32:12 -0600] "POST /wp-cron.php?doing_wp_cron HTTP/1.0" 404
is occuring in Apache access.log (after each unique vistor request to wordpress!.), this is cause wp-cron.php is invoked on each new site visitor site request.
This puts a "vain load" on the Apache Server, attempting constatly to invoke the script … always returning not found 404 err.

As a consequence, the WP website experiences "weird" problems all the time. An illustration of a problem caused by the impoper wp-cron.php execution is when we are adding new plugins to WP.

Lets say a new wordpress extension is download, installed and enabled in order to add new useful functioanlity to the site.

Most of the time this new plugin would be malfunctioning if for example it is prepared to add some kind of new html form or change something on some or all the wordpress HTML generated pages.
This troubles are result of wp-config.php's inability to update settings in wp SQL database, after each new user request to our site.
So the newly added plugin website functionality is not showing up at all, until WP cache directory is manually deleted with rm -rf /var/www/blog/wp-content/cache/

I don't know how thi whole wp-config.php mess occured, however my guess is whoever installed this wordpress has messed something in the install procedure.

Anyways, as I researched thoroughfully, I red many people complaining of having experienced same wp-config.php 404 errs. As I red, most of the people troubles were caused by their shared hosting prohibiting the wp-cron.php execution.
It appears many shared hostings providers choose, to disable the wordpress default wp-cron.php execution. The reason is probably the script puts heavy load on shared hosting servers and makes troubles with server overloads.

Anyhow, since our company server is adedicated server I can tell for sure in our case wordpress had no restrictions for how and when wp-cron.php is invoked.
I've seen also some posts online claiming, the wp-cron.php issues are caused of improper localhost records in /etc/hosts, after a thorough examination I did not found any hosts problems:

hipo@debian:~$ grep -i 127.0.0.1 /etc/hosts
127.0.0.1 localhost.localdomain localhost

You see from below paste, our server, /etc/hosts has perfectly correct 127.0.0.1 records.

Changing default way wp-cron.php is executed

As I've learned it is generally a good idea for WordPress based websites which contain tens of thousands of visitors, to alter the default way wp-cron.php is handled. Doing so will achieve some efficiency and improve server hardware utilization.
Invoking the script, after each visitor request can put a heavy "useless" burden on the server CPU. In most wordpress based websites, the script did not need to make frequent changes in the DB, as new comments in posts did not happen often. In most wordpress installs out there, big changes in the wordpress are not common.

Therefore, a good frequency to exec wp-cron.php, for wordpress blogs getting only a couple of user comments per hour is, half an hour cron routine.

To disable automatic invocation of wp-cron.php, after each visitor request open /var/www/blog/wp-config.php and nearby the line 30 or 40, put:

define('DISABLE_WP_CRON', true);

An important note to make here is that it makes sense the position in wp-config.php, where define('DISABLE_WP_CRON', true); is placed. If for instance you put it at the end of file or near the end of the file, this setting will not take affect.
With that said be sure to put the variable define, somewhere along the file initial defines or it will not work.

Next, with Apache non-root privileged user lets say www-data, httpd, www depending on the Linux distribution or BSD Unix type add a php CLI line to invoke wp-cron.php every half an hour:

linux:~# crontab -u www-data -e

0,30 * * * * cd /var/www/blog; /usr/bin/php /var/www/blog/wp-cron.php 2>&1 >/dev/null

To assure, the php CLI (Command Language Interface) interpreter is capable of properly interpreting the wp-cron.php, check wp-cron.php for syntax errors with cmd:

linux:~# php -l /var/www/blog/wp-cron.php
No syntax errors detected in /var/www/blog/wp-cron.php

That's all, 404 wp-cron.php error messages will not appear anymore in access.log! 🙂

Just for those who can find the root of the /wp-cron.php?doing_wp_cron HTTP/1.0" 404 and fix the issue in some other way (I'll be glad to know how?), there is also another external way to invoke wp-cron.php with a request directly to the webserver with short cron invocation via wget or lynx text browser.

– Here is how to call wp-cron.php every half an hour with lynxPut inside any non-privileged user, something like:
01,30 * * * * /usr/bin/lynx -dump "http://www.your-domain-url.com/wp-cron.php?doing_wp_cron" 2>&1 >/dev/null

– Call wp-cron.php every 30 mins with wget:

01,30 * * * * /usr/bin/wget -q "http://www.your-domain-url.com/wp-cron.php?doing_wp_cron"

Invoke the wp-cron.php less frequently, saves the server from processing the wp-cron.php thousands of useless times.

Altering the way wp-cron.php works should be seen immediately as the reduced server load should drop a bit.
Consider you might need to play with the script exec frequency until you get, best fit cron timing. For my company case there are only up to 3 new article posted a week, hence too high frequence of wp-cron.php invocations is useless.

With blog where new posts occur once a day a script schedule frequency of 6 up to 12 hours should be ok.


Test your web browser compatability with Acid3 test

Wednesday, January 25th, 2012

Acid3 Test is a group of browser compitability tests. Acid3 test is a good indicator on how Web ready is your browser.

Acidtest is part of the web standards project. Latest Firefox 9.0.1 passes the test on 100% (100/100).
I've tried it with Epiphany and it scored only 67/100, still I'm using Epiphany on daily basis and I'm quite happy with it.
Acid3 browser compitability Test Firefox 9.0.1
The tests involved are testing browser for:
 

  • DOM
  • DOM2
  • Checks on HTML tables and forms browser rendering
  • SVG compitability testing
  • DOM1 and DOM2 compitability
  • Various ECMA Script Javascript compitability tests
  • Unicode (UTF-16 and UTF-8) browser compitability
  • XHML, SMIL, CSS, HTML compitability
  • Content-type image/png, text plain etc.

Acid3 browser test fail
The Acid3 test is written itself in Javascript. It consists of 6 testing "stages" (buckets) upon which the browser tested is evaluated.
Each of the test is represented visually by a rectangle. If the a test stage is passed you see a new rectangle appearing in the tested browser.
In wikipedia, there is a thorough list with web browsers by type and engine and the level of support for the Acid3 test.
The test is of great use if you're web developer.