Posts Tagged ‘command’

KVM Creating LIVE and offline VM snapshot backup of Virtual Machines. Restore KVM VM from backup. Delete old KVM backups

Tuesday, January 16th, 2024

kvm-backup-restore-vm-logo

For those who have to manage Kernel-Based Virtual Machines it is a must to create periodic backups of VMs. The backup is usually created as a procedure part of the Update plan (schedule) of the server either after shut down the machine completely or live.

Since KVM is open source the very logical question for starters, whether KVM supports Live backups. The simple answer is Yes it does.

virsh command as most people know is the default command to manage VMs on KVM running Hypervisor servers to manage the guest domains.

KVM is flexible and could restore a VM based on its XML configuration and the VM data (either a static VM single file) or a filesystem laying on LVM filesystem etc.

To create a snapshot out of the KVM HV, list all VMs and create the backup:

# export VM-NAME=fedora;
# export SNAPSHOT-NAME=fedora-backup;
# virsh list –all


It is useful to check out the snapshot-create-as sub arguments


# virsh help snapshot-create-as

 OPTIONS
    [–domain] <string>  domain name, id or uuid
    –name <string>  name of snapshot
    –description <string>  description of snapshot
    –print-xml      print XML document rather than create
    –no-metadata    take snapshot but create no metadata
    –halt           halt domain after snapshot is created
    –disk-only      capture disk state but not vm state
    –reuse-external  reuse any existing external files
    –quiesce        quiesce guest's file systems
    –atomic         require atomic operation
    –live           take a live snapshot
    –memspec <string>  memory attributes: [file=]name[,snapshot=type]
    [–diskspec]  disk attributes: disk[,snapshot=type][,driver=type][,file=name]


# virsh shutdown $VM_NAME
# virsh snapshot-create-as –domain $VM-NAME –name "$SNAPSHOT-NAME"


1. Creating a KVM VM LIVE (running machine) backup
 

# virsh snapshot-create-as –domain debian \
–name "debian-snapshot-2024" \
–description "VM Snapshot before upgrading to latest Debian" \
–live

On successful execution of KVM Virtual Machine live backup, should get something like:

Domain snapshot debian-snapshot-2024 created


2. Listing backed-up snapshot content of KVM machine
 

# virsh snapshot-list –domain debian


a. To get more extended info about a previous snapshot backup

# virsh snapshot-info –domain debian –snapshotname debian-snapshot-2024


b. Listing info for multiple attached storage qcow partition to a VM
 

# virsh domblklist linux-guest-vm1 –details

Sample Output would be like:

 Type   Device   Target   Source
——————————————————————-
 file   disk     vda      /kvm/linux-host/linux-guest-vm1_root.qcow2
 file   disk     vdb      /kvm/linux-host/linux-guest-vm1_attached_storage.qcow2
 file   disk     vdc      /kvm/linux-host/guest01_logging_partition.qcow2
 file   cdrom    sda      –
 file   cdrom    sdb      


3. Backup KVM only Virtual Machine data files (but not VM state) Live


# virsh snapshot-create-as –name "mint-snapshot-2024" \
–description "Mint Linux snapshot" \
–disk-only \
–live
–domain mint-home-desktop


4. KVM restore snapshot (backup)
 

To revert backup VM state to older backup snapshot:
 

# virsh shutdown –domain manjaro
# virsh snapshot-revert –domain manjaro –snapshotname manjaro-linux-back-2024 –running


5. Delete old unnecessery KVM VM backup
 

# virsh snapshot-delete –domain dragonflybsd –snapshotname dragonfly-freebsd


Resize KVM .img QCOW Image file and Create new LVM partition and ext4 filesystem inside KVM Virtual Machine

Friday, November 10th, 2023

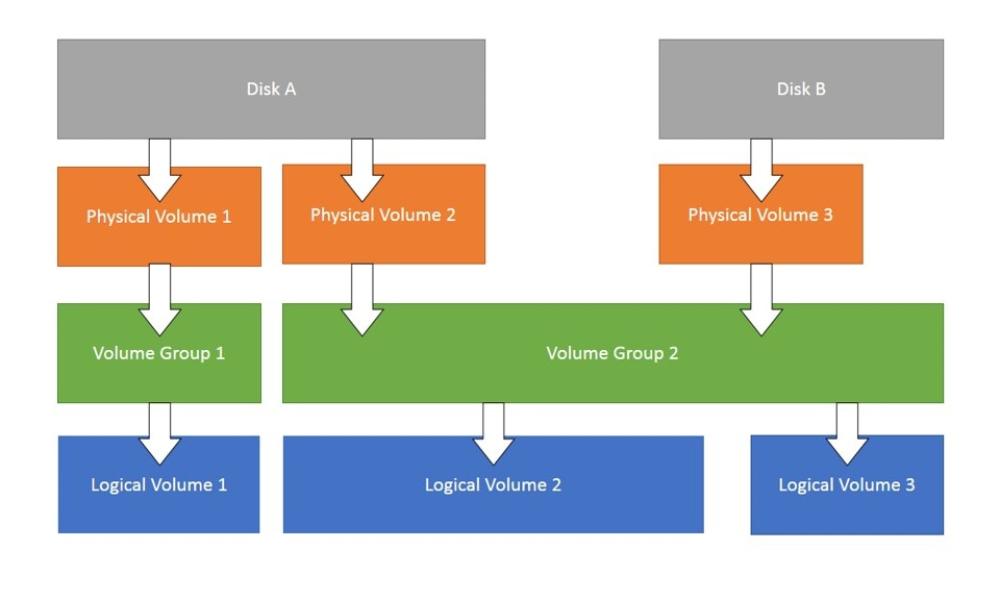
LVM-add-space-to-RHEL-Linux-on-KVM_Virtual_machine-howto

Part of migration project for a customer I'm working on is migration of a couple of KVM based Guest virtual machine servers. The old machines has a backup solution stratetegy using IBM's TSM and the new Machines should use the Cheaper solution adopted by the Customer company using the CommVault backup solution (an enterprise software thath is used for data backup and recovery not only to local Tape Library / Data blobs on central backup servers infra but also in Cloud infrastructure.

To install the CommVault software on the Redhat Linux-es, the official install documentation (prepared by the team who prepared the CommVault) infrastructure for the customer recommends to have a separate partition for the CommVault backups under /opt directory  (/opt/commvault) and the partition should be as a minumum at least 10 Gigabytes of size. 

Unfortunately on our new prepared KVM VM guest machines, it was forgotten to have the separate /opt of 10GB prepared in advanced. And we ended up with Virtual Machines that has a / (root directory) of 68GB size and a separate /var and /home LVM parititons. Thus to correct the issues it was required to find a way to add another separate LVM partition inside the KVM VirtualMachine.img (QCOW Image file). 

This seemed to be an easy task at first as that might be possible with simple .img partition mount with losetup command kpartx and simple lvreduce command in some way such as

# mount /dev/loop0 /mnt/test/

# kpartx -a /dev/loop0
# kpartx -l /dev/loop0
# ls -al /dev/mapper/*

… 

# lvreduce 

etc. however unfortunately kpartx though not returning error did not provided the new /dev/mapper devices to be used with LVM tools and this approach seems to not be possible on RHEL 8.8 as the kpartx couldn't list.


A colleague of mine Mr. Paskalev suggested that we can perhaps try to mount the partition with default KVM tool to mount .img partitions which is guestmount but unfortunately
with a command like:
 

# guestmount -a /kvm/VM.img -i –rw /mnt/test/

But unfortunately this mounted the filesystem in fuse filesystem and the LVM /dev/mapper of the VM can't be seen so we decided to abondon this method.

After some pondering with Dimitar Paskalev and Dimitar Hristov, thanks to joint efforts we found the way to do it, below are the steps we followed to succeed in creating new LVM ext4 partition required.
One would wonder how many system
 

1. Check enough space is available on the HV machine


The VMs are held under /kvm so in this case:

[root@hypervisor-host ~]# df -h|grep -i /kvm
/dev/mapper/vg00-vmprivate  206G   27G  169G  14% /kvm


2. Shutdown the running VM and make sure it is stopped
 

[root@hypervisor-host ~]# virsh shutdown vm-host


[root@hypervisor-host ~]# virsh list –all
 Id   Name       State
————————–
 4    lpdkv01f   running
 5    vm-host   shut off


3. Check current Space status of VM


[root@hypervisor-host ~]# qemu-img info /kvm/vm-host.img       
image: /kvm/vm-host.img
file format: qcow2
virtual size: 100 GiB (107374182400 bytes)
disk size: 8.62 GiB
cluster_size: 65536
Format specific information:
    compat: 1.1
    compression type: zlib
    lazy refcounts: true
    refcount bits: 16
    corrupt: false
    extended l2: false


4. Resize (extend VM) with whatever size you want    
 

[root@hypervisor-host ~]# qemu-img resize /kvm/vm-host.img +10G


5. Start VM    
 

[root@hypervisor-host ~]# virsh start vm-host


7. Check the LVM and block devices on HVs (not necessery but good for an overview)
 

[root@hypervisor-host ~]# pvs
  PV         VG   Fmt  Attr PSize   PFree 
  /dev/sda2  vg00 lvm2 a–  277.87g 19.87g
  
[root@hypervisor-host ~]# vgs
  VG   #PV #LV #SN Attr   VSize   VFree 
  vg00   1  11   0 wz–n- 277.87g 19.87g


[root@hypervisor-host ~]# lsblk 
NAME               MAJ:MIN RM   SIZE RO TYPE MOUNTPOINT
sda                  8:0    0 278.9G  0 disk 
├─sda1               8:1    0     1G  0 part /boot
└─sda2               8:2    0 277.9G  0 part 
  ├─vg00-root      253:0    0    15G  0 lvm  /
  ├─vg00-swap      253:1    0     1G  0 lvm  [SWAP]
  ├─vg00-var       253:2    0     5G  0 lvm  /var
  ├─vg00-spool     253:3    0     2G  0 lvm  /var/spool
  ├─vg00-audit     253:4    0     3G  0 lvm  /var/log/audit
  ├─vg00-opt       253:5    0     2G  0 lvm  /opt
  ├─vg00-home      253:6    0     5G  0 lvm  /home
  ├─vg00-tmp       253:7    0     5G  0 lvm  /tmp
  ├─vg00-log       253:8    0     5G  0 lvm  /var/log
  ├─vg00-cache     253:9    0     5G  0 lvm  /var/cache
  └─vg00-vmprivate 253:10   0   210G  0 lvm  /vmprivate

  
8 . Check logical volumes on Hypervisor host
 

[root@hypervisor-host ~]# lvdisplay 
  — Logical volume —
  LV Path                /dev/vg00/swap
  LV Name                swap
  VG Name                vg00
  LV UUID                3tNa0n-HDVw-dLvl-EC06-c1Ex-9jlf-XAObKm
  LV Write Access        read/write
  LV Creation host, time hypervisor-host, 2023-08-07 13:47:45 +0200
  LV Status              available
  # open                 2
  LV Size                1.00 GiB
  Current LE             256
  Segments               1
  Allocation             inherit
  Read ahead sectors     auto
  – currently set to     8192
  Block device           253:1
   
  — Logical volume —
  LV Path                /dev/vg00/var
  LV Name                var
  VG Name                vg00
  LV UUID                JBerim-fxVv-jU10-nDmd-figw-4jVA-8IYdxU
  LV Write Access        read/write
  LV Creation host, time hypervisor-host, 2023-08-07 13:47:45 +0200
  LV Status              available
  # open                 1
  LV Size                5.00 GiB
  Current LE             1280
  Segments               1
  Allocation             inherit
  Read ahead sectors     auto
  – currently set to     8192
  Block device           253:2
   
  — Logical volume —
  LV Path                /dev/vg00/spool
  LV Name                spool
  VG Name                vg00
  LV UUID                nFlmp2-iXg1-tFxc-FKaI-o1dA-PO70-5Ve0M9
  LV Write Access        read/write
  LV Creation host, time hypervisor-host, 2023-08-07 13:47:45 +0200
  LV Status              available
  # open                 1
  LV Size                2.00 GiB
  Current LE             512
  Segments               1
  Allocation             inherit
  Read ahead sectors     auto
  – currently set to     8192
  Block device           253:3
   
  — Logical volume —
  LV Path                /dev/vg00/audit
  LV Name                audit
  VG Name                vg00
  LV UUID                e6H2OC-vjKS-mPlp-JOmY-VqDZ-ITte-0M3npX
  LV Write Access        read/write
  LV Creation host, time hypervisor-host, 2023-08-07 13:47:46 +0200
  LV Status              available
  # open                 1
  LV Size                3.00 GiB
  Current LE             768
  Segments               1
  Allocation             inherit
  Read ahead sectors     auto
  – currently set to     8192
  Block device           253:4
   
  — Logical volume —
  LV Path                /dev/vg00/opt
  LV Name                opt
  VG Name                vg00
  LV UUID                oqUR0e-MtT1-hwWd-MhhP-M2Y4-AbRo-Kx7yEG
  LV Write Access        read/write
  LV Creation host, time hypervisor-host, 2023-08-07 13:47:46 +0200
  LV Status              available
  # open                 1
  LV Size                2.00 GiB
  Current LE             512
  Segments               1
  Allocation             inherit
  Read ahead sectors     auto
  – currently set to     8192
  Block device           253:5
   
  — Logical volume —
  LV Path                /dev/vg00/home
  LV Name                home
  VG Name                vg00
  LV UUID                ehdsH7-okS3-gPGk-H1Mb-AlI7-JOEt-DmuKnN
  LV Write Access        read/write
  LV Creation host, time hypervisor-host, 2023-08-07 13:47:47 +0200
  LV Status              available
  # open                 1
  LV Size                5.00 GiB
  Current LE             1280
  Segments               1
  Allocation             inherit
  Read ahead sectors     auto
  – currently set to     8192
  Block device           253:6
   
  — Logical volume —
  LV Path                /dev/vg00/tmp
  LV Name                tmp
  VG Name                vg00
  LV UUID                brntSX-IZcm-RKz2-CP5C-Pp00-1fA6-WlA7lD
  LV Write Access        read/write
  LV Creation host, time hypervisor-host, 2023-08-07 13:47:47 +0200
  LV Status              available
  # open                 1
  LV Size                5.00 GiB
  Current LE             1280
  Segments               1
  Allocation             inherit
  Read ahead sectors     auto
  – currently set to     8192
  Block device           253:7
   
  — Logical volume —
  LV Path                /dev/vg00/log
  LV Name                log
  VG Name                vg00
  LV UUID                ZerDyL-birP-Pwck-yvFj-yEpn-XKsn-sxpvWY
  LV Write Access        read/write
  LV Creation host, time hypervisor-host, 2023-08-07 13:47:47 +0200
  LV Status              available
  # open                 1
  LV Size                5.00 GiB
  Current LE             1280
  Segments               1
  Allocation             inherit
  Read ahead sectors     auto
  – currently set to     8192
  Block device           253:8
   
  — Logical volume —
  LV Path                /dev/vg00/cache
  LV Name                cache
  VG Name                vg00
  LV UUID                bPPfzQ-s4fH-4kdT-LPyp-5N20-JQTB-Y2PrAG
  LV Write Access        read/write
  LV Creation host, time hypervisor-host, 2023-08-07 13:47:48 +0200
  LV Status              available
  # open                 1
  LV Size                5.00 GiB
  Current LE             1280
  Segments               1
  Allocation             inherit
  Read ahead sectors     auto
  – currently set to     8192
  Block device           253:9
   
  — Logical volume —
  LV Path                /dev/vg00/root
  LV Name                root
  VG Name                vg00
  LV UUID                mZr3p3-52R3-JSr5-HgGh-oQX1-B8f5-cRmaIL
  LV Write Access        read/write
  LV Creation host, time hypervisor-host, 2023-08-07 13:47:48 +0200
  LV Status              available
  # open                 1
  LV Size                15.00 GiB
  Current LE             3840
  Segments               1
  Allocation             inherit
  Read ahead sectors     auto
  – currently set to     8192
  Block device           253:0
   
  — Logical volume —
  LV Path                /dev/vg00/vmprivate
  LV Name                vmprivate
  VG Name                vg00
  LV UUID                LxNRWV-le3h-KIng-pUFD-hc7M-39Gm-jhF2Aj
  LV Write Access        read/write
  LV Creation host, time hypervisor-host, 2023-09-18 11:54:19 +0200
  LV Status              available
  # open                 1
  LV Size                210.00 GiB
  Current LE             53760
  Segments               1
  Allocation             inherit
  Read ahead sectors     auto
  – currently set to     8192
  Block device           253:10

9. Check Hypervisor existing partitions and space
 

[root@hypervisor-host ~]# fdisk -l
Disk /dev/sda: 278.9 GiB, 299439751168 bytes, 584843264 sectors
Units: sectors of 1 * 512 = 512 bytes
Sector size (logical/physical): 512 bytes / 512 bytes
I/O size (minimum/optimal): 512 bytes / 512 bytes
Disklabel type: dos
Disk identifier: 0x0581e6e2

Device     Boot   Start       End   Sectors   Size Id Type
/dev/sda1  *       2048   2099199   2097152     1G 83 Linux
/dev/sda2       2099200 584843263 582744064 277.9G 8e Linux LVM


Disk /dev/mapper/vg00-root: 15 GiB, 16106127360 bytes, 31457280 sectors
Units: sectors of 1 * 512 = 512 bytes
Sector size (logical/physical): 512 bytes / 512 bytes
I/O size (minimum/optimal): 512 bytes / 512 bytes


Disk /dev/mapper/vg00-swap: 1 GiB, 1073741824 bytes, 2097152 sectors
Units: sectors of 1 * 512 = 512 bytes
Sector size (logical/physical): 512 bytes / 512 bytes
I/O size (minimum/optimal): 512 bytes / 512 bytes


Disk /dev/mapper/vg00-var: 5 GiB, 5368709120 bytes, 10485760 sectors
Units: sectors of 1 * 512 = 512 bytes
Sector size (logical/physical): 512 bytes / 512 bytes
I/O size (minimum/optimal): 512 bytes / 512 bytes


Disk /dev/mapper/vg00-spool: 2 GiB, 2147483648 bytes, 4194304 sectors
Units: sectors of 1 * 512 = 512 bytes
Sector size (logical/physical): 512 bytes / 512 bytes
I/O size (minimum/optimal): 512 bytes / 512 bytes


Disk /dev/mapper/vg00-audit: 3 GiB, 3221225472 bytes, 6291456 sectors
Units: sectors of 1 * 512 = 512 bytes
Sector size (logical/physical): 512 bytes / 512 bytes
I/O size (minimum/optimal): 512 bytes / 512 bytes


Disk /dev/mapper/vg00-opt: 2 GiB, 2147483648 bytes, 4194304 sectors
Units: sectors of 1 * 512 = 512 bytes
Sector size (logical/physical): 512 bytes / 512 bytes
I/O size (minimum/optimal): 512 bytes / 512 bytes


Disk /dev/mapper/vg00-home: 5 GiB, 5368709120 bytes, 10485760 sectors
Units: sectors of 1 * 512 = 512 bytes
Sector size (logical/physical): 512 bytes / 512 bytes
I/O size (minimum/optimal): 512 bytes / 512 bytes


Disk /dev/mapper/vg00-tmp: 5 GiB, 5368709120 bytes, 10485760 sectors
Units: sectors of 1 * 512 = 512 bytes
Sector size (logical/physical): 512 bytes / 512 bytes
I/O size (minimum/optimal): 512 bytes / 512 bytes


Disk /dev/mapper/vg00-log: 5 GiB, 5368709120 bytes, 10485760 sectors
Units: sectors of 1 * 512 = 512 bytes
Sector size (logical/physical): 512 bytes / 512 bytes
I/O size (minimum/optimal): 512 bytes / 512 bytes


Disk /dev/mapper/vg00-cache: 5 GiB, 5368709120 bytes, 10485760 sectors
Units: sectors of 1 * 512 = 512 bytes
Sector size (logical/physical): 512 bytes / 512 bytes
I/O size (minimum/optimal): 512 bytes / 512 bytes


Disk /dev/mapper/vg00-vmprivate: 210 GiB, 225485783040 bytes, 440401920 sectors
Units: sectors of 1 * 512 = 512 bytes
Sector size (logical/physical): 512 bytes / 512 bytes
I/O size (minimum/optimal): 512 bytes / 512 bytes


10. List block devices on VM
 

[root@vm-host ~]# lsblk 
NAME               MAJ:MIN RM  SIZE RO TYPE MOUNTPOINT
sr0                 11:0    1 1024M  0 rom  
vda                252:0    0  100G  0 disk 
├─vda1             252:1    0    1G  0 part /boot
├─vda2             252:2    0   88G  0 part 
│ ├─vg00-root      253:0    0   68G  0 lvm  /
│ ├─vg00-home      253:2    0   10G  0 lvm  /home
│ └─vg00-var       253:3    0   10G  0 lvm  /var
├─vda3             252:3    0    1G  0 part [SWAP]
└─vda4             252:4    0   10G  0 part 


11. Create new LVM partition with fdisk or cfdisk
 

If there is no cfdisk new resized space with qemu-img could be setup with a fdisk, though I personally always prefer to use cfdisk

[root@vm-host ~]# fdisk /dev/vda
# > p (print)
# > m (manfile)
# > n
# … follow on screen instructions to select start and end blocks
# > t (change partition type)
# > select and set to 8e
# > w (write changes)

[root@vm-host ~]# cfdisk /dev/vda


Setup new partition from Free space as [ primary ] partition and Choose to be of type LVM


12. List partitions to make sure new LVM partition is present
 

[root@vm-host ~]# fdisk -l
Disk /dev/vda: 100 GiB, 107374182400 bytes, 209715200 sectors
Units: sectors of 1 * 512 = 512 bytes
Sector size (logical/physical): 512 bytes / 512 bytes
I/O size (minimum/optimal): 512 bytes / 512 bytes
Disklabel type: dos
Disk identifier: 0xe7b2d9fd

Device     Boot     Start       End   Sectors Size Id Type
/dev/vda1  *         2048   2099199   2097152   1G 83 Linux
/dev/vda2         2099200 186646527 184547328  88G 8e Linux LVM
/dev/vda3       186646528 188743679   2097152   1G 82 Linux swap / Solaris
/dev/vda4       188743680 209715199  20971520  10G 8e Linux LVM

The extra added 10 Giga is seen under /dev/vda4.
  — Physical volume —
  PV Name               /dev/vda4
  VG Name               vg01
  PV Size               10.00 GiB / not usable 4.00 MiB
  Allocatable           yes (but full)
  PE Size               4.00 MiB
  Total PE              2559
  Free PE               0
  Allocated PE          2559
  PV UUID               yvMX8a-sEka-NLA7-53Zj-fFdZ-Jd2K-r0Db1z
   
  — Physical volume —
  PV Name               /dev/vda2
  VG Name               vg00
  PV Size               <88.00 GiB / not usable 3.00 MiB
  Allocatable           yes (but full)
  PE Size               4.00 MiB
  Total PE              22527
  Free PE               0
  Allocated PE          22527
  PV UUID               i4UpGr-h9Cd-iKBu-KqEI-15vK-CGc1-DwRPj8
   
[root@vm-host ~]# 


13. List LVM Physical Volumes
 

[root@vm-host ~]# pvdisplay 
  — Physical volume —
  PV Name               /dev/vda2
  VG Name               vg00
  PV Size               <88.00 GiB / not usable 3.00 MiB
  Allocatable           yes (but full)
  PE Size               4.00 MiB
  Total PE              22527
  Free PE               0
  Allocated PE          22527
  PV UUID               i4UpGr-h9Cd-iKBu-KqEI-15vK-CGc1-DwRPj8


  Notice the /dev/vda4 is not seen in pvdisplay (Physical Volume display command) because not created yet, so lets create it.
 

14. Initialize new Physical Volume to be available for use by LVM
 

[root@vm-host ~]# pvcreate /dev/vda4


15. Inform the OS for partition table changes
 

If partprobe is not available as command on the host, below obscure command should do the trick.
 

[root@vm-host ~]# echo "- – -" | tee /sys/class/scsi_host/host*/scan

However usually, better to use partprobe to inform the Operating System of partition table changes

[root@vm-host ~]# partprobe


16. Use lsblk again to see the new /dev/vda4 LVM is listed into "vda" root block device
 

[root@vm-host ~]# 
[root@vm-host ~]# lsblk
NAME          MAJ:MIN RM  SIZE RO TYPE MOUNTPOINT
sr0            11:0    1 1024M  0 rom  
vda           252:0    0  100G  0 disk 
├─vda1        252:1    0    1G  0 part /boot
├─vda2        252:2    0   88G  0 part 
│ ├─vg00-root 253:0    0   68G  0 lvm  /
│ ├─vg00-home 253:1    0   10G  0 lvm  /home
│ └─vg00-var  253:2    0   10G  0 lvm  /var
├─vda3        252:3    0    1G  0 part [SWAP]
└─vda4        252:4    0   10G  0 part 
[root@vm-host ~]# 


17. Create new Volume Group (VG) on /dev/vda4 block device
 

Before creating a new VG, list what kind of VG is on the machine to be sure the new created one will not be already present.
 

[root@vm-host ~]# vgdisplay 
  — Volume group —
  VG Name               vg00
  System ID             
  Format                lvm2
  Metadata Areas        1
  Metadata Sequence No  4
  VG Access             read/write
  VG Status             resizable
  MAX LV                0
  Cur LV                3
  Open LV               3
  Max PV                0
  Cur PV                1
  Act PV                1
  VG Size               <88.00 GiB
  PE Size               4.00 MiB
  Total PE              22527
  Alloc PE / Size       22527 / <88.00 GiB
  Free  PE / Size       0 / 0   
  VG UUID               oyo1oY-saSm-0IKk-gZnf-Knwz-utO7-Aw8c60

vg00 is existing only, so we can use vg01 as a Volume Group name for the new volume group where the fresh 10GB LVM partition will lay

[root@vm-host ~]# vgcreate vg01 /dev/vda4
  Volume group "vg01" successfully created


18. Create new Logical Volume (LV) and extend it to occupy the full space available on Volume Group vg01


[root@vm-host ~]# lvcreate -n commvault -l 100%FREE vg01
  Logical volume "commvault" created.

  An alternative way to create the same LV is by running:

lvcreate -n commvault -L 10G vg01


19. Relist block devices with lsblk to make sure the new created Logical Volume commvault is really present and seen, in case of it missing re-run again partprobe cmd
 

[root@vm-host ~]# lsblk 
NAME               MAJ:MIN RM  SIZE RO TYPE MOUNTPOINT
sr0                 11:0    1 1024M  0 rom  
vda                252:0    0  100G  0 disk 
├─vda1             252:1    0    1G  0 part /boot
├─vda2             252:2    0   88G  0 part 
│ ├─vg00-root      253:0    0   68G  0 lvm  /
│ ├─vg00-home      253:1    0   10G  0 lvm  /home
│ └─vg00-var       253:2    0   10G  0 lvm  /var
├─vda3             252:3    0    1G  0 part [SWAP]
└─vda4             252:4    0   10G  0 part 
  └─vg01-commvault 253:3    0   10G  0 lvm  


As it is not mounted yet, the VG will be not seen in df free space but will be seen as a volume group with vgdispaly
 

[root@vm-host ~]# df -h
Filesystem                  Size  Used Avail Use% Mounted on
devtmpfs                    2.8G     0  2.8G   0% /dev
tmpfs                       2.8G   33M  2.8G   2% /dev/shm
tmpfs                       2.8G   17M  2.8G   1% /run
tmpfs                       2.8G     0  2.8G   0% /sys/fs/cgroup
/dev/mapper/vg00-root        67G  2.4G   61G   4% /
/dev/mapper/vg00-var        9.8G 1021M  8.3G  11% /var
/dev/mapper/vg00-home       9.8G   24K  9.3G   1% /home
/dev/vda1                   974M  242M  665M  27% /boot
tmpfs                       569M     0  569M   0% /run/user/0


[root@vm-host ~]# vgdisplay 
  — Volume group —
  VG Name               vg01
  System ID             
  Format                lvm2
  Metadata Areas        1
  Metadata Sequence No  2
  VG Access             read/write
  VG Status             resizable
  MAX LV                0
  Cur LV                1
  Open LV               0
  Max PV                0
  Cur PV                1
  Act PV                1
  VG Size               <10.00 GiB
  PE Size               4.00 MiB
  Total PE              2559
  Alloc PE / Size       2559 / <10.00 GiB
  Free  PE / Size       0 / 0   
  VG UUID               nYP0tv-IbFw-fBVT-slBB-H1hF-jD0h-pE3V0S
   
  — Volume group —
  VG Name               vg00
  System ID             
  Format                lvm2
  Metadata Areas        1
  Metadata Sequence No  4
  VG Access             read/write
  VG Status             resizable
  MAX LV                0
  Cur LV                3
  Open LV               3
  Max PV                0
  Cur PV                1
  Act PV                1
  VG Size               <88.00 GiB
  PE Size               4.00 MiB
  Total PE              22527
  Alloc PE / Size       22527 / <88.00 GiB
  Free  PE / Size       0 / 0   
  VG UUID               oyo1oY-saSm-0IKk-gZnf-Snwz-utO7-Aw8c60


20. Create new ext4 filesystem on the just created vg01-commvault   
 

[root@vm-host ~]# mkfs.ext4 /dev/mapper/vg01-commvault 

[root@vm-host ~]# mkfs.ext4 /dev/mapper/vg01-commvault 
mke2fs 1.45.6 (20-Mar-2020)
Discarding device blocks: done                            
Creating filesystem with 2620416 4k blocks and 655360 inodes
Filesystem UUID: 1491d8b1-2497-40fe-bc40-5faa6a2b2644
Superblock backups stored on blocks: 
        32768, 98304, 163840, 229376, 294912, 819200, 884736, 1605632

Allocating group tables: done                            
Writing inode tables: done                            
Creating journal (16384 blocks): done
Writing superblocks and filesystem accounting information: done 


21. Mount vg01-commvault into /opt directory
 

[root@vm-host ~]# mkdir -p /opt/

[root@vm-host ~]# mount /dev/mapper/vg01-commvault /opt/


22. Check mount is present on VM guest OS
 

[root@vm-host ~]# mount|grep -i /opt
/dev/mapper/vg01-commvault on /opt type ext4 (rw,relatime)
[root@vm-host ~]# 

[root@vm-host ~]# df -h|grep -i opt
/dev/mapper/vg01-commvault  9.8G   24K  9.3G   1% /opt
[root@vm-host ~]# 
 

23. Add vg01-commvault to be auto mounted via /etc/fstab on next Virtual Machine reboot
 

[root@vm-host ~]# echo '/dev/mapper/vg01-commvault /opt         ext4            defaults        1        2' >> /etc/fstab

[root@vm-host ~]# rpm -ivh commvault-fs.Instance001-11.0.0-80.240.0.3589820.240.4083067.el8.x86_64.rpm

[root@vm-host ~]# systemctl status commvault
● commvault.Instance001.service – commvault Service
   Loaded: loaded (/etc/systemd/system/commvault.Instance001.service; enabled; vendor preset: disabled)
   Active: active (running) since Fri 2023-11-10 15:13:59 CET; 27s ago
  Process: 9972 ExecStart=/opt/commvault/Base/Galaxy start direct -focus Instance001 (code=exited, status=0/SUCCESS)
    Tasks: 54
   Memory: 155.5M
   CGroup: /system.slice/commvault.Instance001.service
           ├─10132 /opt/commvault/Base/cvlaunchd
           ├─10133 /opt/commvault/Base/cvd
           ├─10135 /opt/commvault/Base/cvfwd
           └─10137 /opt/commvault/Base/ClMgrS

Nov 10 15:13:57 vm-host.ffm.de.int.atosorigin.com systemd[1]: Starting commvault Service…
Nov 10 15:13:58 vm-host.ffm.de.int.atosorigin.com Galaxy[9972]: Cleaning up /opt/commvault/Base/Temp …
Nov 10 15:13:58 vm-host.ffm.de.int.atosorigin.com Galaxy[9972]: Starting Commvault services for Instance001 …
Nov 10 15:13:59 vm-host.ffm.de.int.atosorigin.com Galaxy[9972]: [22B blob data]
Nov 10 15:13:59 vm-host.ffm.de.int.atosorigin.com systemd[1]: Started commvault Service.
[root@vm-host ~]# 


24. Install Commvault backup client RPM in new mounted LVM under /opt

[root@vm-host ~]#  rpm -ivh commvault.rpm

How to create PCS / Corosync High Availability Cluster config backup and migrate to new Virtual Machines

Thursday, October 26th, 2023

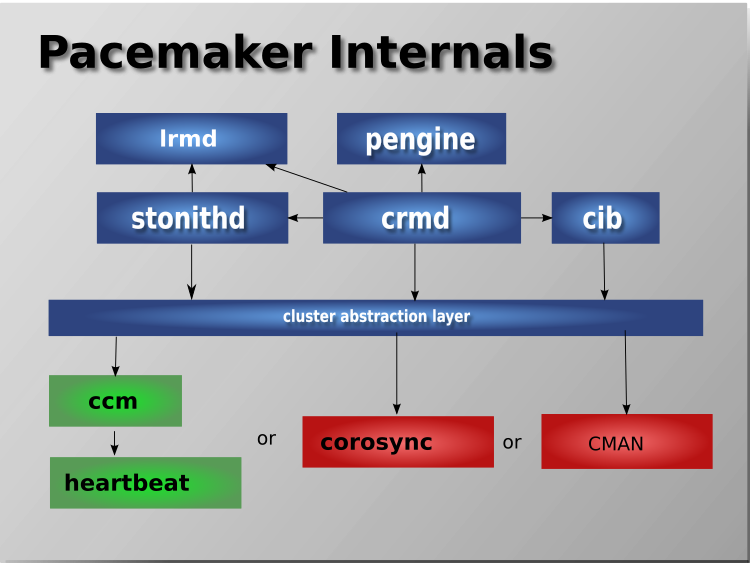
pcs-pcmk-internals-explained-picture

The aim of this article is to illustrate how to literally migrate a an Haproxy PCS Pacemaker / Corosync Cluster configurations from old Virtual Machines that due to time passed become unsupported (The Operating System end of life (EOF)) has reached to a new ones. 
This is quite a complex task especially as you usually need to setup the Hypervisor hosts with VMWare / Xen / KVM / OpenVZ or whatever kind of virtualization is to be used. Then setup the correct network interfaces IPs failover the heartbeat lines over which the cluster will work to prevent Split Brain scenartions, the Network Bonding interfaces to guarantee a higher amount of higher availability as well as physically install and update all the cluster software on the new built Linux hosts that will be members of the new cluster in setup. 

All this configuration from scratch of a PCS Corosync cluster is a very lenght topic which I'll try to cover in some of my next articles. In short to migrate the cluster from old machines to new once all this predescribed steps are in line. 
You will need to.


1. Create backup of old cluster configuration
2. Migrate the backup to a new built VM Machine hosts
3. Import the cluster configuration into the PCS Cluster.


Bear in mind that this article discusses a migration of CentOS Linux release 7.9.2009 with its shipped versions of corosync / pacemaker and pcs 

How to create cluster config backup and migrate to new VM

1. Dump cluster assuming that is a Quality Assuare or Pre – Production host  to create full cluster config backup

[root@old-cluster-machine ~]# pcs config backup old-cluster-machine.pcs.config.bak

2. Dump cluster Production full configuration

[root@old-cluster-machine1 ~]# pcs config backup old-cluster-machine1.pcs.config.bak

This command will output a backup of 

old-cluster-machine1.pcs.config.bak.tar.bz2

3. Migrate a cluster identical config to the new Virtual machines

Usually this moval of produced backup files with pcs config backup  commands can be copied with something like FTP / SFTP  or SSL-ed / TLS-ed protocol. However if you have to move the configuration files from a paranoid Citrix environment that doesn't allow you to have any SFTP / SSH or FTP kind of transfer protocol from the location where the old config lays to the new ones. 
A simple encoding of the binary format dumped configuration to plain text files can be done and files, can be moved via a simple copy / paste operation (a bit of a hack) 🙂

Encode the cluster config to be able to migrate configuration in plain text via a simple Copy / Paste operation.


[root@old-cluster-machine ~]# base64 config backup old-cluster-machine.pcs.config.bak > old-cluster-machine.pcs.config.bak.tgz.b64

[root@old-cluster-machine1 ~]# base64 old-cluster-machine1.pcs.config.bak.tar.bz2 > old-cluster-machine1.pcs.config.bak.tgz.b64
[root@old-cluster-machine ~]# cat  old-cluster-machine.pcs.config.bak.tgz.b64

(Copy output and Paste to new host VM) /root/haproxy-cluster-backup)

[root@old-cluster-machine1 ~]# cat old-cluster-machine1.pcs.config.bak.tgz.b64 


(Copy output and Paste to new host VM) /root/haproxy-cluster-backup)

Login to the new hosts, where configs has to be migrated and restore the files with base64

For QA / Preprod to restore backup config

[root@dkv-newqa-vm ~]# mkdir /root/haproxy-cluster-backup
[root@dkv-newqa-vm ~]# cd /root/haproxy-cluster-backup
[root@dkv-newqa-vm ~]# base64 -d old-cluster-machine.config.bak.tgz.b64 > old-cluster-machine.pcs.config.bak.tar.bz2
[root@dkv-newqa-vm ~]#  tar -jxvf old-cluster-machine.pcs.config.bak.tar.bz2
ak.tar.bz2
version.txt
pcs_settings.conf
corosync.conf
cib.xml
pacemaker_authkey
uidgid.d/


For Prod to restore backup config

[root@dkv-newprod-vm  ~]# mkdir /root/haproxy-cluster-backup
[root@dkv-newprod-vm ~]# cd /root/haproxy-cluster-backup
[root@dkv-newprod-vm ~]# base64 -d old-cluster-machine.config.bak.tgz.b64 > old-cluster-machine1.pcs.config.bak.tar.bz2
ak.tar.bz2
version.txt
pcs_settings.conf
corosync.conf
cib.xml
pacemaker_authkey
uidgid.d/


N!B! An Useful hin is on RHEL 8 Linux's shipped pcs command version has also a very useful command with which you can simply dump completly the config of the cluster in straight commands which you can run directly on the new VM machines where you have migrated.

The command to print out commands that would add existing cluster resources on Redhat 8:

# pcs resource config –output-format=cmd

Another useful command for cluster migration is cibadmin

i.e. to dump cluster xml config

#cibadmin –q > cluster.xml

Later you can import the prior xml dump with it.

# cibadmin –replace –xml-file cib.xml


Generate and Add UUID for every existing Redhat / CentOS / RHEL network interface to configuration if missing howto

Saturday, August 5th, 2023

linux-fix-missing-uid-on-redhat-centos-fedora-networking-logo

If you manage old Linux machines it might be after the update either due to update mess or because of old system administrators which manually included the UUID to the config forgot to include it in the present network configuration in /etc/sysconfig/networking-scripts/ifcfg-* Universally Unique IDentifier (UUID)128-bit label I used a small one liner after listing all the existing configured LAN interfaces reported from iproute2 network stack with ip command. As this might be useful to someone out there here is the simple command that returns a number of commands to later just copy paste to console once verified there are no duplicates of the UUID already in the present server configuration with grep.

In overall to correct the configs and reload the network with the proper UUIDs here is what I had to do:


# grep -rli UUID /etc/sysconfig/network-scripts/ifcfg-*

No output from the recursive grep means UUIDs are not present on any existing interface, so we can step further check all the existing machines network ifaces and generate the missing UUIDs with uuidgen command

# ip a s |grep -Ei ': <'|sed -e 's#:##g' |grep -v '\.' |awk '{ print $2 }'
ifcfg-venet0
ifcfg-eth0
ifcfg-eth1

ifcfg-eth2
ifcfg-eth3

I've stumbled on that case on some legacy Linux inherited from other people sysadmins and in order to place the correct 

# for i in $(ip a s |grep -Ei ': <'|sed -e 's#:##g' |grep -v '\.' |awk '{ print $2 }'); do echo "echo UUID=$(uuidgen $i)"" >> ifcfg-$i"; done|grep -v '\-lo' 
echo UUID=26819d24-9452-4431-a9ca-176d87492b75 >> ifcfg-venet0
echo UUID=3c7e8848-0232-436f-a52a-46db9a03eb33 >> ifcfg-eth0
echo UUID=1fc0454d-bf23-417d-b960-571fc04754d2 >> ifcfg-eth1
echo UUID=5793c1e5-4481-4f09-967e-2cceda85c35f >> ifcfg-eth2
echo UUID=65fdcaf6-d271-4845-a8f1-0ec478c375d1 >> ifcfg-eth3


As you can see I exclude the loopback interface -lo from the ouput as it is not necessery to have UUID for it.
That's all folks problem solved. Enjoy

Howto convert KVM QCOW2 format Virtual Machine to Vmdk to migrate to VMware ESXi

Thursday, November 17th, 2022

qcow2-to-vmdkvk-convert-to-complete-linux-kvm-to-vmware-esxi-migration

Why you would want to convert qcow2 to vmdk?

When managing the heterogeneous virtual environment or changing the virtualization solutions that become so common nowadays, you might need to migrate qcow2 from a Linux based KVM virtualization solution to VMWare's proprietary  vmdk – the file format in which a VMWare does keep stored it's VMs, especially if you have a small business or work in a small start-up company where you cannot afford to buy something professional as VMware vCenter Converter Standalone or Microsoft virtual machine converter (MVMC)- usually used to to migrate VMware hosts to Hyper-V hosts, but also capable to migrate .qcow2 to .vmdk. The reason is that your old datacenter based on Linux OS custom KVM virtual machines might be moved to VMWare ESX to guarantee better and more systemized management (which though is very questionable, since most of my experiences with VMWare was that though the software was a great one, the people who manage it was not very much specialists in managing it).

Another common reason is that running a separate Linux virtual machine, costs you more than a well organized VMWare farm because you need more qualified Linux specialists to manage the KVMs thus KVM to VMWare management as in most big corporations nowadays’s main target is to cut the costs.
Even with successful migrations like that, though you might often expect a drop in the quality of the service when your VM ends in the VMWare farm.

Nomatter what’s the reason to migrate qcow2 to VMDK So lets proceed with how the .QCOW2 to .VMDK can be easily done.


1. Get information about the VM you would like to migrate to VMDK

In QEMU-KVM environment, the popular image format is qcow2, which outperforms the first generation of qcow format and raw format. You can find the files of virtual disks by checking the information of virtual machine by virsh command:

[root@hypervisor-machine ~]# virsh dominfo virtual-machine-name

INFO
ID: {e59ae416-9314-4e4b-af07-21c31d91b3fb}
EnvID: 1704649750
Name: CentOS7minimal
Description:
Type: VM
State: stopped
OS: centos7
Template: no
Uptime: 00:00:00 (since 2019-04-25 13:04:11)
Home: /vz/vmprivate/e39ae416-9314-4e4b-af05-21c31d91b3fb/
Owner: root@.
GuestTools: state=not_installed
GuestTools autoupdate: on
Autostart: off
Autostop: shutdown
Autocompact: off
Boot order: hdd0 cdrom0
EFI boot: off
Allow select boot device: off
External boot device:
On guest crash: restart
Remote display: mode=manual port=6903 address=0.0.0.0
Remote display state: stopped
Hardware:
  cpu sockets=1 cpus=2 cores=2 VT-x accl=high mode=64 ioprio=4 iolimit='0'
  memory 2048Mb
  video 32Mb 3d acceleration=off vertical sync=yes
  memory_guarantee auto
  hdd0 (+) scsi:0 image='/vz/vmprivate/e59ae415-9314-4e4b-af05-21c31d91b3fb/harddisk.hdd' type='expanded' 5120Mb subtype=virtio-scsi
  cdrom0 (+) scsi:1 image='/home/CentOS-7-x86_64-Minimal-1611.iso' state=disconnected subtype=virtio-scsi
  usb (+)
  net0 (+) dev='vme42bef5f3' network='Bridged' mac=001C42BEF5F3 card=virtio ips='10.50.50.27/255.255.255.192 ' gw='10.50.50.1'
SmartMount: (-)
Disabled Windows logo: on
Nested virtualization: off
Offline management: (-)
Hostname: kvmhost.fqdn.com


2. Convert the harddrive to VMDK

[root@hypervisor-machine e59ae415-9314-4e4b-af05-21c31d91b3fb]# ls -lsah

1.3G -rw-r—– 1 root root 1.3G Apr 25 14:43 harddisk.hdd

a. Converstion with qemu:

You can use qemu-img tool that is installable via cmds:

yum install quemu-img / apt install qemu-img / zipper install qemu-img (depending on the distribution RedHat / Debian / SuSE Linux)

-f: format of the source image

-O: format of the target image

[root@hypervisor-machine ~]# qemu-img convert -f qcow2 -O vmdk \-o adapter_type=lsilogic,subformat=streamOptimized,compat6 harddisk.hdd harddisklsilogic.vmdk


[root@ hypervisor-machine e59ae415-9314-4e4b-af05-21c31d91b3fb]# ls -lsah

1.3G -rw-r—– 1 root root 1.3G Apr 25 14:43 harddisk.hdd

536M -rw-r–r– 1 root root 536M Apr 26 14:52 harddisklsilogic.vmdk

3. Upload the new harddrive to the ESXi Hypervisor and adapt it to ESX

This vmdk might not be able to used on ESXi, but you can use it on VMware Workstation. To let it work on ESXi, you need to use vmkfstools to convert it again.


a. Adapt the filesystem to ESXi

[root@hypervisor-machine ~]# vmkfstools -i harddisklsilogic.vmdk  -d thin harddisk.vmdk


4. Create a VM and add the converted harddrive to the machine. 

Futher

Recreate the initramfs

But of course this won’t work directly as it often happens with Linux 🙂 !!. 
We need to make adjustments to the virtual machine as well with few manual interventions:

1. Start the machine from the VMWare interface

2. Grub CentOS Linux rescue will appear from the prompt

3. Run command

dracut –regenerate-all –force


to Recreate the initramfs.
 

Note that You might also have to edit your network configuration since your network device usually get’s a different name.
 

Finally reboot the host:

[root@hypervisor-machine ~]# reboot


And voila you’re ready to play the VM inside the ESX after some testing, you might switch off the KVM Hypervisor hosted VM and reroute the network to point to the ESX Cluster.


Migration of audit messages from snoopy to auditd

Tuesday, April 20th, 2010

his article may be out of date and may be deleted in the future.

This article explains the migration from the previous service "Snoopy" to "Auditd". Only commands that are executed as a user with root rights should be recorded here.


Uninstall/disable snoopy
 

Configuration of auditd

Files needed
Auditd start/stop script

/etc/init.d/auditd

Rules for monitoring by auditd

/etc/audit/audit.rules

Auditd plugin for syslog service

/etc/audisp/plugins.d/syslog.conf

Edit the /etc/audit/audit.rules file
Auditd can be specifically configured to capture and exclude messages. The following list is helpful for excluding certain event entries ("msgtype"):

* 1000 – 1099 are for commanding the audit system
* 1100 – 1199 user space trusted application messages
* 1200 – 1299 messages internal to the audit daemon
* 1300 – 1399 audit event messages
* 1400 – 1499 kernel SE Linux use
* 1500 – 1599 AppArmor events
* 1600 – 1699 kernel crypto events
* 1700 – 1799 kernel abnormal records
* 1800 – 1999 future kernel use (maybe integrity labels and related events)
* 2001 – 2099 unused (kernel)
* 2100 – 2199 user space anomaly records
* 2200 – 2299 user space actions taken in response to anomalies
* 2300 – 2399 user space generated LSPP events
* 2400 – 2499 user space crypto events
* 2500 – 2999 future user space (maybe integrity labels and related events)

Adding the rules

In order for auditd to record the desired events, rules must be defined.

List of rules set up
Below is a list and explanation of the rules set up:

-a exclude,always -F msgtype>=2400 -F msgtype<=2499
-a exclude,always -F msgtype=PATH
-a exclude,always -F msgtype=CWD
-a exclude,always -F msgtype=EOE
-a exit,always -F arch=b64 -F auid!=0 -F auid!=4294967295 -S execve
-a exit,always -F arch=b32 -F auid!=0 -F auid!=4294967295 -S execve

The first rule excludes crypto events in user space – these include, for example, messages about a user logging in.
The second through fourth rules remove the information not necessary for monitoring before it is logged.
The fifth and sixth rules capture the commands entered by users moving within an interactive shell. Services etc. executed by the system are therefore not recorded.
It should be noted here that a separate rule must be created for systems that contain both 32- and 64-bit commands and libraries.

Rule syntax

In general, it makes sense to keep the number of existing rules low in order to reduce the load. Therefore, if possible, several rule fields (-F option) should be combined in one rule. Since Auditd obviously has a problem with multiple event entries that are defined in plain text, these have been created in individual rules. The syntax description of the individual rules is given in the next listing:

-a contains the instructions
The action value "exclude" and the list value "always" are specified for rules that should not lead to any log entry
The action values ​​"exit" and "always" have been specified for rules that should lead to a log entry
"exit" stands for a log entry after the command has been executed
-F defines a rules field
Depending on the application, the rules defined here filter by event entry ("msgtype"), architecture ("arch") and login UID ("auid").
-S stands for the syscall. In the rules that should lead to a log entry, the value "execve" is monitored – i.e. when commands are executed.

Redirect to syslog

Within the file /etc/audisp/plugins.d/syslog.conf the value

active = no
on

active = yes
set.

restart auditd with the command

/etc/init.d/auditd restart
the settings are accepted.

Additional information

The following man pages can be consulted for more information:

auditctl
audit.rules
auditd
auditd.conf

Install Zabbix Agent client on CentOS 9 Stream Linux, Disable Selinux and Firewalld on CentOS9 to make zabbix-agentd send data to server

Thursday, April 14th, 2022

https://pc-freak.net/images/zabbix_agent_active_passive-zabbix-agent-centos-9-install-howto

Installing Zabbix is usually a trivial stuff, you either use the embedded distribution built packages if such are available this is for example defetch the right zabbix release repository  that configures the Zabbix official repo in the system, configure the Zabbix server or Proxy if such is used inside /etc/zabbix/zabbix_agentd.conf and start the client, i.e. I expected that it will be a simple and straight forward also on the freshly installed CentOS 9 Linux cause placing a zabbix-agent monitroing is a trivial stuff however installing came to error:

Key import failed (code 2). Failing package is: zabbix-agent-6.0.3-1.el8.x86_64


This is what I've done

1. Download and install zabbix-release-6.0-1.el8.noarch.rpm directly from zabbix

I've followed the official documentation from zabbix.com and ran:
 

[root@centos9 /root ]# rpm -Uvh https://repo.zabbix.com/zabbix/6.0/rhel/8/x86_64/zabbix-release-6.0-1.el8.noarch.rpm


2. Install  the zabbix-agent RPM package from the repositry

[root@centos9 rpm-gpg]# yum install zabbix-agent -y
Last metadata expiration check: 0:02:46 ago on Tue 12 Apr 2022 08:49:34 AM EDT.
Dependencies resolved.
=============================================
 Package                               Architecture                Version                              Repository                      Size
=============================================
Installing:
 zabbix-agent                          x86_64                      6.0.3-1.el8                          zabbix                         526 k
Installing dependencies:
 compat-openssl11                      x86_64                      1:1.1.1k-3.el9                       appstream                      1.5 M
 openldap-compat                       x86_64                      2.4.59-4.el9                         baseos                          14 k

Transaction Summary
==============================================
Install  3 PackagesTotal size: 2.0 M
Installed size: 6.1 M
Downloading Packages:
[SKIPPED] openldap-compat-2.4.59-4.el9.x86_64.rpm: Already downloaded
[SKIPPED] compat-openssl11-1.1.1k-3.el9.x86_64.rpm: Already downloaded
[SKIPPED] zabbix-agent-6.0.3-1.el8.x86_64.rpm: Already downloaded
Zabbix Official Repository – x86_64                                                                          1.6 MB/s | 1.7 kB     00:00
Importing GPG key 0xA14FE591:
 Userid     : "Zabbix LLC <packager@zabbix.com>"
 Fingerprint: A184 8F53 52D0 22B9 471D 83D0 082A B56B A14F E591
 From       : /etc/pki/rpm-gpg/RPM-GPG-KEY-ZABBIX-A14FE591
Key import failed (code 2). Failing package is: zabbix-agent-6.0.3-1.el8.x86_64
 GPG Keys are configured as: file:///etc/pki/rpm-gpg/RPM-GPG-KEY-ZABBIX-A14FE591
The downloaded packages were saved in cache until the next successful transaction.
You can remove cached packages by e
xecuting 'yum clean packages'.
Error: GPG check FAILED


3. Work around to skip GPG to install zabbix-agent 6 on CentOS 9

With Linux everything becomes more and more of a hack …
The logical thing to was to first,  check and it assure that the missing RPM GPG key is at place

[root@centos9 rpm-gpg]# ls -al  /etc/pki/rpm-gpg/RPM-GPG-KEY-ZABBIX-A14FE591
-rw-r–r– 1 root root 1719 Feb 11 16:29 /etc/pki/rpm-gpg/RPM-GPG-KEY-ZABBIX-A14FE591

Strangely the key was in place.

Hence to have the key loaded I've tried to import the gpg key manually with gpg command:

[root@centos9 rpm-gpg]# gpg –import /etc/pki/rpm-gpg/RPM-GPG-KEY-ZABBIX-A14FE591


And attempted install again zabbix-agent once again:
 

[root@centos9 rpm-gpg]# yum install zabbix-agent -y
Last metadata expiration check: 0:02:46 ago on Tue 12 Apr 2022 08:49:34 AM EDT.
Dependencies resolved.
==============================================
 Package                               Architecture                Version                              Repository                      Size
==============================================
Installing:
 zabbix-agent                          x86_64                      6.0.3-1.el8                          zabbix                         526 k
Installing dependencies:
 compat-openssl11                      x86_64                      1:1.1.1k-3.el9                       appstream                      1.5 M
 openldap-compat                       x86_64                      2.4.59-4.el9                         baseos                          14 k

Transaction Summary
==============================================
Install  3 Packages

Total size: 2.0 M
Installed size: 6.1 M
Downloading Packages:
[SKIPPED] openldap-compat-2.4.59-4.el9.x86_64.rpm: Already downloaded
[SKIPPED] compat-openssl11-1.1.1k-3.el9.x86_64.rpm: Already downloaded
[SKIPPED] zabbix-agent-6.0.3-1.el8.x86_64.rpm: Already downloaded
Zabbix Official Repository – x86_64                                                                          1.6 MB/s | 1.7 kB     00:00
Importing GPG key 0xA14FE591:
 Userid     : "Zabbix LLC <packager@zabbix.com>"
 Fingerprint: A184 8F53 52D0 22B9 471D 83D0 082A B56B A14F E591
 From       : /etc/pki/rpm-gpg/RPM-GPG-KEY-ZABBIX-A14FE591
Key import failed (code 2). Failing package is: zabbix-agent-6.0.3-1.el8.x86_64
 GPG Keys are configured as: file:///etc/pki/rpm-gpg/RPM-GPG-KEY-ZABBIX-A14FE591
The downloaded packages were saved in cache until the next successful transaction.
You can remove cached packages by executing 'yum clean packages'.
Error: GPG check FAILED


Unfortunately that was not a go, so totally pissed off I've disabled the gpgcheck for packages completely as a very raw bad and unrecommended work-around to eventually install the zabbix-agentd like that.

Usually the RPM gpg key failures check on RPM packages could be could be workaround with in dnf, so I've tried that one without success.

[root@centos9 rpm-gpg]# dnf update –nogpgcheck
Total                                                                                                        181 kB/s | 526 kB     00:02
Zabbix Official Repository – x86_64                                                                          1.6 MB/s | 1.7 kB     00:00
Importing GPG key 0xA14FE591:
 Userid     : "Zabbix LLC <packager@zabbix.com>"
 Fingerprint: A184 8F53 52D0 22B9 471D 83D0 082A B56B A14F E591
 From       : /etc/pki/rpm-gpg/RPM-GPG-KEY-ZABBIX-A14FE591
Is this ok [y/N]: y
Key import failed (code 2). Failing package is: zabbix-agent-6.0.3-1.el8.x86_64
 GPG Keys are configured as: file:///etc/pki/rpm-gpg/RPM-GPG-KEY-ZABBIX-A14FE591
The downloaded packages were saved in cache until the next successful transaction.
You can remove cached packages by executing 'dnf clean packages'.
Error: GPG check FAILED

Further tried to use the –nogpgpcheck 
which according to its man page:


–nogpgpcheck 
Skip checking GPG signatures on packages (if RPM policy allows).


In yum the nogpgcheck option according to its man yum does exactly the same thing


[root@centos9 rpm-gpg]# yum install zabbix-agent –nogpgcheck -y
 

Dependencies resolved.
===============================================
 Package                             Architecture                  Version                               Repository                     Size
===============================================
Installing:
 zabbix-agent                        x86_64                        6.0.3-1.el8                           zabbix                        526 k

Transaction Summary
===============================================

Total size: 526 k
Installed size: 2.3 M
Is this ok [y/N]: y
Downloading Packages:

Running transaction check
Transaction check succeeded.
Running transaction test
Transaction test succeeded.
Running transaction
  Preparing        :                                                                                                                     1/1
  Running scriptlet: zabbix-agent-6.0.3-1.el8.x86_64                                                                                     1/2
  Reinstalling     : zabbix-agent-6.0.3-1.el8.x86_64                                                                                     1/2
  Running scriptlet: zabbix-agent-6.0.3-1.el8.x86_64                                                                                     1/2
  Running scriptlet: zabbix-agent-6.0.3-1.el8.x86_64                                                                                     2/2
  Cleanup          : zabbix-agent-6.0.3-1.el8.x86_64                                                                                     2/2
  Running scriptlet: zabbix-agent-6.0.3-1.el8.x86_64                                                                                     2/2
  Verifying        : zabbix-agent-6.0.3-1.el8.x86_64                                                                                     1/2
  Verifying        : zabbix-agent-6.0.3-1.el8.x86_64                                                                                     2/2

Installed:
  zabbix-agent-6.0.3-1.el8.x86_64

Complete!
[root@centos9 ~]#

Voila! zabbix-agentd on CentOS 9 Install succeeded!

Yes I know disabling a GPG check is not really secure and seems to be an ugly solution but since I'm cut of time in the moment and it is just for experimental install of zabbix-agent on CentOS
plus we already trusted the zabbix package repository anyways, I guess it doesn't much matter.

4. Configure Zabbix-agent on the machine

Once you choose how the zabbix-agent should sent the data to the zabbix-server (e.g. Active or Passive) mode the The minimum set of configuration you should
have at place should be something like mine:

[root@centos9 ~]# grep -v '\#' /etc/zabbix/zabbix_agentd.conf | sed /^$/d
PidFile=/var/run/zabbix/zabbix_agentd.pid
LogFile=/var/log/zabbix/zabbix_agentd.log
LogFileSize=0
Server=192.168.1.70,127.0.0.1
ServerActive=192.168.1.70,127.0.0.1
Hostname=centos9
Include=/etc/zabbix/zabbix_agentd.d/*.conf

5. Start and Enable zabbix-agent client

To have it up and running

[root@centos9 ~]# systemct start zabbix-agent
[root@centos9 ~]# systemctl enable zabbix-agent

6. Disable SELinux to prevent it interfere with zabbix-agentd 

Other amazement was that even though I've now had configured Active check and a Server and correct configuration the Zabbix-Server could not reach the zabbix-agent for some weird reason.
I thought that it might be selinux and checked it and seems by default in the fresh installed CentOS 9 Linux selinux is already automatically set to enabled.

After stopping it i made sure, SeLinux would block for security reasons client connectivity to the zabbix-server until you either allow zabbix exception in SeLinux or until completely disable it.
 

[root@centos9 ~]# sestatus

SELinux status:                 enabled
SELinuxfs mount:                /sys/fs/selinux
SELinux root directory:         /etc/selinux
Loaded policy name:             targeted
Current mode:                   enforcing
Mode from config file:          enforcing
Policy MLS status:              enabled
Policy deny_unknown status:     allowed
Memory protection checking:     actual (secure)
Max kernel policy version:      31

To temporarily change the mode from its default targeted to permissive mode 

[root@centos9 ~]# setenforce 0

[root@centos9 ~]# sestatus

SELinux status:                 enabled
SELinuxfs mount:                /sys/fs/selinux
SELinux root directory:         /etc/selinux
Loaded policy name:             targeted
Current mode:                   permissive
Mode from config file:          permissive
Policy MLS status:              enabled
Policy deny_unknown status:     allowed
Memory protection checking:     actual (secure)
Max kernel policy version:      31


That would work for current session but won't take affect on next reboot, thus it is much better to disable selinux on next boot:

[root@centos9 ~]# cat /etc/selinux/config
# This file controls the state of SELinux on the system.
# SELINUX= can take one of these three values:
#     enforcing – SELinux security policy is enforced.
#     permissive – SELinux prints warnings instead of enforcing.
#     disabled – No SELinux policy is loaded.
SELINUX=permissive
# SELINUXTYPE= can take one of these three values:
#     targeted – Targeted processes are protected,
#     minimum – Modification of targeted policy. Only selected processes are protected. 
#     mls – Multi Level Security protection.
SELINUXTYPE=targeted


To disable selinux change:

SELINUXTYPE=disabled

[root@centos9 ~]# grep -v \# /etc/selinux/config

SELINUX=disabled
SELINUXTYPE=targeted


To make the OS disable selinux and test it is disabled you will have to reboot 

[root@centos9 ~]# reboot


Check its status again, it should be:

[root@centos9 ~]# sestatus
SELinux status:                 disabled


7. Enable zabbix-agent through firewall or disable firewalld service completely

By default CentOS 9 has the firewalld also enabled and either you have to enable zabbix to communicate to the remote server host.

To enable access for from and to zabbix-agentd in both Active / Passive mode:

#firewall settings:
[root@centos9 rpm-gpg]# firewall-cmd –permanent –add-port=10050/tcp
[root@centos9 rpm-gpg]# firewall-cmd –permanent –add-port=10051/tcp
[root@centos9 rpm-gpg]# firewall-cmd –reload
[root@centos9 rpm-gpg]# systemctl restart firewalld
[root@centos9 rpm-gpg]# systemctl restart zabbix-agent


If the machine is in a local DMZ-ed network with tightly configured firewall router in front of it, you could completely disable firewalld.

[root@centos9 rpm-gpg]# systemctl stop firewalld
[root@centos9 rpm-gpg]# systemctl disable firewalld
Removed /etc/systemd/system/multi-user.target.wants/firewalld.service.
Removed /etc/systemd/system/dbus-org.fedoraproject.FirewallD1.service.


Next login to Zabbix-server web interface with administrator and from Configuration -> Hosts -> Create the centos9 hostname and add it a template of choice. The data from the added machine should shortly appear after another zabbix restart:

[root@centos9 rpm-gpg]#  systemctl restart zabbix-agentd


8. Tracking other oddities with the zabbix-agent through log

If anyways still zabbix have issues connectin to remote node, increase the debug log level section
 

[root@centos9 rpm-gpg]# vim /etc/zabbix/zabbix_agentd.conf
DebugLevel 5

### Option: DebugLevel
#       Specifies debug level:
#       0 – basic information about starting and stopping of Zabbix processes
#       1 – critical information
#       2 – error information
#       3 – warnings
#       4 – for debugging (produces lots of information)
#       5 – extended debugging (produces even more information)
#
# Mandatory: no
# Range: 0-5
# Default:
# DebugLevel=3

[root@centos9 rpm-gpg]# systemctl restart zabbix-agent

Keep in mind that debugging will be too verbose, so once you make the machine being seen in zabbix, don't forget to comment out the line and restart agent to turn it off.

9. Testing zabbix-agent, How to send an alert to specific item key

Usually when writting userparameter scripts, data collected from scripts is being sent to zabbix serveria via Item keys.
Thus one way to check the zabbix-agent -> zabbix server data send works fine is to send some simultaneous data via a key
Once zabbix-agent is configured on the machine 

In this case we will use something like ApplicationSupport-Item as an item.
 

[root@centos9 rpm-gpg]# /usr/bin/zabbix_sender -c "/etc/zabbix/zabbix_agentd.conf" -k "ApplicationSupport-Item" -o "here is the message"

Assuming you have created the newly prepared zabbix-agent host into Zabbix Server, you should be shortly able to see the data come in Latest data.

Install and enable Sysstats IO / DIsk / CPU / Network monitoring console suite on Redhat 8.3, Few sar useful command examples

Tuesday, September 28th, 2021

linux-sysstat-monitoring-logo


Why to monitoring CPU, Memory, Hard Disk, Network usage etc. with sysstats tools?
 

Using system monitoring tools such as Zabbix, Nagios Monit is a good approach, however sometimes due to zabbix server interruptions you might not be able to track certain aspects of system performance on time. Thus it is always a good idea to 
Gain more insights on system peroformance from command line. Of course there is cmd tools such as iostat and top, free, vnstat that provides plenty of useful info on system performance issues or bottlenecks. However from my experience to have a better historical data that is systimized and all the time accessible from console it is a great thing to have sysstat package at place. Since many years mostly on every server I administer, I've been using sysstats to monitor what is going on servers over a short time frames and I'm quite happy with it. In current company we're using Redhats and CentOS-es and I had to install sysstats on Redhat 8.3. I've earlier done it multiple times on Debian / Ubuntu Linux and while I've faced on some .deb distributions complications of making sysstat collect statistics I've come with an article on Howto fix sysstat Cannot open /var/log/sysstat/sa no such file or directory” on Debian / Ubuntu Linux
 

Sysstat contains the following tools related to collecting I/O and CPU statistics:
iostat
Displays an overview of CPU utilization, along with I/O statistics for one or more disk drives.
mpstat
Displays more in-depth CPU statistics.
Sysstat also contains tools that collect system resource utilization data and create daily reports based on that data. These tools are:
sadc
Known as the system activity data collector, sadc collects system resource utilization information and writes it to a file.
sar
Producing reports from the files created by sadc, sar reports can be generated interactively or written to a file for more intensive analysis.

My experience with CentOS 7 and Fedora to install sysstat it was pretty straight forward, I just had to install it via yum install sysstat wait for some time and use sar (System Activity Reporter) tool to report collected system activity info stats over time.
Unfortunately it seems on RedHat 8.3 as well as on CentOS 8.XX instaling sysstats does not work out of the box.

To complete a successful installation of it on RHEL 8.3, I had to:

[root@server ~]# yum install -y sysstat


To make sysstat enabled on the system and make it run, I've enabled it in sysstat

[root@server ~]# systemctl enable sysstat


Running immediately sar command, I've faced the shitty error:


Cannot open /var/log/sysstat/sa18:
No such file or directory. Please check if data collecting is enabled”


Once installed I've waited for about 5 minutes hoping, that somehow automatically sysstat would manage it but it didn't.

To solve it, I've had to create additionally file /etc/cron.d/sysstat (weirdly RPM's post install instructions does not tell it to automatically create it)

[root@server ~]# vim /etc/cron.d/sysstat

# run system activity accounting tool every 10 minutes
0 * * * * root /usr/lib64/sa/sa1 60 59 &
# generate a daily summary of process accounting at 23:53
53 23 * * * root /usr/lib64/sa/sa2 -A &


  • /usr/local/lib/sa1 is a shell script that we can use for scheduling cron which will create daily binary log file.
  • /usr/local/lib/sa2 is a shell script will change binary log file to human-readable form.


[root@server ~]# chmod 600 /etc/cron.d/sysstat

[root@server ~]# systemctl restart sysstat


In a while if sysstat is working correctly you should get produced its data history logs inside /var/log/sa

[root@server ~]# ls -al /var/log/sa 


Note that the standard sysstat history files on Debian and other modern .deb based distros such as Debian 10 (in  y.2021) is stored under /var/log/sysstat

Here is few useful uses of sysstat cmds


1. Check with sysstat machine history SWAP and RAM Memory use


To lets say check last 10 minutes SWAP memory use:

[hipo@server yum.repos.d] $ sar -W  |last -n 10
 

Linux 4.18.0-240.el8.x86_64 (server)       09/28/2021      _x86_64_        (8 CPU)

12:00:00 AM  pswpin/s pswpout/s
12:00:01 AM      0.00      0.00
12:01:01 AM      0.00      0.00
12:02:01 AM      0.00      0.00
12:03:01 AM      0.00      0.00
12:04:01 AM      0.00      0.00
12:05:01 AM      0.00      0.00
12:06:01 AM      0.00      0.00

[root@ccnrlb01 ~]# sar -r | tail -n 10
14:00:01        93008   1788832     95.06         0   1357700    725740      9.02    795168    683484        32
14:10:01        78756   1803084     95.81         0   1358780    725740      9.02    827660    652248        16
14:20:01        92844   1788996     95.07         0   1344332    725740      9.02    813912    651620        28
14:30:01        92408   1789432     95.09         0   1344612    725740      9.02    816392    649544        24
14:40:01        91740   1790100     95.12         0   1344876    725740      9.02    816948    649436        36
14:50:01        91688   1790152     95.13         0   1345144    725740      9.02    817136    649448        36
15:00:02        91544   1790296     95.14         0   1345448    725740      9.02    817472    649448        36
15:10:01        91108   1790732     95.16         0   1345724    725740      9.02    817732    649340        36
15:20:01        90844   1790996     95.17         0   1346000    725740      9.02    818016    649332        28
Average:        93473   1788367     95.03         0   1369583    725074      9.02    800965    671266        29


2. Check system load? Are my processes waiting too long to run on the CPU?

[root@server ~ ]# sar -q |head -n 10
Linux 4.18.0-240.el8.x86_64 (server)       09/28/2021      _x86_64_        (8 CPU)

12:00:00 AM   runq-sz  plist-sz   ldavg-1   ldavg-5  ldavg-15   blocked
12:00:01 AM         0       272      0.00      0.02      0.00         0
12:01:01 AM         1       271      0.00      0.02      0.00         0
12:02:01 AM         0       268      0.00      0.01      0.00         0
12:03:01 AM         0       268      0.00      0.00      0.00         0
12:04:01 AM         1       271      0.00      0.00      0.00         0
12:05:01 AM         1       271      0.00      0.00      0.00         0
12:06:01 AM         1       265      0.00      0.00      0.00         0


3. Show various CPU statistics per CPU use
 

On a multiprocessor, multi core server sometimes for scripting it is useful to fetch processor per use historic data, 
this can be attained with:


[hipo@server ~ ] $ mpstat -P ALL
Linux 4.18.0-240.el8.x86_64 (server)       09/28/2021      _x86_64_        (8 CPU)

06:08:38 PM  CPU    %usr   %nice    %sys %iowait    %irq   %soft  %steal  %guest  %gnice   %idle
06:08:38 PM  all    0.17    0.02    0.25    0.00    0.05    0.02    0.00    0.00    0.00   99.49
06:08:38 PM    0    0.22    0.02    0.28    0.00    0.06    0.03    0.00    0.00    0.00   99.39
06:08:38 PM    1    0.28    0.02    0.36    0.00    0.08    0.02    0.00    0.00    0.00   99.23
06:08:38 PM    2    0.27    0.02    0.31    0.00    0.06    0.01    0.00    0.00    0.00   99.33
06:08:38 PM    3    0.15    0.02    0.22    0.00    0.03    0.01    0.00    0.00    0.00   99.57
06:08:38 PM    4    0.13    0.02    0.20    0.01    0.03    0.01    0.00    0.00    0.00   99.60
06:08:38 PM    5    0.14    0.02    0.27    0.00    0.04    0.06    0.01    0.00    0.00   99.47
06:08:38 PM    6    0.10    0.02    0.17    0.00    0.04    0.02    0.00    0.00    0.00   99.65
06:08:38 PM    7    0.09    0.02    0.15    0.00    0.02    0.01    0.00    0.00    0.00   99.70


sar-sysstat-cpu-statistics-screenshot

Monitor processes and threads currently being managed by the Linux kernel.

[hipo@server ~ ] $ pidstat

pidstat-various-random-process-statistics

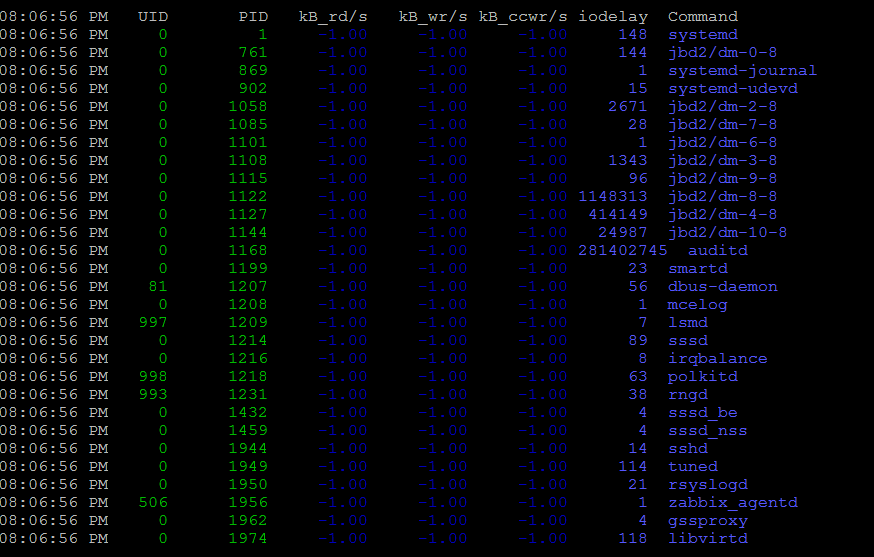
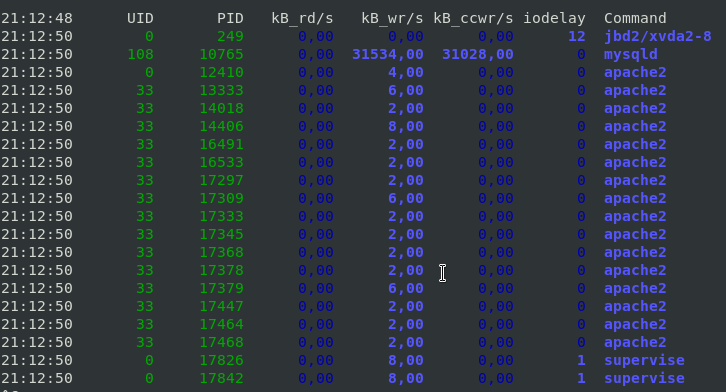
[hipo@server ~ ] $ pidstat -d 2


pidstat-show-processes-with-most-io-activities-linux-screenshot

This report tells us that there is few processes with heave I/O use Filesystem system journalling daemon jbd2, apache, mysqld and supervise, in 3rd column you see their respective PID IDs.

To show threads used inside a process (like if you press SHIFT + H) inside Linux top command:

[hipo@server ~ ] $ pidstat -t -p 10765 1 3

Linux 4.19.0-14-amd64 (server)     28.09.2021     _x86_64_    (10 CPU)

21:41:22      UID      TGID       TID    %usr %system  %guest   %wait    %CPU   CPU  Command
21:41:23      108     10765         –    1,98    0,99    0,00    0,00    2,97     1  mysqld
21:41:23      108         –     10765    0,00    0,00    0,00    0,00    0,00     1  |__mysqld
21:41:23      108         –     10768    0,00    0,00    0,00    0,00    0,00     0  |__mysqld
21:41:23      108         –     10771    0,00    0,00    0,00    0,00    0,00     5  |__mysqld
21:41:23      108         –     10784    0,00    0,00    0,00    0,00    0,00     7  |__mysqld
21:41:23      108         –     10785    0,00    0,00    0,00    0,00    0,00     6  |__mysqld
21:41:23      108         –     10786    0,00    0,00    0,00    0,00    0,00     2  |__mysqld

10765 – is the Process ID whose threads you would like to list

With pidstat, you can further monitor processes for memory leaks with:

[hipo@server ~ ] $ pidstat -r 2


4. Report paging statistics for some old period


[root@server ~ ]# sar -B -f /var/log/sa/sa27 |head -n 10
Linux 4.18.0-240.el8.x86_64 (server)       09/27/2021      _x86_64_        (8 CPU)

15:42:26     LINUX RESTART      (8 CPU)

15:55:30     LINUX RESTART      (8 CPU)

04:00:01 PM  pgpgin/s pgpgout/s   fault/s  majflt/s  pgfree/s pgscank/s pgscand/s pgsteal/s    %vmeff
04:01:01 PM      0.00     14.47    629.17      0.00    502.53      0.00      0.00      0.00      0.00
04:02:01 PM      0.00     13.07    553.75      0.00    419.98      0.00      0.00      0.00      0.00
04:03:01 PM      0.00     11.67    548.13      0.00    411.80      0.00      0.00      0.00      0.00


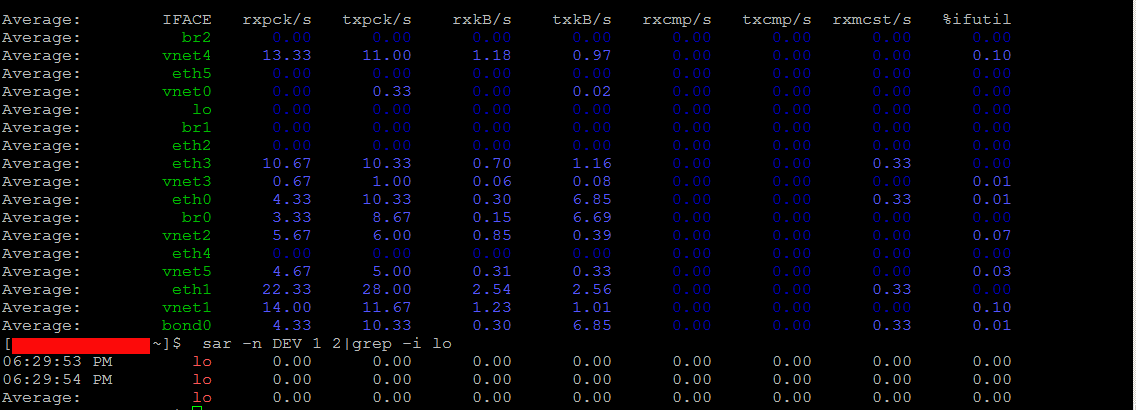
5.  Monitor Received RX and Transmitted TX network traffic perl Network interface real time
 

To print out Received and Send traffic per network interface 4 times in a raw

sar-sysstats-network-traffic-statistics-screenshot
 

[hipo@server ~ ] $ sar -n DEV 1 4


To continusly monitor all network interfaces I/O traffic

[hipo@server ~ ] $ sar -n DEV 1


To only monitor a certain network interface lets say loopback interface (127.0.0.1) received / transmitted bytes

[hipo@server yum.repos.d] $  sar -n DEV 1 2|grep -i lo
06:29:53 PM        lo      0.00      0.00      0.00      0.00      0.00      0.00      0.00      0.00
06:29:54 PM        lo      0.00      0.00      0.00      0.00      0.00      0.00      0.00      0.00
Average:           lo      0.00      0.00      0.00      0.00      0.00      0.00      0.00      0.00


6. Monitor block devices use
 

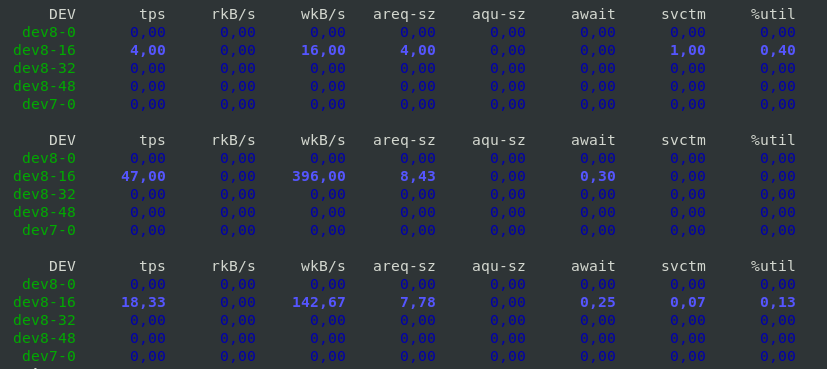
To check block devices use 3 times in a raw
 

[hipo@server yum.repos.d] $ sar -d 1 3


sar-sysstats-blockdevice-statistics-screenshot
 

7. Output server monitoring data in CSV database structured format


For preparing a nice graphs with Excel from CSV strucuted file format, you can dump the collected data as so:

 [root@server yum.repos.d]# sadf -d /var/log/sa/sa27 — -n DEV | grep -v lo|head -n 10
server-name-fqdn;-1;2021-09-27 13:42:26 UTC;LINUX-RESTART    (8 CPU)
# hostname;interval;timestamp;IFACE;rxpck/s;txpck/s;rxkB/s;txkB/s;rxcmp/s;txcmp/s;rxmcst/s;%ifutil
server-name-fqdn;-1;2021-09-27 13:55:30 UTC;LINUX-RESTART    (8 CPU)
# hostname;interval;timestamp;IFACE;rxpck/s;txpck/s;rxkB/s;txkB/s;rxcmp/s;txcmp/s;rxmcst/s;%ifutil
server-name-fqdn;60;2021-09-27 14:01:01 UTC;eth1;19.42;16.12;1.94;1.68;0.00;0.00;0.00;0.00
server-name-fqdn;60;2021-09-27 14:01:01 UTC;eth0;7.18;9.65;0.55;0.78;0.00;0.00;0.00;0.00
server-name-fqdn;60;2021-09-27 14:01:01 UTC;eth2;5.65;5.13;0.42;0.39;0.00;0.00;0.00;0.00
server-name-fqdn;60;2021-09-27 14:02:01 UTC;eth1;18.90;15.55;1.89;1.60;0.00;0.00;0.00;0.00
server-name-fqdn;60;2021-09-27 14:02:01 UTC;eth0;7.15;9.63;0.55;0.74;0.00;0.00;0.00;0.00
server-name-fqdn;60;2021-09-27 14:02:01 UTC;eth2;5.67;5.15;0.42;0.39;0.00;0.00;0.00;0.00

To graph the output data you can use Excel / LibreOffice's Excel equivalent Calc or if you need to dump a CSV sar output and generate it on the fly from a script  use gnuplot 


What we've learned?


How to install and enable on cron sysstats on Redhat and CentOS 8 Linux ? 
How to continuously monitor CPU / Disk and Network, block devices, paging use and processes and threads used by the kernel per process ?  
As well as how to export previously collected data to CSV to import to database or for later use inrder to generate graphic presentation of data.
Cheers ! 🙂