Posts Tagged ‘cpu load’

Monitor General Server / Desktop system health in console on Linux and FreeBSD

Tuesday, October 4th, 2011

slurm-output-monitoring-networking
saidar
is a text based ncurses program to display live statistics about general system health.

It displays in one refreshable screen (similar to top) statistics about server state of:
CPU, Load, Memory, Swap, Network, I/O disk operations
Besides that saidar supports a ncurses console colors, which makes it more funny to look at.
Saidar extracts the statistics for system state based on libgstrap cross platform statistics library about pc system health.

On Debian, Ubuntu, Fedora, CentOS Linuxes saider is available for install straight from distribution repositories.
On Debian and Ubuntu saidar is installed with cmd:

debian:~# apt-get install saidar
...

On CentOS and Fedora saidar is bundled as a part of statgrab-tools rpm package.
Installing it on 64 bit CentOS with yum is with command:

[root@centos ~]# yum install statgrab-tools.x86_64

Saidar is also available on FreeBSD as a part of the /usr/ports/devel/libgstrab, hence to use on my FreeBSD I had to install the libgstrab port:

freebsd# cd /usr/ports/devel/libstatgrab
freebsd# make install clean

Here is saidar running on my Desktop Debian on Thinkpad in color output:

debian:~# saidar -c

Saidar Linux General statistics Screenshot

I've seen many people, who use various shell scripts to output system monitoring information, this scripts however are often written to just run without efficiency in mind and they put some let's say 1% extra load on the system CPU. This is not the case with saidar which is written in C and hence the program is optimized well for what it does.

Update: Next to saidar I recommend you check out Slurm (Real Time Network Interface Monitor) it can visualizes network interface traffic using ascii graph such as on top of the article. On Debian and Ubuntu Slurm is available and easily installable via simple:
 

apt-get install –yes slurm


Monitoring CPU load and memory usage on Mac OS X command line (Terminal)

Thursday, July 3rd, 2014

macosx-server-screenshot-server-assistant-apple-tool
You might be stunned to find out Mac OS X has a server variant called Mac OS X server. For the usual admin having to administer a Mac OS X based server is something rarely to do, however it might happen some day, and besides that nowadays Mac OS X has about 10% percentage share of PC desktop and laptops used on the Internet (data collected from w3cschools log files). Thus cause it is among popular OSes, it very possible sooner or later as a sysadmin you will have to troubleshoot issues on at least Mac OS X notebook. Mac has plenty of instruments to debug OS issues as it is UNIX (BSD) based

Mac OS X has already a GUI tool called Activity Monitor (existing in Mac OS 10.3 onwards) in earlier verions, there was tool called Process Viewer and CPU Monitor.

To start Activity Monitor open Finder and launch it via:

Applications -> Utilities -> Activity Monitor

As a Linux guy, I like to use command line and there Mac OS X is equipped with a good arsenal of tools to check CPU load and Memory. Mac OS X comes with sar – (system activity reporter), top (process monitor) and vm_stat (virtual memory statistics) command – these ones are equivalent of Linux's sar (from sysstats package), top and Linux vmstat (report virtual memory statistics).

1. Check out Mac OS X HDD Input / Output statistics
 

$ sar -d -f ~/output.sar

20:43:18   device    r+w/s    blks/s
New Disk: [disk0] IODeviceTree:/PCI0@0/RP06@1C,5/SSD0@0/PRT0@0/PMP@0/@0:0
New Disk: [disk1] IOService:/IOResources/IOHDIXController/IOHDIXHDDriveOutKernel@1/IODiskImageBlockStorageDeviceOutKernel/IOBlockStorageDriver/Apple UDIF, только для чтения, сжатый (zlib)
New Disk: [disk2] IOService:/IOResources/IOHDIXController/IOHDIXHDDriveOutKernel@3/IODiskImageBlockStorageDeviceOutKernel/IOBlockStorageDriver/Apple UDIF, только для чтения, сжатый (bzip2)
New Disk: [disk3] IOService:/IOResources/IOHDIXController/IOHDIXHDDriveOutKernel@4/IODiskImageBlockStorageDeviceOutKernel/IOBlockStorageDriver/Apple UDIF, только для чтения, сжатый (bzip2)
New Disk: [disk4] IOService:/IOResources/IOHDIXController/IOHDIXHDDriveOutKernel@6/IODiskImageBlockStorageDeviceOutKernel/IOBlockStorageDriver/Apple UDIF, только для чтения, сжатый (zlib)
20:43:28   disk0        7        312
20:43:28   disk1        0          0
20:43:28   disk2        0          0
20:43:28   disk3        0          0
20:43:28   disk4        0          0
20:43:38   disk0       12        251
20:43:38   disk1        0          

2. Checking Mac OS X CPU Load from terminal

To check Load from Mac OS command line use:
 

$ sar -o ~/output.sar 10 10

That gathers 10 sets of metrics at 10 second intervals. You can then extract useful information from the output file (even while it's still running), this will get you cpu load on Mac OS system spitting stats every 10 seconds.


21:22:33  %usr  %nice   %sys   %idle
21:22:43    7      0      2     90
21:22:53    8      0      3     89
21:23:03   11      0      4     85
21:23:13    9      0      3     88
21:23:23    9      0      3     88
21:23:33    7      0      3     90
21:23:43   10      0      3     87
21:23:53   10      0      4     85
21:24:03   10      0      5     85
21:24:13    8      0      3     88
Average:      8      0      3     87   


3. Checking Free memory on  Mac OS X

Use this obscure one liner to free -m Linux memory command like output from Mac terminal

$ vm_stat | perl -ne '/page size of (d+)/ and $size=$1; /Pagess+([^:]+)[^d]+(d+)/ and printf("%-16s % 16.2f Min", "$1:", $2 * $size / 1048576);'
 

free: 43.38 Mi
active: 1762.00 Mi
inactive: 1676.91 Mi
speculative: 3.29 Mi
wired down: 609.38 Mi
copy-on-write: 29431.01 Mi
zero filled: 4687689.80 Mi
reactivated: 30288.86 Mi


To show inactive memory in Gigabytes every 10 seconds

$ vm_stat 10 | awk 'NR>2 {gsub("K","000");print ($1+$4)/256000}'

1.70532
1.70455
1.70389
1.6904


It is also possible to get memory statistics on Mac PC running top in non-interactive mode and grepping it from output:

$ top -l 1 | head -n 10 | grep PhysMem | sed 's/, /n /g'


PhysMem: 599M wired, 1735M active, 1712M inactive, 4046M used, 47M free.


4. Quick command to get Kernel / how many CPUs, available memory and load avarage on Mac OS X

From y. 2003 onwards of Mac OS have hostinfo(host information) command, providing admin with quick way to get System Info on Mac OS

$ hostinfo


Mach kernel version:
Darwin Kernel Version 12.5.0: Sun Sep 29 13:33:47 PDT 2013; root:xnu-2050.48.12~1/RELEASE_X86_64
Kernel configured for up to 4 processors.
2 processors are physically available.
4 processors are logically available.
Processor type: i486 (Intel 80486)
Processors active: 0 1 2 3
Primary memory available: 4.00 gigabytes
Default processor set: 98 tasks, 621 threads, 4 processors
Load average: 1.63, Mach factor: 2.54


If you need more verbose information on system hardware and resources, check out system_profiler. As the manual describes it, system_profiler(reports system hardware and software configuration.) cmd:

$ system_profiler Here is a link to output file generated by system_prifler


Boost local network performance (Increase network thoroughput) by enabling Jumbo Frames on GNU / Linux

Saturday, March 10th, 2012

Jumbo Frames boost local network performance in GNU / Linux

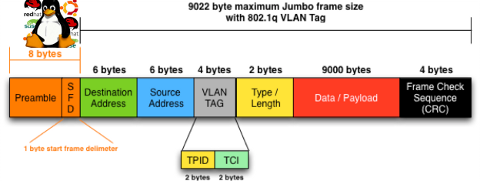
So what is Jumbo Frames? and why, when and how it can increase the network thoroughput on Linux?

Jumbo Frames are Ethernet frames with more than 1500 bytes of payload. They can carry up to 9000 bytes of payload. Many Gigabit switches and network cards supports them.
Jumbo frames is a networking standard for many educational networks like AARNET. Unfortunately most commercial ISPs doesn't support them and therefore enabling Jumbo frames will rarely increase bandwidth thoroughput for information transfers over the internet.
Hopefully in the years to come with the constant increase of bandwidths and betterment of connectivity, jumbo frames package transfers will be supported by most ISPs as well.
Jumbo frames network support is just great for is small local – home networks and company / corporation office intranets.

Thus enabling Jumbo Frame is absolutely essential for "local" ethernet networks, where large file transfers occur frequently. Such networks are networks where, there is often a Video or Audio streaming with high quality like HD quality on servers running File Sharing services like Samba, local FTP sites,Webservers etc.

One other advantage of enabling jumbo frames is reduce of general server overhead and decrease in CPU load / (CPU usage), when transferring large or enormous sized files.Therefore having jumbo frames enabled on office network routers with GNU / Linux or any other *nix OS is vital.

Jumbo Frames traffic is supported in GNU / Linux kernel since version 2.6.17+ in earlier 2.4.x it was possible through external third party kernel patches.

1. Manually increase MTU to 9000 with ifconfig to enable Jumbo frames

debian:~# /sbin/ifconfig eth0 mtu 9000

The default MTU on most GNU / Linux (if not all) is 1500, to check the default set MTU with ifconfig:

linux:~# /sbin/ifconfig eth0|grep -i mtu
UP BROADCAST MULTICAST MTU:1500 Metric:1

To take advantage of Jumbo Frames, all that has to be done is increase the default Maximum Transmission Unit from 1500 to 9000

For those who don't know MTU is the largest physical packet size that can be transferred over the network. MTU is measured by default in bytes. If a information has to be transferred over the network which exceeds the lets say 1500 MTU (bytes), it will be chopped and transferred in few packs each of 1500 size.

MTUs differ on different netework topologies. Just for info here are the few main MTUs for main network types existing today:
 

  • 16 MBit/Sec Token Ring – default MTU (17914)
  • 4 Mbits/Sec Token Ring – default MTU (4464)
  • FDDI – default MTU (4352)
  • Ethernet – def MTU (1500)
  • IEEE 802.3/802.2 standard – def MTU (1492)
  • X.25 (dial up etc.) – def MTU (576)
  • Jumbo Frames – def max MTU (9000)

Setting the MTU packet frames to 9000 to enable Jumbo Frames is done with:

linux:~# /sbin/ifconfig eth0 mtu 9000

If the command returns nothing, this most likely means now the server can communicate on eth0 with MTUs of each 9000 and therefore the network thoroughput will be better. In other case, if the network card driver or card is not a gigabit one the cmd will return error:

SIOCSIFMTU: Invalid argument

2. Enabling Jumbo Frames on Debian / Ubuntu etc. "the Debian way"

a.) Jumbo Frames on ethernet interfaces with static IP address assigned Edit /etc/network/interfaces and you should have for each of the interfaces you would like to set the Jumbo Frames, records similar to:

Raising the MTU to 9000 if for one time can be done again manually with ifconfig

debian:~# /sbin/ifconfig eth0 mtu 9000

iface eth0 inet static
address 192.168.0.5
network 192.168.0.0
gateway 192.168.0.254
netmask 255.255.255.0
mtu 9000

For each of the interfaces (eth1, eth2 etc.), add a chunk similar to one above changing the changing the IPs, Gateway and Netmask.

If the server is with two gigabit cards (eth0, eth1) supporting Jumbo frames add to /etc/network/interfaces :

iface eth0 inet static
address 192.168.0.5
network 192.168.0.0
gateway 192.168.0.254
netmask 255.255.255.0
mtu 9000

iface eth1 inet static
address 192.168.0.6
network 192.168.0.0
gateway 192.168.0.254
netmask 255.255.255.0
mtu 9000

b.) Jumbo Frames on ethernet interfaces with dynamic IP obtained via DHCP

Again in /etc/network/interfaces put:

auto eth0
iface eth0 inet dhcp
post-up /sbin/ifconfig eth0 mtu 9000

3. Setting Jumbo Frames on Fedora / CentOS / RHEL "the Redhat way"

Enabling jumbo frames on all Gigabit lan interfaces (eth0, eth1, eth2 …) in Fedora / CentOS / RHEL is done through files:
 

  • /etc/sysconfig/network-script/ifcfg-eth0
  • /etc/sysconfig/network-script/ifcfg-eth1

etc. …
append in each one at the end of the respective config:

MTU=9000

[root@fedora ~]# echo 'MTU=9000' >> /etc/sysconfig/network-scripts/ifcfg-eth


a quick way to set Maximum Transmission Unit to 9000 for all network interfaces on on Redhat based distros is by executing the following loop:

[root@centos ~]# for i in $(echo /etc/sysconfig/network-scripts/ifcfg-eth*); do \echo 'MTU=9000' >> $i
done

P.S.: Be sure that all your interfaces are supporting MTU=9000, otherwise increase while the MTU setting is set will return SIOCSIFMTU: Invalid argument err.
The above loop is to be used only, in case you have a group of identical machines with Lan Cards supporting Gigabit networks and loaded kernel drivers supporting MTU up to 9000.

Some Intel and Realtek Gigabit cards supports only a maximum MTU of 7000, 7500 etc., so if you own a card like this check what is the max MTU the card supports and set it in the lan device configuration.
If increasing the MTU is done on remote server through SSH connection, be extremely cautious as restarting the network might leave your server inaccessible.

To check if each of the server interfaces are "Gigabit ready":

[root@centos ~]# /sbin/ethtool eth0|grep -i 1000BaseT
1000baseT/Half 1000baseT/Full

If you're 100% sure there will be no troubles with enabling MTU > 1500, initiate a network reload:

[root@centos ~]# /etc/init.d/network restart
...

4. Enable Jumbo Frames on Slackware Linux

To list the ethernet devices and check they are Gigabit ones issue:

bash-4.1# lspci | grep [Ee]ther
0c:00.0 Ethernet controller: D-Link System Inc Gigabit Ethernet Adapter (rev 11)
0c:01.0 Ethernet controller: D-Link System Inc Gigabit Ethernet Adapter (rev 11)

Setting up jumbo frames on Slackware Linux has two ways; the slackware way and the "universal" Linux way:

a.) the Slackware way

On Slackware Linux, all kind of network configurations are done in /etc/rc.d/rc.inet1.conf

Usual config for eth0 and eth1 interfaces looks like so:

# Config information for eth0:
IPADDR[0]="10.10.0.1"
NETMASK[0]="255.255.255.0"
USE_DHCP[0]=""
DHCP_HOSTNAME[1]=""
# Config information for eth1:
IPADDR[1]="10.1.1.1"
NETMASK[1]="255.255.255.0"
USE_DHCP[1]=""
DHCP_HOSTNAME[1]=""

To raise the MTU to 9000, the variables MTU[0]="9000" and MTU[1]="9000" has to be included after each interface config block, e.g.:

# Config information for eth0:
IPADDR[0]="172.16.1.1"
NETMASK[0]="255.255.255.0"
USE_DHCP[0]=""
DHCP_HOSTNAME[1]=""
MTU[0]="9000"
# Config information for eth1:
IPADDR[1]="10.1.1.1"
NETMASK[1]="255.255.255.0"
USE_DHCP[1]=""
DHCP_HOSTNAME[1]=""
MTU[1]="9000"

bash-4.1# /etc/rc.d/rc.inet1 restart
...

b.) The "Universal" Linux way

This way is working on most if not all Linux distributions.
Insert in /etc/rc.local:

/sbin/ifconfig eth0 mtu 9000 up
/sbin/ifconfig eth1 mtu 9000 up

5. Check if Jumbo Frames are properly enabled

There are at least two ways to display the MTU settings for eths.

a.) Using grepping the MTU from ifconfig

linux:~# /sbin/ifconfig eth0|grep -i mtu
UP BROADCAST MULTICAST MTU:9000 Metric:1
linux:~# /sbin/ifconfig eth1|grep -i mtu
UP BROADCAST MULTICAST MTU:9000 Metric:1

b.) Using ip command from iproute2 package to get MTU

linux:~# ip route get 192.168.2.134
local 192.168.2.134 dev lo src 192.168.2.134
cache mtu 9000 advmss 1460 hoplimit 64

linux:~# ip route show dev wlan0
192.168.2.0/24 proto kernel scope link src 192.168.2.134
default via 192.168.2.1

You see MTU is now set to 9000, so the two server lans, are now able to communicate with increased network thoroughput.
Enjoy the accelerated network transfers 😉


Possible way to Improve wordpress performance with wp-config.php 4 config variables

Tuesday, March 6th, 2012

Wordpress improve performance wp-config.php logo chromium effect GIMP

Nowdays WordPress is ran by million of blogs and websites all around the net. I myself run wordpress for this blog in general wordpress behaves quite well in terms of performance. However as with time the visitors tend to increase, on frequently updated websites or blogs. As a consequence, the blog / website performance slowly starts to decrease as result of the MySQL server read / write operations creating I/O and CPU load overheads. Buying a new hardware and migrating the wordpress database is a possible solution, however for many small or middle size wordpress blogs en sites like mine this is not easy task. Getting a dedicated server or simply upgrading your home server hardware is expensive and time consuming process… In my efforts to maximize my hardware utilization and increase my blog decaying performance I've stumbled on the article Optimize WordPress performance with wp-config.php

According to the article there are 4 simple wp-config.php config directvies useful in decreasing a lot of queries to the MySQL server issued with each blog visitor.

define('WP_HOME','http://www.yourblog-or-siteurl.com');
define('WP_SITEURL','http://www.yourblog-or-siteurl.com');
define('TEMPLATEPATH', '/var/www/blog/wp-content/themes/default');
define('STYLESHEETPATH', '/var/www/blog/wp-content/themes/default');

1. WP_HOME and WP_SITEURL wp-config.php directvies

The WP_HOME and WP_SITEURL variables are used to hard-code the address of the wordpress blog or site url, so wordpress doesn't have to check everytime in the database on every user request to know it is own URL address.

2. TEMPLATEPATH and TEMPLATEPATH wp variables

This variables will surely improve performance to Wodpress blogs which doesn't implement caching. On wp install with enabled caching plugins like WordPress Super Cache, Hyper Cache or WordPress Db Cache is used, I don't know if this variables will have performance impact …

So far I have tested the vars on a couple of wordpress based installs with caching enabled and even on them it seems the pages load faster than before, but I cannot say this for sure as I did not check the site loading time in advance before hardcoding the vars.

Anyways even if the suggested variables couldn't make positive impact on performance, having the four variables in wp-config.php is a good practice for blogs or websites which are looking for extra clarity.
For multiple wordpress installations living on the same server, having defined the 4 vars in different wordpress seems like a good idea too.