Posts Tagged ‘hard disk’

How to run SSH server Mac OS X and set it to auto boot on Mac Book system start

Monday, February 5th, 2024

mac os X

How to run SSH Server on Mac OS X to administrate remotely your MAC OS to access remote MacBook Air or Mac OS 

Linux / UNIX users know it is pretty easy to run OpenSSH server on old Linux SystemV releases

it is done with cmd:

# /etc/init.d/sshd start


On newer Linux distros where systemd is the standard it is done wtih:

# systemctl start ssh.service

To enable ssh service on boot on systemd distros

# systemctl enable ssh.service


To enable SSH access on Mac OS X this is done wtih a simple command

To check the status of SSH server being on or OFF, either connect with netcat to TCP port 22, which is usually installed by default on most MAC OS-es or run:

# systemsetup -getremotelogin

To start and enable SSH service on Mac OS X run:

# systemsetup -setremotelogin on 


If you later need to turn off the SSH service

# systemsetup -setremotelogin off

Actually systemsetup command can do pretty much on MAC OS X and it is worthy to take a look at it, if you're running a MAC PC or Mac Book laptop.

systemsetup can set the current date, change time server host, set computer name (hostname) and much more.

sh-3.2# systemsetup -help

systemsetup Help Information
————————————-
Usage: systemsetup -getdate
        Display current date.

Usage: systemsetup -setdate <mm:dd:yy>
        Set current date to <mm:dd:yy>.

Usage: systemsetup -gettime
        Display current time.

Usage: systemsetup -settime <hh:mm:ss>
        Set current time to <hh:mm:ss>.

Usage: systemsetup -gettimezone
        Display current time zone.

Usage: systemsetup -settimezone <timezone>
        Set current time zone to <timezone>. Use "-listtimezones" to list time zones.

Usage: systemsetup -listtimezones
        List time zones supported by this machine.

Usage: systemsetup -getusingnetworktime
        Display whether network time is on or off.

Usage: systemsetup -setusingnetworktime <on off>
        Set using network time to either <on> or <off>.

Usage: systemsetup -getnetworktimeserver
        Display network time server.

Usage: systemsetup -setnetworktimeserver <timeserver>
        Set network time server to <timeserver>.

Usage: systemsetup -getsleep
        Display amount of idle time until computer, display and hard disk sleep.

Usage: systemsetup -setsleep <minutes>
        Set amount of idle time until computer, display and hard disk sleep to <minutes>.
        Specify "Never" or "Off" for never.

Usage: systemsetup -getcomputersleep
        Display amount of idle time until computer sleeps.

Usage: systemsetup -setcomputersleep <minutes>
        Set amount of idle time until compputer sleeps to <minutes>.
        Specify "Never" or "Off" for never.

Usage: systemsetup -getdisplaysleep
        Display amount of idle time until display sleeps.

Usage: systemsetup -setdisplaysleep <minutes>
        Set amount of idle time until display sleeps to <minutes>.
        Specify "Never" or "Off" for never.

Usage: systemsetup -getharddisksleep
        Display amount of idle time until hard disk sleeps.

Usage: systemsetup -setharddisksleep <minutes>
        Set amount of idle time until hard disk sleeps to <minutes>.
        Specify "Never" or "Off" for never.

Usage: systemsetup -getwakeonmodem
        Display whether wake on modem is on or off.

Usage: systemsetup -setwakeonmodem <on off>
        Set wake on modem to either <on> or <off>.

Usage: systemsetup -getwakeonnetworkaccess
        Display whether wake on network access is on or off.

Usage: systemsetup -setwakeonnetworkaccess <on off>
        Set wake on network access to either <on> or <off>.

Usage: systemsetup -getrestartpowerfailure
        Display whether restart on power failure is on or off.

Usage: systemsetup -setrestartpowerfailure <on off>
        Set restart on power failure to either <on> or <off>.

Usage: systemsetup -getrestartfreeze
        Display whether restart on freeze is on or off.

Usage: systemsetup -setrestartfreeze <on off>
        Set restart on freeze to either <on> or <off>.

Usage: systemsetup -getallowpowerbuttontosleepcomputer
        Display whether the power button is able to sleep the computer.

Usage: systemsetup -setallowpowerbuttontosleepcomputer <on off>
        Enable or disable whether the power button can sleep the computer.

Usage: systemsetup -getremotelogin
        Display whether remote login is on or off.

Usage: systemsetup -setremotelogin <on off>
        Set remote login to either <on> or <off>. Use "systemsetup -f -setremotelogin off" to suppress prompting when turning remote login off.

Usage: systemsetup -getremoteappleevents
        Display whether remote apple events are on or off.

Usage: systemsetup -setremoteappleevents <on off>
        Set remote apple events to either <on> or <off>.

Usage: systemsetup -getcomputername
        Display computer name.

Usage: systemsetup -setcomputername <computername>
        Set computer name to <computername>.

Usage: systemsetup -getlocalsubnetname
        Display local subnet name.

Usage: systemsetup -setlocalsubnetname <name>
        Set local subnet name to <name>.

Usage: systemsetup -getstartupdisk
        Display current startup disk.

Usage: systemsetup -setstartupdisk <disk>
        Set current startup disk to <disk>.

Usage: systemsetup -liststartupdisks
        List startup disks on this machine.

Usage: systemsetup -getwaitforstartupafterpowerfailure
        Get the number of seconds after which the computer will start up after a power failure.

Usage: systemsetup -setwaitforstartupafterpowerfailure <seconds>
        Set the number of seconds after which the computer will start up after a power failure. The <seconds> value must be a multiple of 30 seconds.

Usage: systemsetup -getdisablekeyboardwhenenclosurelockisengaged
        Get whether or not the keyboard should be disabled when the X Serve enclosure lock is engaged.

Usage: systemsetup -setdisablekeyboardwhenenclosurelockisengaged <yes no>
        Set whether or not the keyboard should be disabled when the X Serve enclosure lock is engaged.

Usage: systemsetup -version
        Display version of systemsetup tool.

Usage: systemsetup -help
        Display help.

Usage: systemsetup -printCommands
        Display commands.


Enabling SSH in Mac OS X computers can be done also from Graphical interface for the lazy ones.

enable-ssh-mac-remote-login-from-mac-OS-X-gui

Checking I/O Hard Disk (Overhead) Read / Write operations on Microsoft Windows 7 – Resource Monitor

Friday, July 26th, 2013

I mainly have to deal with Linux servers. Today however I had to check for problems Microsoft Windows 7 server. The machine looked Okay but was reading from hard drive all the time. Hence I needed to check what is the Hard disk approximate read / write speed per second. I know on lInux tracking i/o hard disk server bottlenecks is done with iostat or dstat.

However I never did that on Windows, so I had to learn it by experience. Its actually pretty easy and you don't even need to install external program to see read / write hdd speed operations. Windows 7 is bundled with a Program called Resource Manager. Running Resource Manager's easiest method is from Windows Task Manager, i.e.:

Windows 7 Task Manager processes performance tab - how to check hard drive bottleneck windows server
Press Ctrl + Alt + Del (Choose Start Task Manager) and from Task Manager click on Resource Monitor Button.
Immediately resource Monitor pops up and selecting the Disk tab priovides information on HDD Read / Write speed per sec. Using Resource Monitor, you can quickly also see which process is creating the most HDD overhead for server.

microsoft windows 7 resource monitor screenshot

windows resource monitor disk tab hard disk show read write speed win7

Though I'm not Microsoft fan, I should admit Resource Manager does a great job.


Save data from failing hard disk on Linux – Rescuing data from failing disk with bad blocks

Wednesday, April 16th, 2014

save-data-from-failing-hard-drive-data-recovery-badblocks-linux_1.jpg
Sooner or later your Linux Desktop or Linux server hard drive will start breaking up, whether you have a hardware or software RAID 1, 6 or 10 you can  and good hard disk health monitoring software you can react on time but sometimes as admins we have to take care of old servers which either have RAID 0 or missing RAID configuration and or disk firmware is unable to recognize failing blocks on time and remap them. Thus it is quite useful to have techniques to save data from failing hard disk drives with physical badblocks.

With ddrescue tool there is still hope for your Linux data though disk is full of unrecoverable I/O errors.

apt-cache show ddrescue
 

apt-cache show ddrescue|grep -i description -A 12

Description: copy data from one file or block device to another
 dd_rescue is a tool to help you to save data from crashed
 partition. Like dd, dd_rescue does copy data from one file or
 block device to another. But dd_rescue does not abort on errors
 on the input file (unless you specify a maximum error number).
 It uses two block sizes, a large (soft) block size and a small
 (hard) block size. In case of errors, the size falls back to the
 small one and is promoted again after a while without errors.
 If the copying process is interrupted by the user it is possible
 to continue at any position later. It also does not truncate
 the output file (unless asked to). It allows you to start from
 the end of a file and move backwards as well. dd_rescue does
 not provide character conversions.


To use ddrescue for saving data first thing is to shutdown the Linux host boot the system with a Rescue LiveCD like SystemRescueCD – (Linux system rescue disk), Knoppix (Most famous bootable LiveCD / LiveDVD), Ubuntu Rescue Remix or BackTrack LiveCD – (A security centered "hackers" distro which can be used also for forensics and data recovery), then mount the failing disk (I assume disk is still mountable :). Note that it is very important to mount the disk as read only, because any write operation on hard drive increases chance that it completely becomes unusable before saving your data!

To make backup of your whole hard disk data to secondary mounted disk into /mnt/second_disk

# mkdir /mnt/second_disk/rescue
# mount /dev/sda2 /mnt/second_disk/rescue
# dd_rescue -d -r 10 /dev/sda1 /mnt/second_disk/rescue/backup.img
# mount -o loop /mnt/second_disk/rescue/backup.img

In above example change /dev/sda2 to whatever your hard drive device is named.

Whether you have already an identical secondary drive attached to the Linux host and you would like to copy whole failing Linux partition (/dev/sda) to the identical drive (/dev/sdb) issue:

ddrescue -d -f -r3 /dev/sda /dev/sdb /media/PNY_usb/rescue.logfile

If you got just a few unreadable files and you would like to recover only them then run ddrescue just on the damaged files:

ddrescue -d –R -r 100 /damaged/disk/some_dir/damaged_file /mnt/secondary_disk/some_dir/recoveredfile

-d instructs to use direct I/O
-R retrims the error area on each retry
-r 100 sets the retry limit to 100 (tries to read data 100 times before resign)

Of course this is not always working as on some HDDs recovery is impossible due to hard physical damages, if above command can't recover a file in 10 attempts it is very likely that it never succeeds …

A small note to make here is that there is another tool dd_rescue (make sure you don't confuse them) – which is also for recovery but GNU ddrescue performs better with recovery.
How ddrescue works is it keeps track of the bad sectors, and go back and try to do a slow read of that data in order to read them.
By the way BSD users would happy to know there is ddrescue port already, so data recovery on BSDs *NIX filesystems if you're a Windows user you can use ddrescue to recover data too via Cygwin.
Of course final data recovery is also very much into God's hands so before launching ddrescue, don't forget to say a prayer 🙂

Best Windows tools to Test (Benchmark) Hard Drives, SSD Drives and RAID Storage Controllers

Wednesday, April 23rd, 2014

atto-windows-hard-disk-benchmark-freeware-tool-screenshot-check-hard-disk-speed-windows
Disk Benchmarking is very useful for people involved in Graphic Design, 3D modelling, system admins  and anyone willing to squeeze maximum of his PC hardware.

If you want to do some benchmarking on newly built Windows server targetting Hard Disk performance, just bought a new hard SSD (Solid State Drives) and you want to test how well Hard Drive I/O operations behave or you want to see a regular HDD benchmarking of group of MS Windows PCs and plan hardware optiomization, check out ATTO Disk Benchmark.

So why exactly ATTO Benchmark? – Cause it is one of the best Windows Free Benchmark tools on the internet.

ATTO is a widely-accepted Disk Benchmark freeware utility to help measure storage system performance. ATTO though being freeware is among top tools utilized in industry. It is very useful in comparing different Hard Disk vendors speed, measure Windows storage systems performance with various transfer sizes and test lengths for reads and writes.

ATTO Disk Benchmark is used by manufacturers of Hardware RAID controllers, its precious tool to test Windows storage controllers, host bus adapters (HBAs).

Here is ATTO Benchmark tool specifications (quote from their webstie):
 

  • Transfer sizes from 512KB to 8MB
  • Transfer lengths from 64KB to 2GB
  • Support for overlapped I/O
  • Supports a variety of queue depths
  • I/O comparisons with various test patterns
  • Timed mode allows continuous testing
  • Non-destructive performance measurement on formatted drives
  • Transfer sizes from 512KB to 8MB
  • Transfer lengths from 64KB to 2GB
  • Support for overlapped I/O
  • Supports a variety of queue depths
  • I/O comparisons with various test patterns
  • Timed mode allows continuous testing
  • Non-destructive performance measurement on formatted drives
  • – See more at: http://www.attotech.com/disk-benchmark/#sthash.rRlgSTOE.dpuf

Here is mirrored latest version of ATTO Disk for Download. Once you get your HDD statistics you will probably want to compare to other people results. On  TomsHardware's world famous Hardware geek site there are plenty of Hard Drives performance Charts

Of course there are other GUI alternatives to ATTO Benchmark one historically famous is NBench

NBench

nbench_benchmark_windows_hard-drive-cpu-and-memory

Nbench is nice little benchmarking program for Windows NT. Nbench reports the following components of performance:

CPU speed: integer and floating operations/sec
L1 and L2 cache speeds: MB/sec
main memory speed: MB/sec
disk read and write speeds: MB/sec

SMP systems and multi-tasking OS efficiency can be tested using up to 20 separate threads of execution.

For Console Geeks or Windows server admins there are also some ports of famous *NIX Hard Disk Benchmarking tools:

NTiogen

NTiogen benchmark was written by Symbios Logic, It's Windows NT port of their popular UNIX benchmark IOGEN. NTIOGEN is the parent processes that spawns the specified number of IOGEN processes that actually do the I/O.
The program will display as output the number of processes, the average response time, the number of I/O operations per second, and the number of KBytes per second. You can download mirror copy of Ntiogen here


There are plenty of other GUI and Console HDD Benchmarking Win Tools, i.e.:

IOMeter (ex-developed by Intel and now abandoned available as open source available on SourceForge)

iometer-benchmark-disk-storage-speed-windows
 

Bench32 – Comprehensive benchmark that measures overall system performance under Windows NT or Windows 95, now obsolete not developed anymore abandoned by producer company.

ThreadMark32 – capable of bench (ex developed and supported by ADAPTEC) but also already unsupported

IOZone – filesystem benchmark tool. The benchmark generates and measures a variety of file operations. Iozone has been ported to many machines and runs under many operating systems.
 

N! B! Important note to make here is above suggested tools will provide you more realistic results than the proprietary vendor tools shipped by your hardware vendor. Using proprietary software produced by a single vendor makes it impossible to analyze and compare different hardwares, above HDD benchmarking tools are for "open systems", e.g. nomatter what the hardware producer is produced results can be checked against each other.
Another thing to consider is even though if you use any of above tools to test and compare two storage devices still results will be partially imaginary, its always best to conduct tests in Real Working Application Environments. If you're planning to launch a new services structure always test it first and don't rely on preliminary returned soft benchmarks.

if you know some other useful benchmarking software i'm missing please share.

Linux: basic system CPU, Disk and Network resource monitoring via phpsysinfo lightweight script

Wednesday, June 18th, 2014

phpsysinfo-logo-simple-way-to-web-monitor-windows-linux-server-cpu-disk-network-resources

There are plenty of GNU / Linux softwares to monitor server performance (hard disk space, network and CPU load) and general hardware health both text based for SSH console) and from web.

Just to name a few for console precious tools, such are:

And for web based Linux / Windows server monitoring my favourite tools are:

phpsysinfo is yet another web based Linux monitoring software for small companies or home router use it is perfect for people who don't want to spend time learning how to configure complicated and robust multiple server monitoring software like Nagios or Icanga.

phpsysinfo is quick and dirty way to monitor system uptime, network, disk and memory usage, get information on CPU model, attached IDEs, SCSI devices and PCIs from the web and is perfect for Linux servers already running Apache and PHP.

1. Installing PHPSysInfo on Debian, Ubuntu and deb derivative Linux-es

PHPSysInfo is very convenient and could be prefered instead of above tools for the reason it is available by default in Debian and Ubuntu package repositories and installable via apt-get and it doesn't require any further configuration, to roll it you install you place a config and you forget it.
 

 # apt-cache show phpsysinfo |grep -i desc -A 2

Description: PHP based host information
 phpSysInfo is a PHP script that displays information about the
 host being accessed.


Installation is a piece of cake:

# apt-get install --yes phpsysinfo

Add phpsysinfo directives to /etc/apache2/conf.d/phpsysinfo.conf to make it accessible via default set Apache vhost domain under /phpsysinfo

Paste in root console:
 

cat > /etc/apache2/conf.d/phpsysinfo.conf <<-EOF
Alias /phpsysinfo /usr/share/phpsysinfo
<Location /phpsysinfo>
 Options None
 Order deny,allow
 Deny from all
 #Allow from localhost
 #Allow from 192.168.56.2
 Allow from all
</Location>
EOF


Above config will allow access to /phpsysinfo from any IP on the Internet, this could be a security hole, thus it is always better to either protect it with access .htaccess password login or allow it only from certain IPs, from which you will access it with something like:

Allow from 192.168.2.100

Then restart Apache server:

# /etc/init.d/apache2 restart


To access phpsysinfo monitoring gathered statistics, access it in a browser http://defaultdomain.com/phpsysinfo/

phpsysinfo_on_debian_ubuntu_linux-screenshot-quick-and-dirty-web-monitoring-for-windows-and-linux-os

2. Installing PHPSysinfo on CentOS, Fedora and RHEL Linux
 

Download and untar

# cd /var/www/html
# wget https://github.com/phpsysinfo/phpsysinfo/archive/v3.1.13.tar.gz
# tar -zxvf phpsysinfo-3.1.13.tar.gz
# ln -sf phpsysinfo-3.1.13 phpsysinfo
# mv phpsysinfo.ini.new phpsysinfo.ini


Install php php-xml and php-mbstring RPM packages
 

yum -y install php php-xml php-mbstring
...

Start Apache web service

[root@ephraim html]# /etc/init.d/httpd restart

[root@ephraim html]# ps ax |grep -i http
 8816 ?        Ss     0:00 /usr/sbin/httpd
 8819 ?        S      0:00 /usr/sbin/httpd

phpsysinfo-install-on-centos-rhel-fedora-linux-simple-monitoring

As PhpSysInfo is written in PHP it is also possible to install phpsysinfo on Windows.

phpsysinfo is not the only available simple monitoring server performance remotely tool, if you're looking for a little bit extended information and a better visualization interface alternative to phpsysinfo take a look at linux-dash.

In context of web monitoring other 2 web PHP script tools useful in remote server monitoring are:

OpenStatus – A simple and effective resource and status monitoring script for multiple servers.
LookingGlass – User-friendly PHP Looking Glass (Web interface to use Host (Nslookup), Ping, Mtr – Matt Traceroute)

Make daily Linux MySQL database backups with shell script

Thursday, May 23rd, 2013

Creating database backup with MySQL with mysqlbackupper and mysqlback shell scripts easy create mysql backups

Some time ago, I've written a tiny shell script which does dumps of Complete (SQL Script) MySQL databases. There are plenty of ways to backup MySQL database and plenty of scripts on the net but I like doing it my own way. I have few backup scripts. I prefer script database over keeping binary logs, or using some un-traditional backup methods like backing all binary data in /var/lib/mysql.

One was intended to backup with mysqldump whole database and later upload to a central server running tsh (shell). Using tsh maybe not the best method to upload, but the script can easily be modified to use ssh passwordless authentication as a method to upload.

I'm not a pro shell scripter, but MySQLBackupper script can be used as useful for learning some simple bash  shell scripting.

To use the script as intended you will have to build tsh from source. Tsh is in very early development stage (ver 0.2) but as far as I tested it before some years it does great what it is intended for. You can  MySQLBackupper.sh script from here.
Earlier, I used MysqlBackupper.sh to upload all SQL dumps to /backups directory on central backup storage server, thus I had written secondary script to classify uploaded backups based on backup archive name. Script used is mysqldumps-classify.sh and can be viewed here. Though this way of making backups, needs a bit of custom work for managing backups up to 10 / 20 servers it worked well.

I have written also another mysqlbackup script which is much more simplistic and only dumps with mysqldump and stores copies on hard disk in tar.gz archive. You can download my other simple mysqkbackup.sh here.

Only inconvenient thing about above scripts is they dump all SQL databases. Hence whether necessary to get content for single database from (complete) All database SQL (script backup), I use SED (stream editor) one liner script.

It is interesting to hear how others prepare their MySQL db backups.

Preventive measures against hard disk failures with smard / Installing smartmontools on Linux

Friday, March 15th, 2013

Many admins might not know about smartmontools Linux package. It provides two useful tools  smartctl and smard which use (Self Monitoring and Reporting Technology system) often abreviated as S.M.A.R.T.. SMART support is nowdays available across any modern ATA, SATA and SCSI hard disks. smartontools package is installable via default package repositories on virtually all different Linux distributions. Having smartmontools installed on all critical productive server is a must for the reason it serves as early notification system in case if hard disk is on the down-verge of break-up (i.e. physical media of hard disk storage starts getting damaged). Through the last 14 years I worked as Linux sysadmin. I've used smartmontools on hundreds of servers and on many times it save companies hundreds of dollars by simply reporting a system hdd is dying and by replacing the server or hard disk with identifically configured ones. smartmontools supports monitoring of single  hard disks as well as ones configured on a hardware level to work in some RAID array. As of time of writing you can check list of smartmontools supported hardware RAID-Controllers here.

1. Installing smartmontools

a) To install smartmontools on Debian and Ubuntu and other .deb based servers:

debian:~# apt-get install --yes smartmontools
.....

b) On CentOS, Fedora,RHEL and other RPM based  install with:

[root@centos ~]# yum --yes install smartmontools
.....

2. Configuring and Enabling smartd hard disk health monitoring

a) on Debian and derivatives

Edit /etc/default/smartmontools:

debian:~# vim /etc/default/smartmontools

By default file looks smth. like;


# Defaults for smartmontools initscript (/etc/init.d/smartmontools)
# This is a POSIX shell fragment

# List of devices you want to explicitly enable S.M.A.R.T. for
# Not needed (and not recommended) if the device is monitored by smartd
#enable_smart="/dev/hda /dev/hdb"
#enable_smart="/dev/hda"
# uncomment to start smartd on system startup
#start_smartd=yes

# uncomment to pass additional options to smartd on startup
#smartd_opts="–interval=1800"

Config file should look something like;


# Defaults for smartmontools initscript (/etc/init.d/smartmontools)
# This is a POSIX shell fragment

# List of devices you want to explicitly enable S.M.A.R.T. for
# Not needed (and not recommended) if the device is monitored by smartd
#enable_smart="/dev/hda /dev/hdb"
enable_smart="/dev/sda"
# uncomment to start smartd on system startup
start_smartd=yes

# uncomment to pass additional options to smartd on startup
#smartd_opts="–interval=1800"


b) on CentOS, RHEL, Fedora  for smartd options

By default on RPM based distros there is no need for special configuration. However for some custom cases edit /etc/sysconfig/smartmontools and /etc/smartd.conf

c) Enabling smartmontools

[root@centos default]# /etc/init.d/smartd start
Starting smartd:           [  OK  ]

3. Checking hard disk failure status with smartctl

Checking whether a SMART hard disk consistency check Passes is done simplest with:

debian:~# /usr/sbin/smartctl -H /dev/sda

smartctl 5.40 2010-07-12 r3124 [x86_64-unknown-linux-gnu] (local build)
Copyright (C) 2002-10 by Bruce Allen, http://smartmontools.sourceforge.net

SMART Health Status: OK


debian:~# /usr/sbin/smartctl -i /dev/sda1

smartctl version 5.38 [i686-redhat-linux-gnu] Copyright (C) 2002-8 Bruce Allen
Home page is http://smartmontools.sourceforge.net/

=== START OF INFORMATION SECTION ===
Model Family:     Seagate Barracuda 7200.7 and 7200.7 Plus family
Device Model:     ST340014AS
Serial Number:    4MQ0LV3B
Firmware Version: 3.43
User Capacity:    40,020,664,320 bytes
Device is:        In smartctl database [for details use: -P show]
ATA Version is:   6
ATA Standard is:  ATA/ATAPI-6 T13 1410D revision 2
Local Time is:    Fri Mar 15 15:27:12 2013 EET
SMART support is: Available – device has SMART capability.
SMART support is: Enabled

To print as much information as possible for hard disk health status;


[root@centos default]# /usr/sbin/smartctl -a /dev/sda1

smartctl version 5.38 [i686-redhat-linux-gnu] Copyright (C) 2002-8 Bruce Allen
Home page is http://smartmontools.sourceforge.net/

=== START OF INFORMATION SECTION ===
Model Family:     Seagate Barracuda 7200.7 and 7200.7 Plus family
Device Model:     ST340014AS
Serial Number:    4MQ0LV3B
Firmware Version: 3.43
User Capacity:    40,020,664,320 bytes
Device is:        In smartctl database [for details use: -P show]
ATA Version is:   6
ATA Standard is:  ATA/ATAPI-6 T13 1410D revision 2
Local Time is:    Fri Mar 15 15:14:53 2013 EET
SMART support is: Available – device has SMART capability.
SMART support is: Enabled

=== START OF READ SMART DATA SECTION ===
SMART overall-health self-assessment test result: PASSED

General SMART Values:
Offline data collection status:  (0x82)    Offline data collection activity
                    was completed without error.
                    Auto Offline Data Collection: Enabled.
Self-test execution status:      (   0)    The previous self-test routine completed
                    without error or no self-test has ever
                    been run.
Total time to complete Offline
data collection:          ( 423) seconds.
Offline data collection
capabilities:              (0x5b) SMART execute Offline immediate.
                    Auto Offline data collection on/off support.
                    Suspend Offline collection upon new
                    command.
                    Offline surface scan supported.
                    Self-test supported.
                    No Conveyance Self-test supported.
                    Selective Self-test supported.
SMART capabilities:            (0x0003)    Saves SMART data before entering
                    power-saving mode.
                    Supports SMART auto save timer.
Error logging capability:        (0x01)    Error logging supported.
                    General Purpose Logging supported.
Short self-test routine
recommended polling time:      (   1) minutes.
Extended self-test routine
recommended polling time:      (  19) minutes.

SMART Attributes Data Structure revision number: 10
Vendor Specific SMART Attributes with Thresholds:
ID# ATTRIBUTE_NAME          FLAG     VALUE WORST THRESH TYPE      UPDATED  WHEN_FAILED RAW_VALUE
  1 Raw_Read_Error_Rate     0x000f   052   045   006    Pre-fail  Always       –       172137473
  3 Spin_Up_Time            0x0002   098   098   000    Old_age   Always       –       0
  4 Start_Stop_Count        0x0033   096   096   020    Pre-fail  Always       –       4198
  5 Reallocated_Sector_Ct   0x0033   100   100   036    Pre-fail  Always       –       0
  7 Seek_Error_Rate         0x000f   090   060   030    Pre-fail  Always       –       945095084
  9 Power_On_Hours          0x0032   075   075   000    Old_age   Always       –       22769
 10 Spin_Retry_Count        0x0013   100   100   097    Pre-fail  Always       –       0
 12 Power_Cycle_Count       0x0033   099   099   020    Pre-fail  Always       –       1084
194 Temperature_Celsius     0x0022   038   046   000    Old_age   Always       –       38 (0 15 0 0)
195 Hardware_ECC_Recovered  0x001a   052   045   000    Old_age   Always       –       172137473
197 Current_Pending_Sector  0x0012   100   100   000    Old_age   Always       –       0
198 Offline_Uncorrectable   0x0010   100   100   000    Old_age   Offline      –       0
199 UDMA_CRC_Error_Count    0x003e   200   200   000    Old_age   Always       –       0
200 Multi_Zone_Error_Rate   0x0000   100   253   000    Old_age   Offline      –       0
202 TA_Increase_Count       0x0032   100   253   000    Old_age   Always       –       0

SMART Error Log Version: 1
ATA Error Count: 33 (device log contains only the most recent five errors)
    CR = Command Register [HEX]
    FR = Features Register [HEX]
    SC = Sector Count Register [HEX]
    SN = Sector Number Register [HEX]
    CL = Cylinder Low Register [HEX]
    CH = Cylinder High Register [HEX]
    DH = Device/Head Register [HEX]
    DC = Device Command Register [HEX]
    ER = Error register [HEX]
    ST = Status register [HEX]
Powered_Up_Time is measured from power on, and printed as
DDd+hh:mm:SS.sss where DD=days, hh=hours, mm=minutes,
SS=sec, and sss=millisec. It "wraps" after 49.710 days.

Error 33 occurred at disk power-on lifetime: 21588 hours (899 days + 12 hours)
  When the command that caused the error occurred, the device was active or idle.

  After command completion occurred, registers were:
  ER ST SC SN CL CH DH
  — — — — — — —
  40 51 00 77 c3 6a e0  Error: UNC at LBA = 0x006ac377 = 6996855

  Commands leading to the command that caused the error were:
  CR FR SC SN CL CH DH DC   Powered_Up_Time  Command/Feature_Name
  — — — — — — — —  —————-  ——————–
  c8 00 08 77 c3 6a e0 00      14:07:39.385  READ DMA
  ec 00 00 00 00 00 a0 00      14:07:35.553  IDENTIFY DEVICE
  ef 03 45 00 00 00 a0 00      14:07:35.550  SET FEATURES [Set transfer mode]
  ec 00 00 00 00 00 a0 00      14:07:35.547  IDENTIFY DEVICE
  c8 00 08 77 c3 6a e0 00      14:07:35.543  READ DMA

Error 32 occurred at disk power-on lifetime: 21588 hours (899 days + 12 hours)
  When the command that caused the error occurred, the device was active or idle.

  After command completion occurred, registers were:
  ER ST SC SN CL CH DH
  — — — — — — —
  40 51 00 77 c3 6a e0  Error: UNC at LBA = 0x006ac377 = 6996855

  Commands leading to the command that caused the error were:
  CR FR SC SN CL CH DH DC   Powered_Up_Time  Command/Feature_Name
  — — — — — — — —  —————-  ——————–
  c8 00 08 77 c3 6a e0 00      14:07:23.940  READ DMA
  ec 00 00 00 00 00 a0 00      14:07:35.553  IDENTIFY DEVICE
  ef 03 45 00 00 00 a0 00      14:07:35.550  SET FEATURES [Set transfer mode]
  ec 00 00 00 00 00 a0 00      14:07:35.547  IDENTIFY DEVICE
  c8 00 08 77 c3 6a e0 00      14:07:35.543  READ DMA

Error 31 occurred at disk power-on lifetime: 21588 hours (899 days + 12 hours)
  When the command that caused the error occurred, the device was active or idle.

  After command completion occurred, registers were:
  ER ST SC SN CL CH DH
  — — — — — — —
  40 51 00 77 c3 6a e0  Error: UNC at LBA = 0x006ac377 = 6996855

  Commands leading to the command that caused the error were:
  CR FR SC SN CL CH DH DC   Powered_Up_Time  Command/Feature_Name
  — — — — — — — —  —————-  ——————–
  c8 00 08 77 c3 6a e0 00      14:07:23.940  READ DMA
  ec 00 00 00 00 00 a0 00      14:07:23.937  IDENTIFY DEVICE
  ef 03 45 00 00 00 a0 00      14:07:20.071  SET FEATURES [Set transfer mode]
  ec 00 00 00 00 00 a0 00      14:07:20.057  IDENTIFY DEVICE
  c8 00 08 77 c3 6a e0 00      14:07:20.044  READ DMA

Error 30 occurred at disk power-on lifetime: 21588 hours (899 days + 12 hours)
  When the command that caused the error occurred, the device was active or idle.

  After command completion occurred, registers were:
  ER ST SC SN CL CH DH
  — — — — — — —
  40 51 00 77 c3 6a e0  Error: UNC at LBA = 0x006ac377 = 6996855

  Commands leading to the command that caused the error were:
  CR FR SC SN CL CH DH DC   Powered_Up_Time  Command/Feature_Name
  — — — — — — — —  —————-  ——————–
  c8 00 08 77 c3 6a e0 00      14:07:23.940  READ DMA
  ec 00 00 00 00 00 a0 00      14:07:23.937  IDENTIFY DEVICE
  ef 03 45 00 00 00 a0 00      14:07:20.071  SET FEATURES [Set transfer mode]
  ec 00 00 00 00 00 a0 00      14:07:20.057  IDENTIFY DEVICE
  c8 00 08 77 c3 6a e0 00      14:07:20.044  READ DMA

Error 29 occurred at disk power-on lifetime: 21588 hours (899 days + 12 hours)
  When the command that caused the error occurred, the device was active or idle.

  After command completion occurred, registers were:
  ER ST SC SN CL CH DH
  — — — — — — —
  40 51 00 77 c3 6a e0  Error: UNC at LBA = 0x006ac377 = 6996855

  Commands leading to the command that caused the error were:
  CR FR SC SN CL CH DH DC   Powered_Up_Time  Command/Feature_Name
  — — — — — — — —  —————-  ——————–
  c8 00 08 77 c3 6a e0 00      14:07:23.940  READ DMA
  ec 00 00 00 00 00 a0 00      14:07:23.937  IDENTIFY DEVICE
  ef 03 45 00 00 00 a0 00      14:07:20.071  SET FEATURES [Set transfer mode]
  ec 00 00 00 00 00 a0 00      14:07:20.057  IDENTIFY DEVICE
  c8 00 08 77 c3 6a e0 00      14:07:20.044  READ DMA

SMART Self-test log structure revision number 1
Num  Test_Description    Status                  Remaining  LifeTime(hours)  LBA_of_first_error
# 1  Extended offline    Completed without error       00%         1         –

SMART Selective self-test log data structure revision number 1
 SPAN  MIN_LBA  MAX_LBA  CURRENT_TEST_STATUS
    1        0        0  Not_testing
    2        0        0  Not_testing
    3        0        0  Not_testing
    4        0        0  Not_testing
    5        0        0  Not_testing
Selective self-test flags (0x0):
  After scanning selected spans, do NOT read-scan remainder of disk.
If Selective self-test is pending on power-up, resume after 0 minute delay.

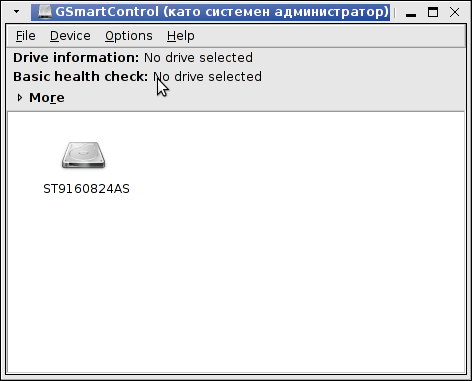
4. Visualizing smartd collected data in GUI with gsmartcontrol

For people who prefer to visualize things in Graphical environment smartd service hard disk health data can be viewed in nice graphical interface wth gsmartcontrol tool. Most Linux servers don't have graphical environment as having a X server with any graphics manager is a waste of system resources thus installing gsmartcontrol doesn't make much sense, however for monitoring and reporting for upcoming Hard Disk issues gsmartcontrol is a good one to have.

a) To install gsmartcontrol on Debian and Ubuntu Linux;

debian:~# apt-get install --yes gsmartcontrol
....


b) Installing gsmartcontrol on CentOS, Fedora, RHEL and SuSE;

gsmartcontrol has a binary package builds for all major Linux distributions, except Slackware Linux. For any of RPM based Linux distros. Go and download required smartmontools distro version and type binary from here then install the RPMs one by one with the usual:

[root@centos ~]# rpm -ivh glimm*
....
[root@centos ~]# rpm -ivh libglademm*
....
[root@centos ~]# rpm -ivh libsigc*
....
[root@centos ~]# rpm -ivh cairomm*
....
[root@centos ~]# rpm -ivh gsmartcontrol*
....

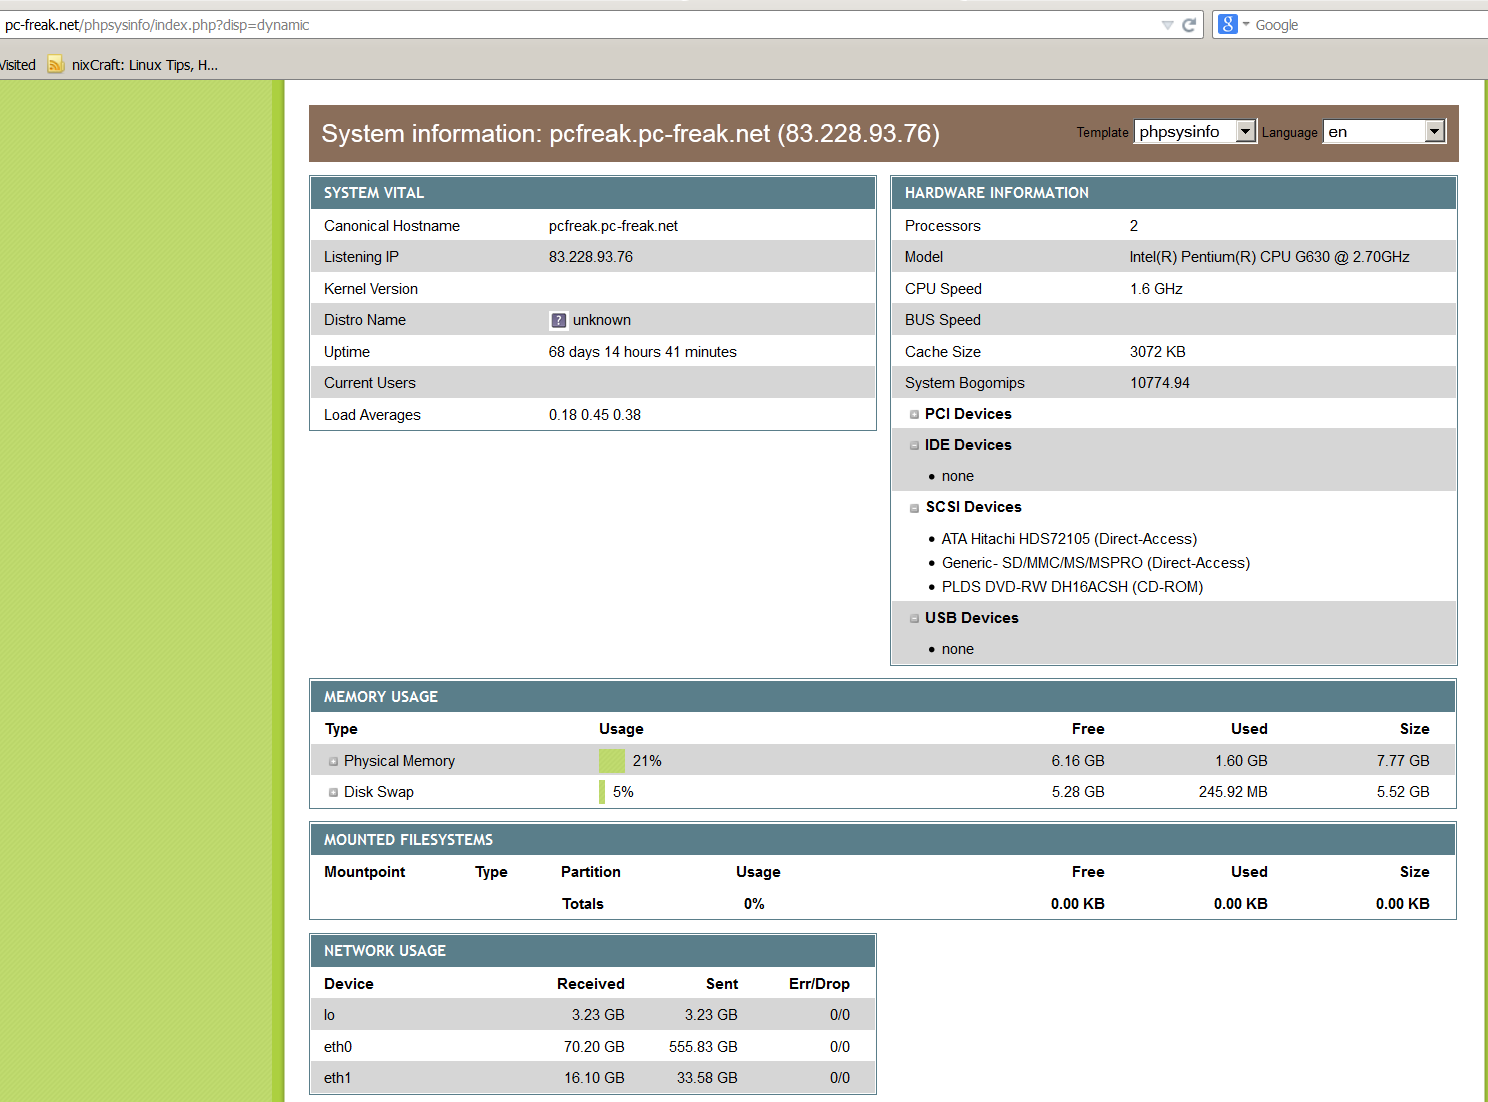
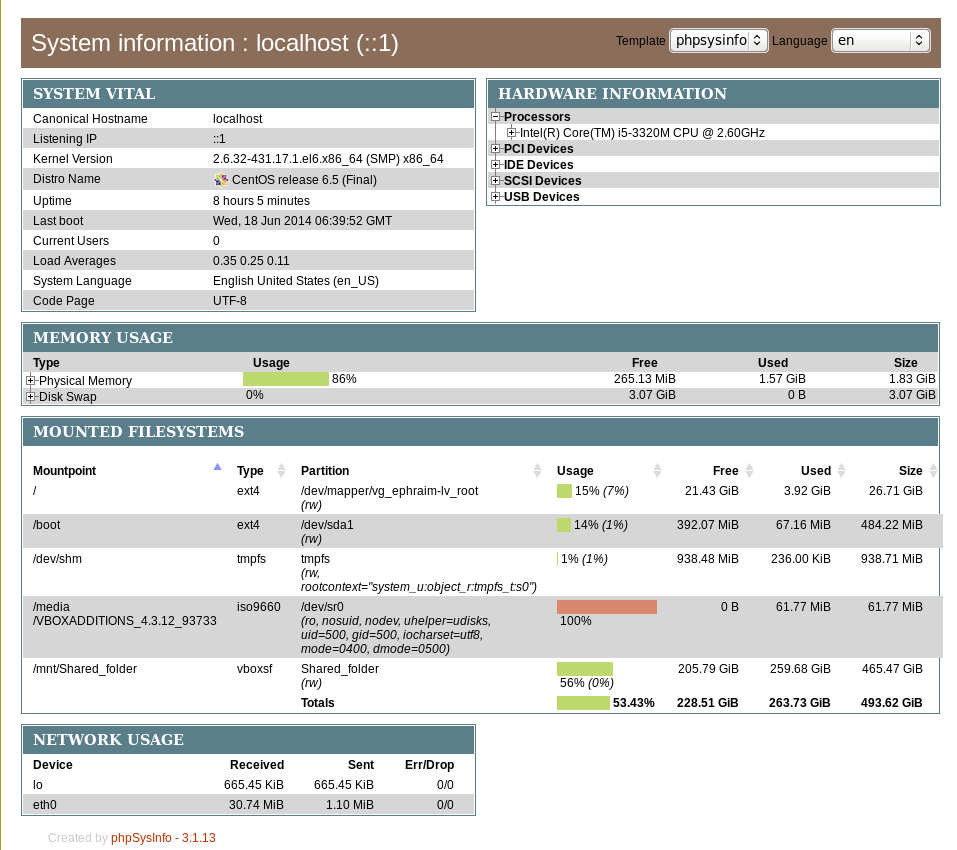
Below, are 2 screenshots of GSmartControl taken from my

gsmartmontools Debian stable Linux screenshot monitor hard disk health in graphical environment

Lenovo gsmartcontrol Thinkpad Device information /dev/sda ST9160824AS screenshot 
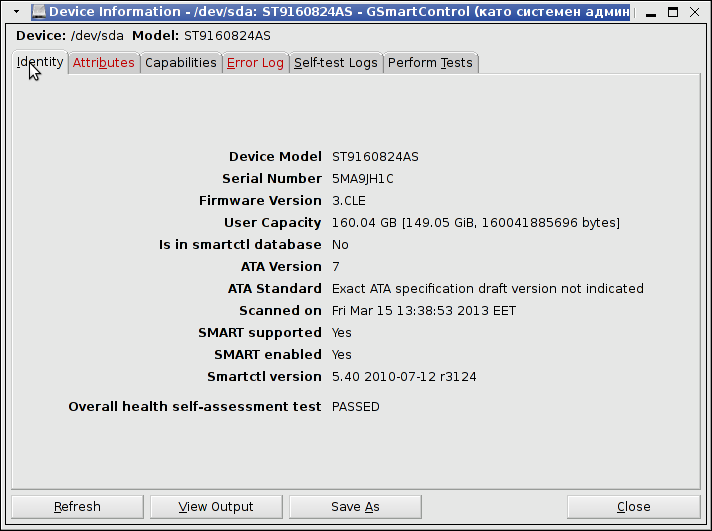
If you get something different from Overall health self-assessment test PASSED, this means hard disk has a surface damage and needs to be replaced ASAP. If during hard disk normal operation HDD hits I/O errors and you can't afford to have a GUI environment just for gsmartcontrol, errors gets logged in dmesg hence dmesg could be useful to provide you with info of a failing hard drive.

Secure delete files irreverseble on Debian and Fedora GNU / Linux

Thursday, February 21st, 2013

I just read an article in Linux-Magazine on Advanced File Management named – "Beyond the Basics". Most of what the article says is pretty trivial and known by any Linux enthusiast average user and administrator. There was one command mentioned shred which is probably not so well known among Free Software users shred allows the user to "secure delete files" / from the hard disk irreversible.

The tool is part of coreutils package and available across mostly all Linux distributions including Debian / Ubuntu debian derivatives and the RedHat based distros CentOS, Fedora, RHEL etc.

Just for info for those who don't know how to check, to which package a command belongs with rpm and dpkg, here is how;

[hipo@centos ~]$ rpm -qf /usr/bin/shred
coreutils-5.97-23.el5_4.2

hipo@debian:~$ dpkg -S /usr/bin/shred
coreutils: /usr/bin/shred

Here is how to delete a sample file ovewritting 3 times (-n2 – means 3 because in comuters we know we countr from 0 – 0 1 2 3), the z option fills up with zeros after overwritting the file ( just like seen on paste), -v option shows verbose what shred is doing and -u option truncates removes file after overwritting

noah:/var/tmp# shred -n2 -zvu crash20121113021508.txt
shred: crash20121113021508.txt: pass 1/3 (random)…
shred: crash20121113021508.txt: pass 2/3 (random)…
shred: crash20121113021508.txt: pass 3/3 (000000)…
shred: crash20121113021508.txt: removing
shred: crash20121113021508.txt: renamed to 00000000000000000000000
shred: 00000000000000000000000: renamed to 0000000000000000000000
shred: 0000000000000000000000: renamed to 000000000000000000000
shred: 000000000000000000000: renamed to 00000000000000000000
shred: 00000000000000000000: renamed to 0000000000000000000
shred: 0000000000000000000: renamed to 000000000000000000
shred: 000000000000000000: renamed to 00000000000000000
shred: 00000000000000000: renamed to 0000000000000000
shred: 0000000000000000: renamed to 000000000000000
shred: 000000000000000: renamed to 00000000000000
shred: 00000000000000: renamed to 0000000000000
shred: 0000000000000: renamed to 000000000000
shred: 000000000000: renamed to 00000000000
shred: 00000000000: renamed to 0000000000
shred: 0000000000: renamed to 000000000
shred: 000000000: renamed to 00000000
shred: 00000000: renamed to 0000000
shred: 0000000: renamed to 000000
shred: 000000: renamed to 00000
shred: 00000: renamed to 0000
shred: 0000: renamed to 000
shred: 000: renamed to 00
shred: 00: renamed to 0
shred: crash20121113021508.txt: removed
 

One common use of shred is by sysadmins who has to prepare old server containing lets say client data (SQL) – mail boxes or just file data and then sell it to third parties making sure data will be un-restorable for the new owner. Also shred is used a lot by crackers who set up "time bombs" activated on user activity or inactivity to destroy evidences in case of crackers PC is being captured by police. Though shred cannot guarantee 100% that deleted data can't be recoved within a special data recovery lab in most of cases it is enough to assure data with it will be almost impossible to recover.

How to speed up Linux Flash Player videos in Firefox on old Computers

Wednesday, January 30th, 2013

Firefox browser cache variables to tune for better Flash player performance Linux screenshot
 

If you happen to run old Computer hardware with lets say 256 or 512 MB of memory, a CPU of 600-800Mhz and a small hard disk like 5 / 10 GB and you need to have Flash Player on Firefox play Videos in Youtube and Vimeo with as less obstructions as possible, it is useful to take a look and try tuning up browser caching values, to do so type in URL Address Bar


about:config

iceweasel about:config Iceweasel Firefox about:config screenshot in URL address bar

Then search for;

browser.cache

Iceweasel Firefox browser cache screenshot Debian Gnu Linux screenshot tiny

Raise (tune up) the values for:

browser.cache.disk.capacity 1048576

Try to raise this value with 50% (524288), (1048576 + 524288) = 1572864.

By default, as you see

browser.cache.disk.enable is set to false

Try to change it to true, as this might have positive effect on flash video buffering and thus improve a bit experience.

browser.cache.disk.smart_size_cached_value 358318

Again it is good practice to try raise it with 50% and test if Flash Player performs better. I.e. (358318/2) = 179159, (358318+179159) = 537477. Hence raise it too lets say 358318. I give the 50%, example because the cache size on Firefox (IceWeasel) will differ depending on the browser version Linux distro and architecture.

There are few other caching, variables to tune, though I doubt if they will have impact on Flash Player performance it is good to know they're there. To see all Mozilla caching variables in Search filed, type "cache". One other non Flash Player performance related variable to check and tune is:

image.cache.size

In time of writting on my Firefox ver. 18.0.1 it is set to 5242880.
I'm looking forward to hear if this little tuning tips helped improve Flash Player. If you happen to have some positive impact on Video flow, please drop a comment with Linux distribution type and version, Flash Player version and changed caching variables.
Hope this little post helps. Happy tuning 🙂