Posts Tagged ‘kernel’

Migration of audit messages from snoopy to auditd

Tuesday, April 20th, 2010

his article may be out of date and may be deleted in the future.

This article explains the migration from the previous service "Snoopy" to "Auditd". Only commands that are executed as a user with root rights should be recorded here.


Uninstall/disable snoopy
 

Configuration of auditd

Files needed
Auditd start/stop script

/etc/init.d/auditd

Rules for monitoring by auditd

/etc/audit/audit.rules

Auditd plugin for syslog service

/etc/audisp/plugins.d/syslog.conf

Edit the /etc/audit/audit.rules file
Auditd can be specifically configured to capture and exclude messages. The following list is helpful for excluding certain event entries ("msgtype"):

* 1000 – 1099 are for commanding the audit system
* 1100 – 1199 user space trusted application messages
* 1200 – 1299 messages internal to the audit daemon
* 1300 – 1399 audit event messages
* 1400 – 1499 kernel SE Linux use
* 1500 – 1599 AppArmor events
* 1600 – 1699 kernel crypto events
* 1700 – 1799 kernel abnormal records
* 1800 – 1999 future kernel use (maybe integrity labels and related events)
* 2001 – 2099 unused (kernel)
* 2100 – 2199 user space anomaly records
* 2200 – 2299 user space actions taken in response to anomalies
* 2300 – 2399 user space generated LSPP events
* 2400 – 2499 user space crypto events
* 2500 – 2999 future user space (maybe integrity labels and related events)

Adding the rules

In order for auditd to record the desired events, rules must be defined.

List of rules set up
Below is a list and explanation of the rules set up:

-a exclude,always -F msgtype>=2400 -F msgtype<=2499
-a exclude,always -F msgtype=PATH
-a exclude,always -F msgtype=CWD
-a exclude,always -F msgtype=EOE
-a exit,always -F arch=b64 -F auid!=0 -F auid!=4294967295 -S execve
-a exit,always -F arch=b32 -F auid!=0 -F auid!=4294967295 -S execve

The first rule excludes crypto events in user space – these include, for example, messages about a user logging in.
The second through fourth rules remove the information not necessary for monitoring before it is logged.
The fifth and sixth rules capture the commands entered by users moving within an interactive shell. Services etc. executed by the system are therefore not recorded.
It should be noted here that a separate rule must be created for systems that contain both 32- and 64-bit commands and libraries.

Rule syntax

In general, it makes sense to keep the number of existing rules low in order to reduce the load. Therefore, if possible, several rule fields (-F option) should be combined in one rule. Since Auditd obviously has a problem with multiple event entries that are defined in plain text, these have been created in individual rules. The syntax description of the individual rules is given in the next listing:

-a contains the instructions
The action value "exclude" and the list value "always" are specified for rules that should not lead to any log entry
The action values ​​"exit" and "always" have been specified for rules that should lead to a log entry
"exit" stands for a log entry after the command has been executed
-F defines a rules field
Depending on the application, the rules defined here filter by event entry ("msgtype"), architecture ("arch") and login UID ("auid").
-S stands for the syscall. In the rules that should lead to a log entry, the value "execve" is monitored – i.e. when commands are executed.

Redirect to syslog

Within the file /etc/audisp/plugins.d/syslog.conf the value

active = no
on

active = yes
set.

restart auditd with the command

/etc/init.d/auditd restart
the settings are accepted.

Additional information

The following man pages can be consulted for more information:

auditctl
audit.rules
auditd
auditd.conf

How to extend LVM full partition to bigger size on Linux Virtual machine Guest running in VMware vSphere

Tuesday, September 20th, 2022

lvm-filesystem-extend-on-linux-virtual-machine-vmware-physical-group-volume-group-logical-volume-partitions-picture

Lets say you have to resize a partition that is wrongly made by some kind of automation like ansible or puppet,
because the Linux RHEL family OS template was prepared with a /home (or other partition with some very small size)  on VMware Vsphere Hypervisor hosting the Guest linux VM and the partition got quickly out of space.

To resolve the following question comes for the sysadmin

I. How to extend the LVM parititon that run out of space (without rebooting the VM Guest Linux Host)

II. how to add new disk partition space to the vSphere hypervisor OS. 

In below article i'll shortly describe that trivials steps to take to achieve that. Article won't show anything new original but I wrote it,
because I want it to have it logged for myself in case I need to LVM extend the space of my own Virtual machines and 
cause hopefully that might be of help to someone else from the Linux community that has to complete the same task.
 

I . Extending a LVM parititon that run out of space on a Linux Guest VM
 
1. Check the current parititon size that you want to extend

[root@linux-hostname home]# df -h /home/
 Filesystem            Size  Used Avail Use% Mounted on
 /dev/mapper/vg00-home
                       4.7G  4.5G     0 100% /home

2. Check the Virtualization platform

[root@vm-hostname ~]# lshw |head -3
linux-hostname
    description: Computer
    product: VMware Virtual Platform

3. Check the Operating System Linux OS type and version 

In this specific case this is a bit old Redhat -like CentOS 6.9 Linux
 

[root@vmware-host ~]# cat /etc/*release*
CentOS release 6.9 (Final)
cpe:/o:centos:linux:6:GA

4. Find out the type of target filesystem is EXT3, EXT4 or XFS etc.?

[root@vm-hostname ~]# grep home /proc/mounts
/dev/mapper/vg00-home /home ext3 rw,relatime,errors=continue,user_xattr,acl,barrier=1,data=ordered 0 0


Filesystem is handled by LVM thus

5. Check the size of the LVM partition we want to exchange

[root@vm-hostname ~]# lvs |grep home
home vg00 -wi-ao—- 5.00g

6. Check whether free space is available space in the volume group ?

[root@vm-hostname ~]# vgdisplay vg00
  — Volume group —
  VG Name               vg00
  System ID
  Format                lvm2
  Metadata Areas        2
  Metadata Sequence No  15
  VG Access             read/write
  VG Status             resizable
  MAX LV                0
  Cur LV                10
  Open LV               10
  Max PV                0
  Cur PV                2
  Act PV                2
  VG Size               128.99 GiB
  PE Size               4.00 MiB
  Total PE              33022
  Alloc PE / Size       30976 / 121.00 GiB
  Free  PE / Size       2046 / 7.99 GiB
  VG UUID               1F89PB-nIP2-7Hgu-zEVR-5H0R-7GdB-Lfj7t4


Extend VMWare space configured for additional hard disk on Hypervisor (if necessery)

In order for to extend the LVM of course you need to have a pre-existing additional hard-drive on VM (sdb,sdc etc. attached )

– If you need to extend on Vmware Vsphere Hypervisor:
Extend additional harddrive by entering the new size and Validate.

If you have previously extended the size of the Virtual Disk from VMWare to make the Linux guest vm find out about the change
you have to rerun rescan for the respective device that was grown on the HV.

7. Rescan on Linux VM host for changes in disk size from Hypervisor

Rescan disk for new size :

[root@vm-hostname ~]# echo 1> /sys/block/sdX/device/rescan

(where sdX is the extended additional harddrive)

8. Resize LVM physical volume

[root@vm-hostname ~]# pvresize /dev/sdX

9. Enlarge Logical Volume size 

[root@vm-hostname ~]# lvextend -L+5G /dev/mapper/vg00-home
     Extending logical volume LogVol00 to 10.77 GiB
     Logical volume LogVol00 successfully resized

10. Enlarge LVM hosted filesystem size

Filesystem is ext3 or ext4 :

[root@vm-hostname ~]# resize2fs /dev/mapper/vg00-home

– If the filesystem is not ext3 / ext4 but XFS you have to use xfs_growfs to let the FS know about the change.

Filesystem is XFS :
 

[root@vm-hostname ~]# xfs_growfs /dev/mapper/vg00-home

11. Check the additional filespace is already active on the Linux Guest VM

[root@vm-hostname ~]# df -h /home/
 Filesystem            Size  Used Avail Use% Mounted on
 /dev/mapper/vg_cloud-LogVol00
                        10G  4.2G  4.9G  48% /home


12. Verify  the extension of filesystem completed without errors


Check of system log:

[root@vm-hostname ~]# grep -i error /var/log/messages

Check if filesystem is writable.

[root@vm-hostname ~]# touch /home/test

[root@vm-hostname ~]# ls -al /home/test
-rw-r—– 1 root root 0 Sep 20 13:39 /home/test
[root@vm-hostname ~]# rm -f /home/test


II.  How to add additional sdb drive to a Linux host from vSPhere HV lets say (sdb)


1.  On VSphere GUI  interface

-> Select New hard drive and click Add

Enter the desired size for the new disk then unpack the disk parameters to choose Thin provision. Validate and Apply the recommendations.

basic-lvm-create-volume_group-diagram-on-linux-explained

2. On Linux system VM guest host to detect the new added sdb available space

Discover new disk :

[root@vm-hostname ~]# echo "- – -"> /sys/class/scsi_host/host2/scan && echo "- – -"> /sys/class/scsi_host/host1/scan && echo "- – -"> /sys/class/scsi_host/host0/scan

See  if discovered disk is found in /var/log/messages :

[…]
Nov 8 17:33:26 bict4004s kernel: scsi 2:0:2:0: Direct-Access VMware Virtual disk 1.0 PQ: 0 ANSI: 2
Nov 8 17:33:26 bict4004s kernel: scsi target2:0:2: Beginning Domain Validation
Nov 8 17:33:26 bict4004s kernel: scsi target2:0:2: Domain Validation skipping write tests
Nov 8 17:33:26 bict4004s kernel: scsi target2:0:2: Ending Domain Validation
Nov 8 17:33:26 bict4004s kernel: scsi target2:0:2: FAST-40 WIDE SCSI 80.0 MB/s ST (25 ns, offset 127)
Nov 8 17:33:26 bict4004s kernel: sd 2:0:2:0: Attached scsi generic sg3 type 0
Nov 8 17:33:26 bict4004s kernel: sd 2:0:2:0: [sdb] 2097152 512-byte logical blocks: (1.07 GB/1.00 GiB)
Nov 8 17:33:26 bict4004s kernel: sd 2:0:2:0: [sdb] Write Protect is off
Nov 8 17:33:26 bict4004s kernel: sd 2:0:2:0: [sdb] Cache data unavailable
Nov 8 17:33:26 bict4004s kernel: sd 2:0:2:0: [sdb] Assuming drive cache: write through
Nov 8 17:33:26 bict4004s kernel: sd 2:0:2:0: [sdb] Attached SCSI disk
[…]

3. Create new LVM Physical Volume

[root@vm-hostname ~]# pvcreate /dev/sdb

4. Enlarge LVM Volume Group to the max available size of /dev/sdb

[root@vm-hostname ~]# vgextend vg00 /dev/sdb

Enlarge LVM Logical Volume

[root@vm-hostname ~]# lvextend -L+10G /dev/mapper/vg00-home

5. Enlarge filesystem to max size of just created LVM

If Filesystem is ext3 or ext4 :

[root@vm-hostname ~]# resize2fs /dev/mapper/vg00-home


Again if we work with XFS additionally do:

[root@vm-hostname ~]# xfs_growfs /dev/mapper/vg00-home

6. Checking filesystem extension completed correct

 [root@vm-hostname ~]# df -h /home


7. Check filesystem is writtable and no errors produced in logs

Check of system log:

[root@vm-hostname ~]# grep -i error /var/log/messages


Check if filesystem is writable.

[root@vm-hostname ~]# touch /home/test

List and fix failed systemd failed services after Linux OS upgrade and how to get full info about systemd service from jorunal log

Friday, February 25th, 2022

systemd-logo-unix-linux-list-failed-systemd-services

I have recently upgraded a number of machines from Debian 10 Buster to Debian 11 Bullseye. The update as always has some issues on some machines, such as problem with package dependencies, changing a number of external package repositories etc. to match che Bullseye deb packages. On some machines the update was less painful on others but the overall line was that most of the machines after the update ended up with one or more failed systemd services. It could be that some of the machines has already had this failed services present and I never checked them from the previous time update from Debian 9 -> Debian 10 or just some mess I've left behind in the hurry when doing software installation in the past. This doesn't matter anyways the fact was that I had to deal to a number of systemctl services which I managed to track by the Failed service mesage on system boot on one of the physical machines and on the OpenXen VTY Console the rest of Virtual Machines after update had some Failed messages. Thus I've spend some good amount of time like an overall of a day or two fixing strange failed services. This is how this small article was born in attempt to help sysadmins or any home Linux desktop users, who has updated his Debian Linux / Ubuntu or any other deb based distribution but due to the chaotic nature of Linux has ended with same strange Failed services and look for a way to find the source of the failures and get rid of the problems. 
Systemd is a very complicated system and in my many sysadmin opinion it makes more problems than it solves, but okay for today's people's megalomania mindset it matches well.

Systemd_components-systemd-journalctl-cgroups-loginctl-nspawn-analyze.svg


1. Check the journal for errors, running service irregularities and so on
 

First thing to do to track for errors, right after the update is to take some minutes and closely check,, the journalctl for any strange errors, even on well maintained Unix machines, this journal log would bring you to a problem that is not fatal but still some process or stuff is malfunctioning in the background that you would like to solve:
 

root@pcfreak:~# journalctl -x
Jan 10 10:10:01 pcfreak CRON[17887]: pam_unix(cron:session): session closed for user root
Jan 10 10:10:01 pcfreak audit[17887]: USER_END pid=17887 uid=0 auid=0 ses=340858 subj==unconfined msg='op=PAM:session_close grantors=pam_loginuid,pam_env,pam_env,pam_permit>
Jan 10 10:10:01 pcfreak audit[17888]: CRED_DISP pid=17888 uid=0 auid=0 ses=340860 subj==unconfined msg='op=PAM:setcred grantors=pam_permit acct="root" exe="/usr/sbin/cron" >
Jan 10 10:10:01 pcfreak CRON[17888]: pam_unix(cron:session): session closed for user root
Jan 10 10:10:01 pcfreak audit[17888]: USER_END pid=17888 uid=0 auid=0 ses=340860 subj==unconfined msg='op=PAM:session_close grantors=pam_loginuid,pam_env,pam_env,pam_permit>
Jan 10 10:10:01 pcfreak audit[17884]: CRED_DISP pid=17884 uid=0 auid=0 ses=340855 subj==unconfined msg='op=PAM:setcred grantors=pam_permit acct="root" exe="/usr/sbin/cron" >
Jan 10 10:10:01 pcfreak CRON[17884]: pam_unix(cron:session): session closed for user root
Jan 10 10:10:01 pcfreak audit[17884]: USER_END pid=17884 uid=0 auid=0 ses=340855 subj==unconfined msg='op=PAM:session_close grantors=pam_loginuid,pam_env,pam_env,pam_permit>
Jan 10 10:10:01 pcfreak audit[17886]: CRED_DISP pid=17886 uid=0 auid=33 ses=340859 subj==unconfined msg='op=PAM:setcred grantors=pam_permit acct="www-data" exe="/usr/sbin/c>
Jan 10 10:10:01 pcfreak CRON[17886]: pam_unix(cron:session): session closed for user www-data
Jan 10 10:10:01 pcfreak audit[17886]: USER_END pid=17886 uid=0 auid=33 ses=340859 subj==unconfined msg='op=PAM:session_close grantors=pam_loginuid,pam_env,pam_env,pam_permi>
Jan 10 10:10:08 pcfreak NetworkManager[696]:  [1641802208.0899] device (eth1): carrier: link connected
Jan 10 10:10:08 pcfreak kernel: r8169 0000:03:00.0 eth1: Link is Up – 100Mbps/Full – flow control rx/tx
Jan 10 10:10:08 pcfreak kernel: r8169 0000:03:00.0 eth1: Link is Down
Jan 10 10:10:19 pcfreak NetworkManager[696]:
 [1641802219.7920] device (eth1): carrier: link connected
Jan 10 10:10:19 pcfreak kernel: r8169 0000:03:00.0 eth1: Link is Up – 100Mbps/Full – flow control rx/tx
Jan 10 10:10:20 pcfreak kernel: r8169 0000:03:00.0 eth1: Link is Down
Jan 10 10:10:22 pcfreak NetworkManager[696]:
 [1641802222.2772] device (eth1): carrier: link connected
Jan 10 10:10:22 pcfreak kernel: r8169 0000:03:00.0 eth1: Link is Up – 100Mbps/Full – flow control rx/tx
Jan 10 10:10:23 pcfreak kernel: r8169 0000:03:00.0 eth1: Link is Down
Jan 10 10:10:33 pcfreak sshd[18142]: Unable to negotiate with 66.212.17.162 port 19255: no matching key exchange method found. Their offer: diffie-hellman-group14-sha1,diff>
Jan 10 10:10:41 pcfreak NetworkManager[696]:
 [1641802241.0186] device (eth1): carrier: link connected
Jan 10 10:10:41 pcfreak kernel: r8169 0000:03:00.0 eth1: Link is Up – 100Mbps/Full – flow control rx/tx

If you want to only check latest journal log messages use the -x -e (pager catalog) opts

root@pcfreak;~# journalctl -xe

Feb 25 13:08:29 pcfreak audit[2284920]: USER_LOGIN pid=2284920 uid=0 auid=4294967295 ses=4294967295 subj==unconfined msg='op=login acct=28696E76616C>
Feb 25 13:08:29 pcfreak sshd[2284920]: Received disconnect from 177.87.57.145 port 40927:11: Bye Bye [preauth]
Feb 25 13:08:29 pcfreak sshd[2284920]: Disconnected from invalid user ubuntuuser 177.87.57.145 port 40927 [preauth]

Next thing to after the update was to get a list of failed service only.


2. List all systemd failed check services which was supposed to be running

root@pcfreak:/root # systemctl list-units | grep -i failed
● certbot.service                                                                                                       loaded failed failed    Certbot
● logrotate.service                                                                                                     loaded failed failed    Rotate log files
● maldet.service                                                                                                        loaded failed failed    LSB: Start/stop maldet in monitor mode
● named.service                                                                                                         loaded failed failed    BIND Domain Name Server


Alternative way is with the –failed option

hipo@jeremiah:~$ systemctl list-units –failed
  UNIT                        LOAD   ACTIVE SUB    DESCRIPTION
● haproxy.service             loaded failed failed HAProxy Load Balancer
● libvirt-guests.service      loaded failed failed Suspend/Resume Running libvirt Guests
● libvirtd.service            loaded failed failed Virtualization daemon
● nvidia-persistenced.service loaded failed failed NVIDIA Persistence Daemon
● sqwebmail.service           masked failed failed sqwebmail.service
● tpm2-abrmd.service          loaded failed failed TPM2 Access Broker and Resource Management Daemon
● wd_keepalive.service        loaded failed failed LSB: Start watchdog keepalive daemon

LOAD   = Reflects whether the unit definition was properly loaded.
ACTIVE = The high-level unit activation state, i.e. generalization of SUB.
SUB    = The low-level unit activation state, values depend on unit type.
7 loaded units listed.


root@jeremiah:/etc/apt/sources.list.d#  systemctl list-units –failed
  UNIT                        LOAD   ACTIVE SUB    DESCRIPTION
● haproxy.service             loaded failed failed HAProxy Load Balancer
● libvirt-guests.service      loaded failed failed Suspend/Resume Running libvirt Guests
● libvirtd.service            loaded failed failed Virtualization daemon
● nvidia-persistenced.service loaded failed failed NVIDIA Persistence Daemon
● sqwebmail.service           masked failed failed sqwebmail.service
● tpm2-abrmd.service          loaded failed failed TPM2 Access Broker and Resource Management Daemon
● wd_keepalive.service        loaded failed failed LSB: Start watchdog keepalive daemon


To get a full list of objects of systemctl you can pass as state:
 

# systemctl –state=help
Full list of possible load states to pass is here
Show service properties


Check whether a service is failed or has other status and check default set systemd variables for it.

root@jeremiah~:# systemctl is-failed vboxweb.service
inactive

# systemctl show haproxy
Type=notify
Restart=always
NotifyAccess=main
RestartUSec=100ms
TimeoutStartUSec=1min 30s
TimeoutStopUSec=1min 30s
TimeoutAbortUSec=1min 30s
TimeoutStartFailureMode=terminate
TimeoutStopFailureMode=terminate
RuntimeMaxUSec=infinity
WatchdogUSec=0
WatchdogTimestampMonotonic=0
RootDirectoryStartOnly=no
RemainAfterExit=no
GuessMainPID=yes
SuccessExitStatus=143
MainPID=304858
ControlPID=0
FileDescriptorStoreMax=0
NFileDescriptorStore=0
StatusErrno=0
Result=success
ReloadResult=success
CleanResult=success

Full output of the above command is dumped in show_systemctl_properties.txt


3. List all running systemd services for a better overview on what's going on on machine
 

To get a list of all properly systemd loaded services you can use –state running.

hipo@jeremiah:~$ systemctl list-units –state running|head -n 10
  UNIT                              LOAD   ACTIVE SUB     DESCRIPTION
  proc-sys-fs-binfmt_misc.automount loaded active running Arbitrary Executable File Formats File System Automount Point
  cups.path                         loaded active running CUPS Scheduler
  init.scope                        loaded active running System and Service Manager
  session-2.scope                   loaded active running Session 2 of user hipo
  accounts-daemon.service           loaded active running Accounts Service
  anydesk.service                   loaded active running AnyDesk
  apache-htcacheclean.service       loaded active running Disk Cache Cleaning Daemon for Apache HTTP Server
  apache2.service                   loaded active running The Apache HTTP Server
  avahi-daemon.service              loaded active running Avahi mDNS/DNS-SD Stack


It is useful thing is to list all unit-files configured in systemd and their state, you can do it with:


root@pcfreak:~# systemctl list-unit-files
UNIT FILE                                                                 STATE           VENDOR PRESET
proc-sys-fs-binfmt_misc.automount                                         static          –            
-.mount                                                                   generated       –            
backups.mount                                                             generated       –            
dev-hugepages.mount                                                       static          –            
dev-mqueue.mount                                                          static          –            
media-cdrom0.mount                                                        generated       –            
mnt-sda1.mount                                                            generated       –            
proc-fs-nfsd.mount                                                        static          –            
proc-sys-fs-binfmt_misc.mount                                             disabled        disabled     
run-rpc_pipefs.mount                                                      static          –            
sys-fs-fuse-connections.mount                                             static          –            
sys-kernel-config.mount                                                   static          –            
sys-kernel-debug.mount                                                    static          –            
sys-kernel-tracing.mount                                                  static          –            
var-www.mount                                                             generated       –            
acpid.path                                                                masked          enabled      
cups.path                                                                 enabled         enabled      


root@pcfreak:~# systemctl list-units –type service –all
  UNIT                                   LOAD      ACTIVE   SUB     DESCRIPTION
  accounts-daemon.service                loaded    inactive dead    Accounts Service
  acct.service                           loaded    active   exited  Kernel process accounting
● alsa-restore.service                   not-found inactive dead    alsa-restore.service
● alsa-state.service                     not-found inactive dead    alsa-state.service
  apache2.service                        loaded    active   running The Apache HTTP Server
● apparmor.service                       not-found inactive dead    apparmor.service
  apt-daily-upgrade.service              loaded    inactive dead    Daily apt upgrade and clean activities
 apt-daily.service                      loaded    inactive dead    Daily apt download activities
  atd.service                            loaded    active   running Deferred execution scheduler
  auditd.service                         loaded    active   running Security Auditing Service
  auth-rpcgss-module.service             loaded    inactive dead    Kernel Module supporting RPCSEC_GSS
  avahi-daemon.service                   loaded    active   running Avahi mDNS/DNS-SD Stack
  certbot.service                        loaded    inactive dead    Certbot
  clamav-daemon.service                  loaded    active   running Clam AntiVirus userspace daemon
  clamav-freshclam.service               loaded    active   running ClamAV virus database updater
..


linux-systemd-components-diagram-linux-kernel-system-targets-systemd-libraries-daemons


4. Finding out more on why a systemd configured service has failed


Usually getting info about failed systemd service is done with systemctl status servicename.service
However, in case of troubles with service unable to start to get more info about why a service has failed with (-l) or (–full) options


root@pcfreak:~# systemctl -l status logrotate.service
● logrotate.service – Rotate log files
     Loaded: loaded (/lib/systemd/system/logrotate.service; static)
     Active: failed (Result: exit-code) since Fri 2022-02-25 00:00:06 EET; 13h ago
TriggeredBy: ● logrotate.timer
       Docs: man:logrotate(8)
             man:logrotate.conf(5)
    Process: 2045320 ExecStart=/usr/sbin/logrotate /etc/logrotate.conf (code=exited, status=1/FAILURE)
   Main PID: 2045320 (code=exited, status=1/FAILURE)
        CPU: 2.479s

Feb 25 00:00:06 pcfreak logrotate[2045577]: 2022/02/25 00:00:06| WARNING: For now we will assume you meant to write /32
Feb 25 00:00:06 pcfreak logrotate[2045577]: 2022/02/25 00:00:06| ERROR: '0.0.0.0/0.0.0.0' needs to be replaced by the term 'all'.
Feb 25 00:00:06 pcfreak logrotate[2045577]: 2022/02/25 00:00:06| SECURITY NOTICE: Overriding config setting. Using 'all' instead.
Feb 25 00:00:06 pcfreak logrotate[2045577]: 2022/02/25 00:00:06| WARNING: (B) '::/0' is a subnetwork of (A) '::/0'
Feb 25 00:00:06 pcfreak logrotate[2045577]: 2022/02/25 00:00:06| WARNING: because of this '::/0' is ignored to keep splay tree searching predictable
Feb 25 00:00:06 pcfreak logrotate[2045577]: 2022/02/25 00:00:06| WARNING: You should probably remove '::/0' from the ACL named 'all'
Feb 25 00:00:06 pcfreak systemd[1]: logrotate.service: Main process exited, code=exited, status=1/FAILURE
Feb 25 00:00:06 pcfreak systemd[1]: logrotate.service: Failed with result 'exit-code'.
Feb 25 00:00:06 pcfreak systemd[1]: Failed to start Rotate log files.
Feb 25 00:00:06 pcfreak systemd[1]: logrotate.service: Consumed 2.479s CPU time.


systemctl -l however is providing only the last log from message a started / stopped or whatever status service has generated. Sometimes systemctl -l servicename.service is showing incomplete the splitted error message as there is a limitation of line numbers on the console, see below


root@pcfreak:~# systemctl status -l certbot.service
● certbot.service – Certbot
     Loaded: loaded (/lib/systemd/system/certbot.service; static)
     Active: failed (Result: exit-code) since Fri 2022-02-25 09:28:33 EET; 4h 0min ago
TriggeredBy: ● certbot.timer
       Docs: file:///usr/share/doc/python-certbot-doc/html/index.html
             https://certbot.eff.org/docs
    Process: 290017 ExecStart=/usr/bin/certbot -q renew (code=exited, status=1/FAILURE)
   Main PID: 290017 (code=exited, status=1/FAILURE)
        CPU: 9.771s

Feb 25 09:28:33 pcfrxen certbot[290017]: The error was: PluginError('An authentication script must be provided with –manual-auth-hook when using th>
Feb 25 09:28:33 pcfrxen certbot[290017]: All renewals failed. The following certificates could not be renewed:
Feb 25 09:28:33 pcfrxen certbot[290017]:   /etc/letsencrypt/live/mail.pcfreak.org-0003/fullchain.pem (failure)
Feb 25 09:28:33 pcfrxen certbot[290017]:   /etc/letsencrypt/live/www.eforia.bg-0005/fullchain.pem (failure)
Feb 25 09:28:33 pcfrxen certbot[290017]:   /etc/letsencrypt/live/zabbix.pc-freak.net/fullchain.pem (failure)
Feb 25 09:28:33 pcfrxen certbot[290017]: 3 renew failure(s), 5 parse failure(s)
Feb 25 09:28:33 pcfrxen systemd[1]: certbot.service: Main process exited, code=exited, status=1/FAILURE
Feb 25 09:28:33 pcfrxen systemd[1]: certbot.service: Failed with result 'exit-code'.
Feb 25 09:28:33 pcfrxen systemd[1]: Failed to start Certbot.
Feb 25 09:28:33 pcfrxen systemd[1]: certbot.service: Consumed 9.771s CPU time.


5. Get a complete log of journal to make sure everything configured on server host runs as it should

Thus to get more complete list of the message and be able to later google and look if has come with a solution on the internet  use:

root@pcfrxen:~#  journalctl –catalog –unit=certbot

— Journal begins at Sat 2022-01-22 21:14:05 EET, ends at Fri 2022-02-25 13:32:01 EET. —
Jan 23 09:58:18 pcfrxen systemd[1]: Starting Certbot…
░░ Subject: A start job for unit certbot.service has begun execution
░░ Defined-By: systemd
░░ Support: https://www.debian.org/support
░░ 
░░ A start job for unit certbot.service has begun execution.
░░ 
░░ The job identifier is 5754.
Jan 23 09:58:20 pcfrxen certbot[124996]: Traceback (most recent call last):
Jan 23 09:58:20 pcfrxen certbot[124996]:   File "/usr/lib/python3/dist-packages/certbot/_internal/renewal.py", line 71, in _reconstitute
Jan 23 09:58:20 pcfrxen certbot[124996]:     renewal_candidate = storage.RenewableCert(full_path, config)
Jan 23 09:58:20 pcfrxen certbot[124996]:   File "/usr/lib/python3/dist-packages/certbot/_internal/storage.py", line 471, in __init__
Jan 23 09:58:20 pcfrxen certbot[124996]:     self._check_symlinks()
Jan 23 09:58:20 pcfrxen certbot[124996]:   File "/usr/lib/python3/dist-packages/certbot/_internal/storage.py", line 537, in _check_symlinks

root@server:~# journalctl –catalog –unit=certbot|grep -i pluginerror|tail -1
Feb 25 09:28:33 pcfrxen certbot[290017]: The error was: PluginError('An authentication script must be provided with –manual-auth-hook when using the manual plugin non-interactively.')


Or if you want to list and read only the last messages in the journal log regarding a service

root@server:~# journalctl –catalog –pager-end –unit=certbot


If you have disabled a failed service because you don't need it to run at all on the machine with:

root@rhel:~# systemctl stop rngd.service
root@rhel:~# systemctl disable rngd.service

And you want to clear up any failed service information that is kept in the systemctl service log you can do it with:
 

root@rhel:~# systemctl reset-failed

Another useful systemctl option is cat, you can use it to easily list a service it is useful to quickly check what is a service, an actual shortcut to save you from giving a full path to the service e.g. cat /lib/systemd/system/certbot.service

root@server:~# systemctl cat certbot
# /lib/systemd/system/certbot.service
[Unit]
Description=Certbot
Documentation=file:///usr/share/doc/python-certbot-doc/html/index.html
Documentation=https://certbot.eff.org/docs
[Service]
Type=oneshot
ExecStart=/usr/bin/certbot -q renew
PrivateTmp=true


After failed SystemD services are fixed, it is best to reboot the machine and check put some more time to inspect rawly the complete journal log to make sure, no error  was left behind.


Closure
 

As you can see updating a machine from a major to a major version even if you follow the official documentation and you have plenty of experience is always more or a less a pain in the ass, which can eat up much of your time banging your head solving problems with failed daemons issues with /etc/rc.local (which I have faced becase of #/bin/sh -e (which would make /etc/rc.local) to immediately quit if any error from command $? returns different from 0 etc.. The  logical questions comes then;
1. Is it really worthy to update at all regularly, especially if you don't know of a famous major Vulnerability 🙂 ?
2. Or is it worthy to update from OS major release to OS major release at all?  
3. Or should you only try to patch the service that is exposed to an external reachable computer network or the internet only and still the the same OS release until End of Life (LTS = Long Term Support) as called in Debian or  End Of Life  (EOL) Cycle as called in RPM based distros the period until the OS major release your software distro has official security patches is reached.

Anyone could take any approach but for my own managed systems small network at home my practice was always to try to keep up2date everything every 3 or 6 months maximum. This has caused me multiple days of irritation and stress and perhaps many white hairs and spend nerves on shit.


4. Based on the company where I'm employed the better strategy is to patch to the EOL is still offered and keep the rule First Things First (FTF), once the EOL is reached, just make a copy of all servers data and configuration to external Data storage, bring up a new Physical or VM and migrate the services.
Test after the migration all works as expected if all is as it should be change the DNS records or Leading Infrastructure Proxies whatever to point to the new service and that's it! Yes it is true that migration based on a full OS reinstall is more time consuming and requires much more planning, but usually the result is much more expected, plus it is much less stressful for the guy doing the job.

Get dmesg command kernel log report with human date / time timestamp on older Linux distributions

Friday, June 18th, 2021

how-to-get-dmesg-human-readable-timestamp-kernel-log-command-linux-logo

If you're a sysadmin you surely love to take a look at dmesg kernel log output. Usually on many Linux distributions there is a setup that dmesg keeps logging to log files /var/log/dmesg or /var/log/kern.log. But if you get some inherited old Linux servers it is quite possible that the previous machine maintainer did not enable the output of syslog to get logged in /var/log/{dmesg,kern.log,kernel.log}  or even have disabled the kernel log for some reason. Even though that in dmesg output you might find some interesting events reporting issues with Hard drives on its way to get broken / a bad / reads system processes crashing or whatever of other interesting information that could help you prevent severe servers downtimes or problems earlier but due to an old version of Linux distribution lets say Redhat 5 / Debian 6 or old CentOS / Fedora, the version of dmesg command shipped does not support the '-T' option that is present in util-linux package shipped with newer versions of  Redhat 7.X  / 8.X / SuSEs etc.  

 -T, –ctime
              Print human readable timestamps.  The timestamp could be inaccurate!

To illustrate better what I mean, here is an example from the non-human readable timestamp provided by older dmesg command

root@web-server~:# dmesg |tail -n 5
[4505913.361095] hid-generic 0003:1C4F:0002.000E: input,hidraw1: USB HID v1.10 Device [SIGMACHIP USB Keyboard] on usb-0000:00:1d.0-1.3/input1
[4558251.034024] Process accounting resumed
[4615396.191090] r8169 0000:03:00.0 eth1: Link is Down
[4615397.856950] r8169 0000:03:00.0 eth1: Link is Up – 100Mbps/Full – flow control rx/tx
[4644650.095723] Process accounting resumed

Thanksfully using below few lines of shell or perl scripts the dmesg -T  functionality could be added to the system , so you can easily get the proper timestamp out of the obscure default generated timestamp in the same manner as on newer distros.

Here is how to do with it with bash script:

#!/bin/sh paste in .bashrc and use dmesgt to get human readable timestamp
dmesg_with_human_timestamps () {
    FORMAT="%a %b %d %H:%M:%S %Y"


    now=$(date +%s)
    cputime_line=$(grep -m1 "\.clock" /proc/sched_debug)

    if [[ $cputime_line =~ [^0-9]*([0-9]*).* ]]; then
        cputime=$((BASH_REMATCH[1] / 1000))
    fi

    dmesg | while IFS= read -r line; do
        if [[ $line =~ ^\[\ *([0-9]+)\.[0-9]+\]\ (.*) ]]; then
            stamp=$((now-cputime+BASH_REMATCH[1]))
            echo "[$(date +”${FORMAT}” –date=@${stamp})] ${BASH_REMATCH[2]}"
        else
            echo "$line"
        fi
    done
}

Copy the script somewhere under lets say /usr/local/bin or wherever you like on the server and add into your HOME ~/.bashrc some alias like:
 

alias dmesgt=dmesg_with_timestamp.sh


You can get a copy dmesg_with_timestamp.sh of the script from here

Or you can use below few lines perl script to get the proper dmeg kernel date / time


#!/bin/perl
# on old Linux distros CentOS 6.0 etc. with dmesg (part of util-linux-ng-2.17.2-12.28.el6_9.2.x86_64) etc. dmesg -T not available
# workaround is little pl script below
dmesg_with_human_timestamps () {
    $(type -P dmesg) "$@" | perl -w -e 'use strict;
        my ($uptime) = do { local @ARGV="/proc/uptime";<>}; ($uptime) = ($uptime =~ /^(\d+)\./);
        foreach my $line (<>) {
            printf( ($line=~/^\[\s*(\d+)\.\d+\](.+)/) ? ( “[%s]%s\n", scalar localtime(time – $uptime + $1), $2 ) : $line )
        }'
}


Again to make use of the script put it under /usr/local/bin/check_dmesg_timestamp.pl

alias dmesgt=dmesg_with_human_timestamps

root@web-server:~# dmesgt | tail -n 20

[Sun Jun 13 15:51:49 2021] usb 2-1.3: USB disconnect, device number 9
[Sun Jun 13 15:51:50 2021] usb 2-1.3: new low-speed USB device number 10 using ehci-pci
[Sun Jun 13 15:51:50 2021] usb 2-1.3: New USB device found, idVendor=1c4f, idProduct=0002, bcdDevice= 1.10
[Sun Jun 13 15:51:50 2021] usb 2-1.3: New USB device strings: Mfr=1, Product=2, SerialNumber=0
[Sun Jun 13 15:51:50 2021] usb 2-1.3: Product: USB Keyboard
[Sun Jun 13 15:51:50 2021] usb 2-1.3: Manufacturer: SIGMACHIP
[Sun Jun 13 15:51:50 2021] input: SIGMACHIP USB Keyboard as /devices/pci0000:00/0000:00:1d.0/usb2/2-1/2-1.3/2-1.3:1.0/0003:1C4F:0002.000D/input/input25
[Sun Jun 13 15:51:50 2021] hid-generic 0003:1C4F:0002.000D: input,hidraw0: USB HID v1.10 Keyboard [SIGMACHIP USB Keyboard] on usb-0000:00:1d.0-1.3/input0
[Sun Jun 13 15:51:50 2021] input: SIGMACHIP USB Keyboard Consumer Control as /devices/pci0000:00/0000:00:1d.0/usb2/2-1/2-1.3/2-1.3:1.1/0003:1C4F:0002.000E/input/input26
[Sun Jun 13 15:51:50 2021] input: SIGMACHIP USB Keyboard System Control as /devices/pci0000:00/0000:00:1d.0/usb2/2-1/2-1.3/2-1.3:1.1/0003:1C4F:0002.000E/input/input27
[Sun Jun 13 15:51:50 2021] hid-generic 0003:1C4F:0002.000E: input,hidraw1: USB HID v1.10 Device [SIGMACHIP USB Keyboard] on usb-0000:00:1d.0-1.3/input1
[Mon Jun 14 06:24:08 2021] Process accounting resumed
[Mon Jun 14 22:16:33 2021] r8169 0000:03:00.0 eth1: Link is Down
[Mon Jun 14 22:16:34 2021] r8169 0000:03:00.0 eth1: Link is Up – 100Mbps/Full – flow control rx/tx

How to install Toshiba Satellite L40 B14 Wireless Adapter ( ID 0bda:8197 Realtek Semiconductor Corp. RTL8187B) on Ubuntu and Debian Linux

Thursday, April 28th, 2011

https://www.pc-freak.net/images/toshiba-satellite-l40

How to install Toshiba L40 B14 Wireless Adapter ( ID 0bda:8197 Realtek Semiconductor Corp. RTL8187B) on Ubuntu and Debian Linux
I've been struggling for more than 10 hours to fix up issues on a Ubuntu Maverick-Meerkaat with a rtl8187B Wireless Adapter

The RTL8187B almost drove me mad. I could see the wlan0 which meant the kernel is detecting the device, I could even bring it up with ifconfig wlan0 up , however when I tried it in gnome's network-manager or wicd the wireless networks were not showing up.

Trying to scan for networks using the commands:


ubuntu:~# iwlist wlan0 scan

was also unsuccesful, trying to bring up and down the wireless wlan0 interface with:


ubuntu:~# iwconfig wlan0 up

or


ubuntu:~# iwconfig wlan0 down

Both returned the error:
iwconfig: unknown command "up" and iwconfig: unknown command "down"

Running simply iwconfig was properly returning information about my Wireless Interface wlan0 :


wlan0 IEEE 802.11bg ESSID:off/any
Mode:Managed Access Point: Not-Associated Tx-Power=20 dBm
Retry long limit:7 RTS thr:off Fragment thr:off
Encryption key:off
Power Management:off

The exact information I could get about the wireless device was via the command:


ubuntu:~# lsusb | grep realtek
Bus 001 Device 002: ID 0bda:8197 Realtek Semiconductor Corp. RTL8187B Wireless Adapter

Trying manually to scan for wireless networks from console or gnome-terminal with command returned also the below weird results:


ubuntu:~# iwconfig wlan0 scan
iwconfig: unknown command "scan"

More oddly tunning wlan0 interface with commands like:


ubuntu:~# iwconfig wlan0 mode managed
ubuntu:~# iwconfig wlan0 essid ESSID
ubuntu:~# iwconfig wlan0 rate 11M

were succesful …

I read a bunch of documentation online concerning the wireless card troubles on Ubuntu, Gentoo, Debian etc.

Just few of all the resources I've read and tried are:

http://rtl-wifi.sourceforge.net/wiki/Main_Page (Returning empty page already a lot resource)
http://rtl8187b.sourceforge.net (A fork of rtl-wifi.sourceforge.net which is still available though it was not usable)

Some of the other resources which most of the people recommended as a way to properly install the RTL8187B wireless driver on linux was located on the website:

http://datanorth.net/~cuervo/rtl8187b/ (Trying to access this page returned a 404 error e.g. this page is no-longer usable)

I found even a webpage in Ubuntu Help which claimed to explain how to properly install and configure the RTL8187B wireless driver on which is below:

https://help.ubuntu.com/community/WifiDocs/Device/RealtekRTL8187b

Even the Ubuntu help instructions were pointing me to the broken cuervo's website URL

Anyways I was able to find the rtl8187b-modified-dist.tar.gz online and made a mirror of rtl8187b-modified-dist.tar.gz which you can download here

Another rtl8187b driver I found was on a toshiba website made especailly for the wireless linux drivers:

http://linux.toshiba-dme.co.jp/linux/eng/pc/sat_PSPD0_report.htm

The questionable file which was claimed to properly be able to make the Realtek Semiconductor Corp. RTL8187B Wireless Adapter to work out was called rl8187b-modified-804.tar.gz.
I've made a mirror of rtl8187b-modified-804.tar.gz is here

None of the driver archives rtl8187b-modified-dist.tar.gz and rl8187b-modified-804.tar.gz that was supposed to make the Toshiba L40 realtek wireless to work out, after compiling and installing the drivers from source worked out …

Both archives produced plenty of error messages and it seems on newer kernels like the one on this notebook:

Linux zlatina 2.6.35-28-generic #50-Ubuntu SMP Fri Mar 18 19:00:26 UTC 2011 i686 GNU/Linux, they're no longer usable.

The compile errors I got when I tried compiling the rtl8187b driver provided by the archive rtl8187b-modified-dist were:


root@ubuntu:/home/zlatina/rtl8187b-modified# sh makedrv
rm -fr *.mod.c *.mod *.o .*.cmd *.mod.* *.ko *.o *~
make -C /lib/modules/2.6.35-28-generic/build M=/home/zlatina/rtl8187b-modified/ieee80211 CC=gcc modules
make[1]: Entering directory `/usr/src/linux-headers-2.6.35-28-generic'
scripts/Makefile.build:49: *** CFLAGS was changed in "/home/zlatina/rtl8187b-modified/ieee80211/Makefile". Fix it to use EXTRA_CFLAGS. Stop.
make[1]: *** [_module_/home/zlatina/rtl8187b-modified/ieee80211] Error 2
make[1]: Leaving directory `/usr/src/linux-headers-2.6.35-28-generic'
make: *** [modules] Error 2
rm -fr *.mod.c *.mod *.o .*.cmd *.ko *~
make -C /lib/modules/2.6.35-28-generic/build M=/home/zlatina/rtl8187b-modified/rtl8187 CC=gcc modules
make[1]: Entering directory `/usr/src/linux-headers-2.6.35-28-generic'
scripts/Makefile.build:49: *** CFLAGS was changed in "/home/zlatina/rtl8187b-modified/rtl8187/Makefile". Fix it to use EXTRA_CFLAGS. Stop.
make[1]: *** [_module_/home/zlatina/rtl8187b-modified/rtl8187] Error 2
make[1]: Leaving directory `/usr/src/linux-headers-2.6.35-28-generic'
make: *** [modules] Error 2
root@ubuntu:/home/zlatina/rtl8187b-modified#

Another driver I tried which was found on aircrack-ng.org's website was rtl8187_linux_26.1010.zip

Here are the error messages I experienced while I tried to compile the realtek wireless driver from the archive rtl8187_linux_26.1010.0622.2006


compilation terminated.
make[2]: *** [/home/zlatina/rtl8187_linux_26.1010.0622.2006/beta-8187/r8187_core.o] Error 1
make[1]: *** [_module_/home/zlatina/rtl8187_linux_26.1010.0622.2006/beta-8187] Error 2
make[1]: Leaving directory `/usr/src/linux-headers-2.6.35-28-generic'
make: *** [modules] Error 2

I tried a number of fix ups hoping to solve the compile error messages, but my efforts were useless, as it seems many things has changed in newer Ubuntu versions and they could no longer be compiled.

As I realized I couldn't make the native drivers provided by the above sources compile, I decided to give a try to the Windows drivers for Realtek 8187B with ndiswrapper, a link for download of Realtek 8187B (RTL8187B_XP_6.1163.0331.2010_Win7_62.1182.0331.2010_UI_1.00.0179 is found here

I untarred the
RTL8187B_XP driver
and used ndiswrapper to load driver like so:


root@ubuntu:~# tar -zxvf
RTL8187B_XP_6.1163.0331.2010_Win7_....L.tar.gz
root@ubuntu:/home/zlatina/RTL8187B#
root@ubuntu:/home/zlatina/RTL8187B# cd Driver/WinXP
root@ubuntu:/home/zlatina/RTL8187B/Driver/WinXP# ndiswrapper -i net8187b.inf

In order to test the RTL8178B Windows driver I used:


root@ubuntu:~# ndiswrapper -l
net8187b : driver installed
device (0BDA:8197) present (alternate driver: rtl8187)

To finally load the Windows XP RTL8187B driver on the Ubuntu I used again ndiswrapper:


root@ubuntu:~# ndiswrapper -m

Further on I used the ndisgtk graphical ndiswrapper interface to once again test if the Windows driver is working on the Ubuntu and it seemed like it is working, however still my wicd was unable to find any wireless network ….

There were many online documentation which claimed that the driver for rtl8187b works out of the box on newer kernel releases (kernel versions > 2.6.24)

Finally I found out there is a driver which is a default one with the Ubuntu e.g. rtl8187.ko , I proceeded and loaded the module:


root@ubuntu:~# modprobe rtl8187

I also decided to check out if the hardware switch button of the Toshiba Satellite L40 notebook is not switched off and guess what ?! The Wireless ON/OFF button was switched OFF!!! OMG …

I switched on the button and wicd immediately started showing up the wireless networks …

To make the rtl8187 module load on Ubuntu boot up, I had to issue the command:


root@ubuntu:~# echo 'rtl8187' >> /etc/modules

Voila after all this struggle the wireless card is working now, it's sad I had to loose about 10 hours of time until I come with the simple solution of using the default provided ubuntu driver rtl8187 , what is strange is how comes that it does not load up automatically.

Thanks God it works now.

Fix “Approaching the limit on PV entries, consider increasing either the vm.pmap.shpgperproc or the vm.pmap.pv_entry_max tunable.” in FreeBSD

Monday, May 21st, 2012

bsdinstall-newboot-loader-menu-pv_entries_consider_increasing_vm_pmap_shpgrepproc

I'm running FreeBSD with Apache and PHP on it and I got in dmesg (kernel log), following error:

freebsd# dmesg|grep -i vm.pmap.shpgperproc
Approaching the limit on PV entries, consider increasing either the vm.pmap.shpgperproc or the vm.pmap.pv_entry_max tunable.

The exact FreeBSD, Apache and php versions I have installed are:
 

freebsd# uname -a ; httpd -V ; php –version
FreeBSD pcfreak 7.2-RELEASE-p4 FreeBSD 7.2-RELEASE-p4 #0: Fri Oct 2 12:21:39 UTC 2009 root@i386-builder.daemonology.net:/usr/obj/usr/src/sys/GENERIC i386
Server version: Apache/2.0.64
Server built: Mar 13 2011 23:36:25Server's Module Magic Number: 20050127:14
Server loaded: APR 0.9.19, APR-UTIL 0.9.19
Compiled using: APR 0.9.19, APR-UTIL 0.9.19
Architecture: 32-bit
Server compiled with….
-D APACHE_MPM_DIR="server/mpm/prefork"
-D APR_HAS_SENDFILE
-D APR_HAS_MMAP
-D APR_HAVE_IPV6 (IPv4-mapped addresses enabled)
-D APR_USE_FLOCK_SERIALIZE
-D APR_USE_PTHREAD_SERIALIZE
-D SINGLE_LISTEN_UNSERIALIZED_ACCEPT
-D APR_HAS_OTHER_CHILD
-D AP_HAVE_RELIABLE_PIPED_LOGS
-D HTTPD_ROOT="/usr/local"
-D SUEXEC_BIN="/usr/local/bin/suexec"
-D DEFAULT_PIDLOG="/var/run/httpd.pid"
-D DEFAULT_SCOREBOARD="logs/apache_runtime_status"
-D DEFAULT_LOCKFILE="/var/run/accept.lock"
-D DEFAULT_ERRORLOG="logs/error_log"
-D AP_TYPES_CONFIG_FILE="etc/apache2/mime.types"
-D SERVER_CONFIG_FILE="etc/apache2/httpd.conf"
PHP 5.3.5 with Suhosin-Patch (cli) (built: Mar 14 2011 00:29:17)
Copyright (c) 1997-2009 The PHP Group
Zend Engine v2.3.0, Copyright (c) 1998-2010 Zend Technologies
with eAccelerator v0.9.6.1, Copyright (c) 2004-2010 eAccelerator, by eAccelerator

After a bunch of research a FreeBSD forums thread , I've found the fix suggested by a guy.

The solution suggested in the forum is to raise up vm.pmap.pv_entry_ma to vm.pmap.pv_entry_max=1743504, however I've noticed this value is read only and cannot be changed on the BSD running kernel;

freebsd# sysctl vm.pmap.pv_entry_max=1743504
sysctl: oid 'vm.pmap.pv_entry_max' is read only

Instead to solve the;

Approaching the limit on PV entries, consider increasing either the vm.pmap.shpgperproc or the vm.pmap.pv_entry_max tunable.
, I had to add in /boot/loader.conf

vm.pmap.pde.mappings=68
vm.pmap.shpgperproc=500
vm.pmap.pv_entry_max=1743504

Adding this values through /boot/loader.conf set them on kernel boot time. I've seen also in the threads the consider increasing either the vm.pmap.shpgperproc is also encountered on FreeBSD hosts running Squid, Dansguardion and other web proxy softwares on busy hosts.

This problems are not likely to happen for people who are running latest FreeBSD releases (>8.3, 9.x), I've read in same above post in newer BSD kernels the vm.pmap is no longer existing in newer kernels.

Resolving “nf_conntrack: table full, dropping packet.” flood message in dmesg Linux kernel log

Wednesday, March 28th, 2012

nf_conntrack_table_full_dropping_packet
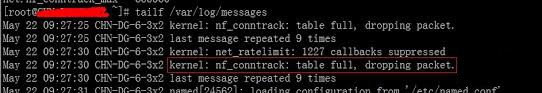
On many busy servers, you might encounter in /var/log/syslog or dmesg kernel log messages like

nf_conntrack: table full, dropping packet

to appear repeatingly:

[1737157.057528] nf_conntrack: table full, dropping packet.
[1737157.160357] nf_conntrack: table full, dropping packet.
[1737157.260534] nf_conntrack: table full, dropping packet.
[1737157.361837] nf_conntrack: table full, dropping packet.
[1737157.462305] nf_conntrack: table full, dropping packet.
[1737157.564270] nf_conntrack: table full, dropping packet.
[1737157.666836] nf_conntrack: table full, dropping packet.
[1737157.767348] nf_conntrack: table full, dropping packet.
[1737157.868338] nf_conntrack: table full, dropping packet.
[1737157.969828] nf_conntrack: table full, dropping packet.
[1737157.969928] nf_conntrack: table full, dropping packet
[1737157.989828] nf_conntrack: table full, dropping packet
[1737162.214084] __ratelimit: 83 callbacks suppressed

There are two type of servers, I've encountered this message on:

1. Xen OpenVZ / VPS (Virtual Private Servers)
2. ISPs – Internet Providers with heavy traffic NAT network routers
 

I. What is the meaning of nf_conntrack: table full dropping packet error message

In short, this message is received because the nf_conntrack kernel maximum number assigned value gets reached.
The common reason for that is a heavy traffic passing by the server or very often a DoS or DDoS (Distributed Denial of Service) attack. Sometimes encountering the err is a result of a bad server planning (incorrect data about expected traffic load by a company/companeis) or simply a sys admin error…

– Checking the current maximum nf_conntrack value assigned on host:

linux:~# cat /proc/sys/net/ipv4/netfilter/ip_conntrack_max
65536

– Alternative way to check the current kernel values for nf_conntrack is through:

linux:~# /sbin/sysctl -a|grep -i nf_conntrack_max
error: permission denied on key 'net.ipv4.route.flush'
net.netfilter.nf_conntrack_max = 65536
error: permission denied on key 'net.ipv6.route.flush'
net.nf_conntrack_max = 65536

– Check the current sysctl nf_conntrack active connections

To check present connection tracking opened on a system:

:

linux:~# /sbin/sysctl net.netfilter.nf_conntrack_count
net.netfilter.nf_conntrack_count = 12742

The shown connections are assigned dynamicly on each new succesful TCP / IP NAT-ted connection. Btw, on a systems that work normally without the dmesg log being flooded with the message, the output of lsmod is:

linux:~# /sbin/lsmod | egrep 'ip_tables|conntrack'
ip_tables 9899 1 iptable_filter
x_tables 14175 1 ip_tables

On servers which are encountering nf_conntrack: table full, dropping packet error, you can see, when issuing lsmod, extra modules related to nf_conntrack are shown as loaded:

linux:~# /sbin/lsmod | egrep 'ip_tables|conntrack'
nf_conntrack_ipv4 10346 3 iptable_nat,nf_nat
nf_conntrack 60975 4 ipt_MASQUERADE,iptable_nat,nf_nat,nf_conntrack_ipv4
nf_defrag_ipv4 1073 1 nf_conntrack_ipv4
ip_tables 9899 2 iptable_nat,iptable_filter
x_tables 14175 3 ipt_MASQUERADE,iptable_nat,ip_tables


II. Remove completely nf_conntrack support if it is not really necessery

It is a good practice to limit or try to omit completely use of any iptables NAT rules to prevent yourself from ending with flooding your kernel log with the messages and respectively stop your system from dropping connections.

Another option is to completely remove any modules related to nf_conntrack, iptables_nat and nf_nat.
To remove nf_conntrack support from the Linux kernel, if for instance the system is not used for Network Address Translation use:

/sbin/rmmod iptable_nat
/sbin/rmmod ipt_MASQUERADE
/sbin/rmmod rmmod nf_nat
/sbin/rmmod rmmod nf_conntrack_ipv4
/sbin/rmmod nf_conntrack
/sbin/rmmod nf_defrag_ipv4

Once the modules are removed, be sure to not use iptables -t nat .. rules. Even attempt to list, if there are any NAT related rules with iptables -t nat -L -n will force the kernel to load the nf_conntrack modules again.

Btw nf_conntrack: table full, dropping packet. message is observable across all GNU / Linux distributions, so this is not some kind of local distribution bug or Linux kernel (distro) customization.
 

III. Fixing the nf_conntrack … dropping packets error

– One temporary, fix if you need to keep your iptables NAT rules is:

linux:~# sysctl -w net.netfilter.nf_conntrack_max=131072

I say temporary, because raising the nf_conntrack_max doesn't guarantee, things will get smoothly from now on.
However on many not so heavily traffic loaded servers just raising the net.netfilter.nf_conntrack_max=131072 to a high enough value will be enough to resolve the hassle.

– Increasing the size of nf_conntrack hash-table

The Hash table hashsize value, which stores lists of conntrack-entries should be increased propertionally, whenever net.netfilter.nf_conntrack_max is raised.

linux:~# echo 32768 > /sys/module/nf_conntrack/parameters/hashsize
The rule to calculate the right value to set is:
hashsize = nf_conntrack_max / 4

– To permanently store the made changes ;a) put into /etc/sysctl.conf:

linux:~# echo 'net.netfilter.nf_conntrack_count = 131072' >> /etc/sysctl.conf
linux:~# /sbin/sysct -p

b) put in /etc/rc.local (before the exit 0 line):

echo 32768 > /sys/module/nf_conntrack/parameters/hashsize

Note: Be careful with this variable, according to my experience raising it to too high value (especially on XEN patched kernels) could freeze the system.
Also raising the value to a too high number can freeze a regular Linux server running on old hardware.

– For the diagnosis of nf_conntrack stuff there is ;

/proc/sys/net/netfilter kernel memory stored directory. There you can find some values dynamically stored which gives info concerning nf_conntrack operations in "real time":

linux:~# cd /proc/sys/net/netfilter
linux:/proc/sys/net/netfilter# ls -al nf_log/

total 0
dr-xr-xr-x 0 root root 0 Mar 23 23:02 ./
dr-xr-xr-x 0 root root 0 Mar 23 23:02 ../
-rw-r--r-- 1 root root 0 Mar 23 23:02 0
-rw-r--r-- 1 root root 0 Mar 23 23:02 1
-rw-r--r-- 1 root root 0 Mar 23 23:02 10
-rw-r--r-- 1 root root 0 Mar 23 23:02 11
-rw-r--r-- 1 root root 0 Mar 23 23:02 12
-rw-r--r-- 1 root root 0 Mar 23 23:02 2
-rw-r--r-- 1 root root 0 Mar 23 23:02 3
-rw-r--r-- 1 root root 0 Mar 23 23:02 4
-rw-r--r-- 1 root root 0 Mar 23 23:02 5
-rw-r--r-- 1 root root 0 Mar 23 23:02 6
-rw-r--r-- 1 root root 0 Mar 23 23:02 7
-rw-r--r-- 1 root root 0 Mar 23 23:02 8
-rw-r--r-- 1 root root 0 Mar 23 23:02 9


IV. Decreasing other nf_conntrack NAT time-out values to prevent server against DoS attacks

Generally, the default value for nf_conntrack_* time-outs are (unnecessery) large.
Therefore, for large flows of traffic even if you increase nf_conntrack_max, still shorty you can get a nf_conntrack overflow table resulting in dropping server connections. To make this not happen, check and decrease the other nf_conntrack timeout connection tracking values:

linux:~# sysctl -a | grep conntrack | grep timeout
net.netfilter.nf_conntrack_generic_timeout = 600
net.netfilter.nf_conntrack_tcp_timeout_syn_sent = 120
net.netfilter.nf_conntrack_tcp_timeout_syn_recv = 60
net.netfilter.nf_conntrack_tcp_timeout_established = 432000
net.netfilter.nf_conntrack_tcp_timeout_fin_wait = 120
net.netfilter.nf_conntrack_tcp_timeout_close_wait = 60
net.netfilter.nf_conntrack_tcp_timeout_last_ack = 30
net.netfilter.nf_conntrack_tcp_timeout_time_wait = 120
net.netfilter.nf_conntrack_tcp_timeout_close = 10
net.netfilter.nf_conntrack_tcp_timeout_max_retrans = 300
net.netfilter.nf_conntrack_tcp_timeout_unacknowledged = 300
net.netfilter.nf_conntrack_udp_timeout = 30
net.netfilter.nf_conntrack_udp_timeout_stream = 180
net.netfilter.nf_conntrack_icmp_timeout = 30
net.netfilter.nf_conntrack_events_retry_timeout = 15
net.ipv4.netfilter.ip_conntrack_generic_timeout = 600
net.ipv4.netfilter.ip_conntrack_tcp_timeout_syn_sent = 120
net.ipv4.netfilter.ip_conntrack_tcp_timeout_syn_sent2 = 120
net.ipv4.netfilter.ip_conntrack_tcp_timeout_syn_recv = 60
net.ipv4.netfilter.ip_conntrack_tcp_timeout_established = 432000
net.ipv4.netfilter.ip_conntrack_tcp_timeout_fin_wait = 120
net.ipv4.netfilter.ip_conntrack_tcp_timeout_close_wait = 60
net.ipv4.netfilter.ip_conntrack_tcp_timeout_last_ack = 30
net.ipv4.netfilter.ip_conntrack_tcp_timeout_time_wait = 120
net.ipv4.netfilter.ip_conntrack_tcp_timeout_close = 10
net.ipv4.netfilter.ip_conntrack_tcp_timeout_max_retrans = 300
net.ipv4.netfilter.ip_conntrack_udp_timeout = 30
net.ipv4.netfilter.ip_conntrack_udp_timeout_stream = 180
net.ipv4.netfilter.ip_conntrack_icmp_timeout = 30

All the timeouts are in seconds. net.netfilter.nf_conntrack_generic_timeout as you see is quite high – 600 secs = (10 minutes).
This kind of value means any NAT-ted connection not responding can stay hanging for 10 minutes!

The value net.netfilter.nf_conntrack_tcp_timeout_established = 432000 is quite high too (5 days!)
If this values, are not lowered the server will be an easy target for anyone who would like to flood it with excessive connections, once this happens the server will quick reach even the raised up value for net.nf_conntrack_max and the initial connection dropping will re-occur again …

With all said, to prevent the server from malicious users, situated behind the NAT plaguing you with Denial of Service attacks:

Lower net.ipv4.netfilter.ip_conntrack_generic_timeout to 60 – 120 seconds and net.ipv4.netfilter.ip_conntrack_tcp_timeout_established to stmh. like 54000

linux:~# sysctl -w net.ipv4.netfilter.ip_conntrack_generic_timeout = 120
linux:~# sysctl -w net.ipv4.netfilter.ip_conntrack_tcp_timeout_established = 54000

This timeout should work fine on the router without creating interruptions for regular NAT users. After changing the values and monitoring for at least few days make the changes permanent by adding them to /etc/sysctl.conf

linux:~# echo 'net.ipv4.netfilter.ip_conntrack_generic_timeout = 120' >> /etc/sysctl.conf
linux:~# echo 'net.ipv4.netfilter.ip_conntrack_tcp_timeout_established = 54000' >> /etc/sysctl.conf

How to detect failing storage LUN on Linux – multipath

Wednesday, April 16th, 2014

detect-failing-lun-on-linux-failing-scsi-detection

If you login to server and after running dmesg – show kernel log command you get tons of messages like:

# dmesg


end_request: I/O error, dev sdc, sector 0
sd 0:0:0:1: SCSI error: return code = 0x00010000
end_request: I/O error, dev sdb, sector 0
sd 0:0:0:0: SCSI error: return code = 0x00010000
end_request: I/O error, dev sda, sector 0
sd 0:0:0:2: SCSI error: return code = 0x00010000
end_request: I/O error, dev sdc, sector 0
sd 0:0:0:1: SCSI error: return code = 0x00010000
end_request: I/O error, dev sdb, sector 0
sd 0:0:0:0: SCSI error: return code = 0x00010000
end_request: I/O error, dev sda, sector 0
sd 0:0:0:2: SCSI error: return code = 0x00010000
end_request: I/O error, dev sdc, sector 0
sd 0:0:0:1: SCSI error: return code = 0x00010000
end_request: I/O error, dev sdb, sector 0
sd 0:0:0:0: SCSI error: return code = 0x00010000
end_request: I/O error, dev sda, sector 0


In /var/log/messages there are also log messages present like:

# cat /var/log/messages
...


Apr 13 09:45:49 sl02785 kernel: end_request: I/O error, dev sda, sector 0
Apr 13 09:45:49 sl02785 kernel: klogd 1.4.1, ———- state change ———-
Apr 13 09:45:50 sl02785 kernel: sd 0:0:0:1: SCSI error: return code = 0x00010000
Apr 13 09:45:50 sl02785 kernel: end_request: I/O error, dev sdb, sector 0
Apr 13 09:45:55 sl02785 kernel: sd 0:0:0:2: SCSI error: return code = 0x00010000
Apr 13 09:45:55 sl02785 kernel: end_request: I/O error, dev sdc, sector 0


This is a sure sign something is wrong with SCSI hard drives or SCSI controller, to further debug the situation you can use the multipath command, i.e.:


multipath -ll | grep -i failed
_ 0:0:0:2 sdc 8:32 [failed][faulty]
_ 0:0:0:1 sdb 8:16 [failed][faulty]
_ 0:0:0:0 sda 8:0 [failed][faulty]


As you can see all 3 drives merged (sdc, sdb and sda) to show up on 1 physical drive via the remote network connectedLUN to the server is showing as faulty. This is a clear sign something is either wrong with 3 hard drive members of LUN – (Logical Unit Number) (which is less probable)  or most likely there is problem with the LUN network  SCSI controller. It is common error that LUN SCSI controller optics cable gets dirty and needs a physical clean up to solve it.

In case you don't know what is storage LUN? – In computer storage, a logical unit number, or LUN, is a number used to identify a logical unit, which is a device addressed by the SCSI protocol or protocols which encapsulate SCSI, such as Fibre Channel or iSCSI. A LUN may be used with any device which supports read/write operations, such as a tape drive, but is most often used to refer to a logical disk as created on a SAN. Though not technically correct, the term "LUN" is often also used to refer to the logical disk itself.

What LUN's does is very similar to Linux's Software LVM (Logical Volume Manager).

Install VMWare tools on Debian and Ubuntu Linux – Enable VMWare Fullscreen and copy paste between OS host and Virtual machine

Wednesday, May 28th, 2014

install-vmware-tools-on-debian-gnu-linux-and-ubuntu-howto

If you need to use Virtual Machine to run some testing on heterogenous Operating Systems and you have chosen VMWare as a Virtual Machine. You will soon notice some of Virtual Machines functionality like copy between host operating system and Virtual Machine, true fullscreen mode and most importantly Copy paste between your host operating system and VMWare is not working. I'm not too much into Virtualization these days so for me it was truely shocking that a proprietary software like VMWare, claimed to be the best and most efficient Virtual Machine nowadays is not supporting copy / paste, fullscreen and copy between host and guest OS.  For those arguing why I'm using VMWare at all as it is proprietary and there is already free software Virtual Machines like QEMU and Oracle's VirtualBox its simply because now I have the chance to install and use VMWare 9 Enterprise on my work place at HP with a free Corporate license – in other words I'm using VMWare just for the sake of educating myself and would always recommend VirtualBox for those looking for good substitute free alternative to VMWare.

Before trying out VMWare, I tried Virtualbox to emulate Linux on my HP work PC running Windows with VirtualBox I was having issues with keyboard not working (because of lack of support of USB, no full screen support and lack of copy / paste between OS-es), I've just recently understood this is not because Virtualbox is bad Virtualization solution but because I forgot to install VirtualBox Oracle VM VirtualBox Extension Pack which allows support for USB, enables copy paste and full screen support. The equivalent to Virtualbox Oracle VM VirtualBox in VMWare world is called VMWare-Tools and once the guest operating system is installed inside VMWare VM, its necessary to install vmware-tools to enable better screen resolution and copy paste.
 

In Windows Virtual Machine installation of vmware-tools is pretty straight forward you go through VMWare's menus


VM -> Install Vmware-tools

install-vmware-tools-on-linux-guest-host-os-debian-redhat-screenshot

follow the instructions and you're done, however as always installing VMWare-tools on Linux is little bit more complicated you need to run few commands from Linux installed inside the Virtual Machine to install vmware-tools. Here is how vmware-tools is installed on Debian / Ubuntu / Linux Mint and rest of Debian based operating systems:

  1. Install Build essentials and gcc You need to have this installed some developer tools as well as GCC compiler in order for the vmware-tools to compile a special Linux kernel module which enables extra support (integration) between the VMWare VM and the installed inside VM Linux distro

apt-get install --yes build-essential gcc
...

2. Install appropriate Linux headers corresponding to current Linux OS installed kernel

apt-get install --yes linux-headers-$(uname -r)
....

3. Mount CD (Virtual) Content to obtain the vmware-tools version for your Linux

Be sure to have first checked from VMWare menus on menus VM -> Intall Vmware Tools
This step is a little bit strange but just do it without too much questioning …


mount /dev/cdrom /mnt/
umount /media/cdrom0/
mount /media/cdrom
mount /dev/sr0 /mnt/cdrom/
mount /dev/sr0 /mnt/


Note that /dev/sr0, might already be mounted and sometimes it might be necessary to unmount it first (don't remember exactly if I unmounted it or not)

4. Copy and Untar VMwareTools-9.2.0-799703.tar.gz

cp -rpf /media/cdrom/VMwareTools-9.2.0-799703.tar.gz /tmp/
cd /tmp/
tar -zxvvf VMwareTools-9.2.0-799703.tar.gz
...

5. Run vmware-tools installer

cd vmware-tools-distrib/
./vmware-install.pl

You will be asked multiple questions you can safely press enter to answer with default settings to all settings, hopefully if all runs okay this will make VMWare Tools installed
 

Creating a new VMware Tools installer database using the tar4 format.
Installing VMware Tools.
In which directory do you want to install the binary files?
[/usr/bin]
What is the directory that contains the init directories (rc0.d/ to rc6.d/)?
[/etc]
What is the directory that contains the init scripts?
[/etc/init.d]
In which directory do you want to install the daemon files?
[/usr/sbin]
In which directory do you want to install the library files?
[/usr/lib/vmware-tools]
The path "/usr/lib/vmware-tools" does not exist currently. This program is
going to create it, including needed parent directories. Is this what you want?
[yes]
In which directory do you want to install the documentation files?
[/usr/share/doc/vmware-tools]
The path "/usr/share/doc/vmware-tools" does not exist currently. This program
is going to create it, including needed parent directories. Is this what you
want? [yes]
The installation of VMware Tools 9.2.0 build-799703 for Linux completed
successfully. You can decide to remove this software from your system at any
time by invoking the following command: "/usr/bin/vmware-uninstall-tools.pl".
Before running VMware Tools for the first time, you need to configure it by
invoking the following command: "/usr/bin/vmware-config-tools.pl". Do you want
this program to invoke the command for you now? [yes]
Initializing…
Making sure services for VMware Tools are stopped.
Stopping VMware Tools services in the virtual machine:
Guest operating system daemon: done
Unmounting HGFS shares: done
Guest filesystem driver: done
[EXPERIMENTAL] The VMware FileSystem Sync Driver (vmsync) is a new feature that creates backups of virtual machines. Please refer to the VMware Knowledge Base for more details on this capability. Do you wish to enable this feature?
[no]
Before you can compile modules, you need to have the following installed…
make
gcc
kernel headers of the running kernel
Searching for GCC…
Detected GCC binary at "/usr/bin/gcc-4.6".
The path "/usr/bin/gcc-4.6" appears to be a valid path to the gcc binary.
Would you like to change it? [no]
Searching for a valid kernel header path…
Detected the kernel headers at "/lib/modules/3.2.0-4-amd64/build/include".
The path "/lib/modules/3.2.0-4-amd64/build/include" appears to be a valid path
to the 3.2.0-4-amd64 kernel headers.
Would you like to change it? [no]
The vmblock enables dragging or copying files between host and guest in a
Fusion or Workstation virtual environment. Do you wish to enable this feature?
[no] yes
make: Leaving directory `/tmp/vmware-root/modules/vmblock-only'

No X install found.
Creating a new initrd boot image for the kernel.
update-initramfs: Generating /boot/initrd.img-3.2.0-4-amd64
Checking acpi hot plug done
Starting VMware Tools services in the virtual machine:
Switching to guest configuration: done
VM communication interface: done
VM communication interface socket family: done
File system sync driver: done
Guest operating system daemon: done
The configuration of VMware Tools 8.6.10 build-913593 for Linux for this
running kernel completed successfully.
You must restart your X session before any mouse or graphics changes take
effect.
You can now run VMware Tools by invoking "/usr/bin/vmware-toolbox-cmd" from the
command line or by invoking "/usr/bin/vmware-toolbox" from the command line
during an X server session.
To enable advanced X features (e.g., guest resolution fit, drag and drop, and
file and text copy/paste), you will need to do one (or more) of the following:
1. Manually start /usr/bin/vmware-user
2. Log out and log back into your desktop session; and,
3. Restart your X session.
Enjoy,
–the VMware team
Found VMware Tools CDROM mounted at /mnt. Ejecting device /dev/sr0 …

.To make sure vmware-tools compiled modules are loaded into Linux kernel inside VM, restart the Virtual Machine. Once Linux boots again and you login to gnome-terminal to check what is vmware-tools status (e.g. if properly loaded) run:

service vmware-tools status
vmtoolsd is running

install-vmware-tools-on-debian-gnu-linux-and-ubuntu-virtual-machine-screenshot

This method of installing works on Debian 7 (Wheezy) but same steps should work on any Ubuntu and rest of Debian derivatives. For Redhat (RPM) based Linux distributions to install vmware-tools after mounting cdrom drive following above instructions you will have an rpm package instead of .tar.gz archive so all you have to do is install the rpm, e.g. launch smth. like:

rpm -Uhv /mnt/cdrom/VMwareTools-9.2.0-799703.i386.rpm
Cheers 😉

How to determine which processes make most writes on the hard drive in GNU / Linux using kernel variable

Thursday, November 13th, 2014

how-to-determine-which-processes-writes-most-to-hard-drive-Linux-Kernel
In Linux there are plenty of tools to measure input / ouput – read / write server bottlenecks. Just to mention a few such are, the native part of all Linux distributions IOSTAT – which is a great tool to measure hard disk bottlenecks. However as iostat requires certain sysadmin skills for novice sys-admins, there is also ofcourse more interactive tools such as DSTAT or even better GLANCE which monitors not only disk writes but memory use, CPU load and Network use.

This tools can help you measure which processes are writting most (a lot) to hard disk drive but there is another quick and efficient way to track disk i/o by directly using the Linux kernel this is done via kernel parameter :

/proc/sys/vm/block_dump

To enable block_dump kernel logging:

echo 1 > /proc/sys/vm/block_dump

To later track in real time output from kernel interactively on which running process calling the kernel is writing to server hard drive
 

tail -f /var/log/syslog

The output  looks like so:
 

Nov 13 12:25:51 pcfreak kernel: [1075037.701056] kjournald(297): WRITE block 482293496 on sda1
Nov 13 12:25:51 pcfreak kernel: [1075037.701059] kjournald(297): WRITE block 482293504 on sda1
Nov 13 12:25:51 pcfreak kernel: [1075037.701062] kjournald(297): WRITE block 482293512 on sda1
Nov 13 12:25:51 pcfreak kernel: [1075037.701066] kjournald(297): WRITE block 482293520 on sda1
Nov 13 12:25:51 pcfreak kernel: [1075037.701069] kjournald(297): WRITE block 482293528 on sda1
Nov 13 12:25:51 pcfreak kernel: [1075037.701072] kjournald(297): WRITE block 482293536 on sda1
Nov 13 12:25:51 pcfreak kernel: [1075037.702824] kjournald(297): WRITE block 482293544 on sda1
Nov 13 12:25:52 pcfreak kernel: [1075039.219288] apache2(3377): dirtied inode 3571740 (_index.html.old) on sda1
Nov 13 12:25:52 pcfreak kernel: [1075039.436133] mysqld(22945): dirtied inode 21546676 (#sql_c0a_0.MYI) on sda1
Nov 13 12:25:52 pcfreak kernel: [1075039.436826] mysqld(22945): dirtied inode 21546677 (#sql_c0a_0.MYD) on sda1
Nov 13 12:25:53 pcfreak kernel: [1075039.662832] mysqld(22945): dirtied inode 21546676 (#sql_c0a_0.MYI) on sda1
Nov 13 12:25:53 pcfreak kernel: [1075039.663297] mysqld(22945): dirtied inode 21546677 (#sql_c0a_0.MYD) on sda1
Nov 13 12:25:53 pcfreak kernel: [1075039.817120] apache2(3377): dirtied inode 3571754 (_index.html) on sda1
Nov 13 12:25:53 pcfreak kernel: [1075039.819968] apache2(3377): dirtied inode 3571740 (_index.html_gzip) on sda1
Nov 13 12:25:53 pcfreak kernel: [1075039.820016] apache2(3377): dirtied inode 3571730 (?) on sda1
Nov 13 12:25:53 pcfreak kernel: [1075040.491378] mysqld(22931): dirtied inode 21546676 (#sql_c0a_0.MYI) on sda1
Nov 13 12:25:53 pcfreak kernel: [1075040.492309] mysqld(22931): dirtied inode 21546677 (#sql_c0a_0.MYD) on sda1
Nov 13 12:25:54 pcfreak kernel: [1075041.551513] apache2(3377): dirtied inode 1474706 (_index.html_gzip.old) on sda1
Nov 13 12:25:54 pcfreak kernel: [1075041.551566] apache2(3377): dirtied inode 1474712 (_index.html.old) on sda1
Nov 13 12:25:55 pcfreak kernel: [1075041.769036] mysqld(22941): dirtied inode 21546676 (#sql_c0a_0.MYI) on sda1
Nov 13 12:25:55 pcfreak kernel: [1075041.769804] mysqld(22941): dirtied inode 21546677 (#sql_c0a_0.MYD) on sda1
Nov 13 12:25:55 pcfreak kernel: [1075041.985857] apache2(3282): dirtied inode 4063282 (data_9d97a7f62d54bc5fd791fba3245ba591-SMF-modSettings.php) on sda1
Nov 13 12:25:55 pcfreak kernel: [1075041.987460] apache2(3282): dirtied inode 29010186 (data_9d97a7f62d54bc5fd791fba3245ba591-SMF-permissions–1.php) on sda1
Nov 13 12:25:55 pcfreak kernel: [1075041.988357] flush-8:0(289): WRITE block 51350632 on sda1

Using the kernel method to see which processes are stoning your server is great way especially for servers without connectivity to the Internet where you have no possibility to install sysstat package (contaning iostat),  dstat or glance.
Thanks to Marto's blog for  this nice hack.