Posts Tagged ‘Linux-es’

How to start / Stop and Analyze system services and improve Linux system boot time performance

Friday, July 5th, 2019

systemd-components-systemd-utilities-targets-cores-libraries
This post is going to be a very short one and to walk through shortly to System V basic start / stop remove service old way and the new ways introduced over the last 10 years or so with the introduction of systemd on mass base across Linux distributions.
Finally I'll give you few hints on how to check (analyze) the boot time performance on a modern GNU / Linux system that is using systemd enabled services.
 

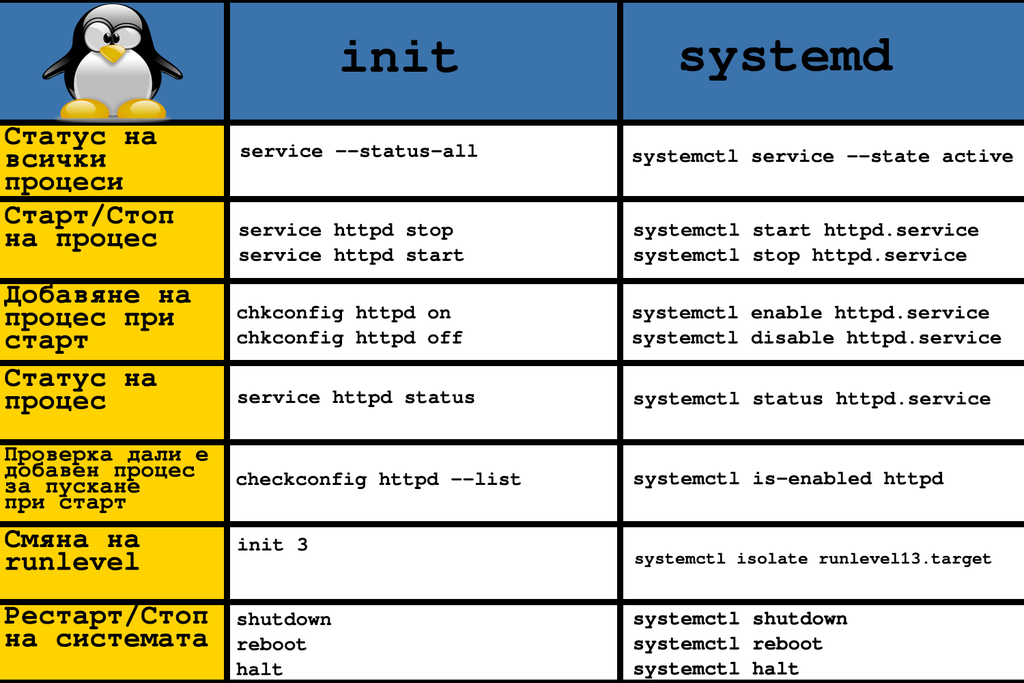
1. System V and the old days few classic used ways to stop / start / restart services (runlevels and common wrapper scripts)


The old fashioned days when Linux was using SystemV / e.g. no SystemD used way was to just go through all the running services with following the run script logic inside the runlevel the system was booting, e.g. to check runlevel and then potimize each and every run script via the respective location of the bash service init scripts:


root@noah:/home/hipo# /sbin/runlevel 
N 5


Or on some RPM based distros like Fedora / RHEL / SUSE Enterprise Linux to use chkconfig command, e.g. list services:

~]# chkconfig –list

etworkManager  0:off   1:off   2:on    3:on    4:on    5:on    6:off
abrtd           0:off   1:off   2:off   3:on    4:off   5:on    6:off
acpid           0:off   1:off   2:on    3:on    4:on    5:on    6:off
anamon          0:off   1:off   2:off   3:off   4:off   5:off   6:off
atd             0:off   1:off   2:off   3:on    4:on    5:on    6:off
auditd          0:off   1:off   2:on    3:on    4:on    5:on    6:off
avahi-daemon    0:off   1:off   2:off   3:on    4:on    5:on    6:off

And to start stop the service into (default runlevel) or respective runlevel:


~]#  chkconfig httpd on

~]# chkconfig –list httpd
httpd            0:off   1:off   2:on    3:on    4:on    5:on    6:off


~]# chkconfig service_name on –level runlevels


Debian / Ubuntu and other .deb based distributions with System V (which executes scripts without single order but one by one) are not having natively chkconfig but instead are famous for update-rc.d init script wrapper, here is few basic use  of it:

update-rc.d <service> defaults
update-rc.d <service> start 20 3 4 5
update-rc.d -f <service>  remove

Here defaults means default set boot runtime for system and numbers are just whether service is started or stopped for respective runlevels. To check what is your default one simply run /sbin/runlevel

Other useful tool to stop / start services and analyze what service is running and which not in real time (but without modifying boot time set for a service) – more universal nowadays is to use the service command.

root@noah:/home/hipo# service –status-all
 [ + ]  acpid
 [ – ]  alsa-utils
 [ – ]  anacron
 [ + ]  apache-htcacheclean
 [ – ]  apache2
 [ + ]  atd
 [ + ]  aumix

root@noah:/home/hipo# service cron restart/usr/sbin/service command is just a simple wrapper bash shell script that takes care about start / stop etc. operations of scripts found under /etc/init.d

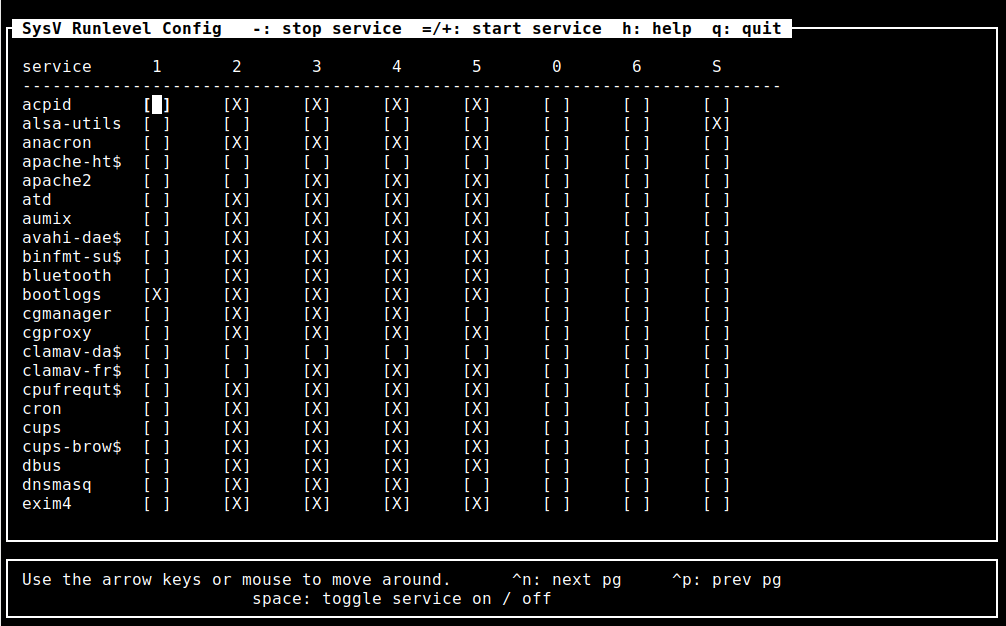
For those who don't want to tamper with too much typing and manual configuration there is an all distribution system V compatible ncurses interface text itnerface sysv-rc-conf which could make your life easier on configuring services on non-systemd (old) Linux-es.

To install on Debian distros:

debian:~# apt-get install sysv-rc-conf

debian:~# sysv-rc-conf


SysV RC Conf desktop on GNU Linux using sysv-rc-conf systemV and systemd
 

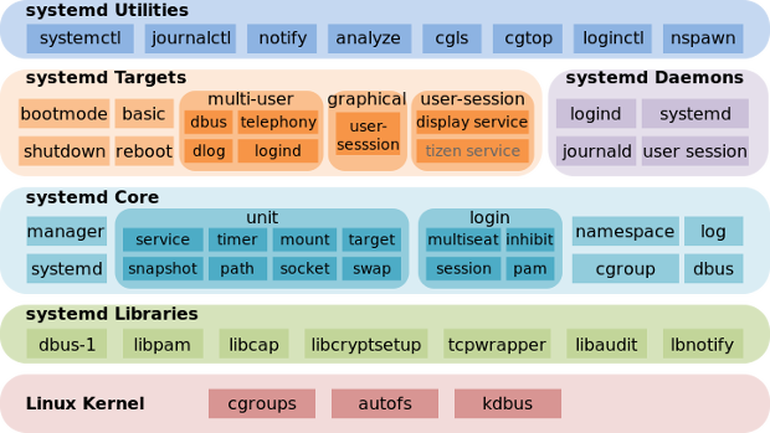
2. SystemD basic use Start / stop check service and a little bit of information
for the novice

As most Linux kernel based distributions except some like Slackware and few others see the full list of Linux distributions without systemd (and aha yes slackw. users loves rc.local so much – we all do 🙂  migrated and are nowadays using actively SystemD, to start / stop analyze running system runnig services / processes

systemctl – Control the systemd system and service manager

To check whether a service is enabled

systemctl is-active application.service

To check whether a unit is in a failed state

systemctl is-failed application.service

To get a status of running application via systemctl messaging

# systemctl status sshd
● ssh.service – OpenBSD Secure Shell server Loaded: loaded (/lib/systemd/system/ssh.service; enabled; vendor preset: enabled) Active: active (running) since Sat 2019-07-06 20:01:02 EEST; 2h 3min ago Main PID: 1335 (sshd) Tasks: 1 (limit: 4915) CGroup: /system.slice/ssh.service └─1335 /usr/sbin/sshd -D юли 06 20:01:00 noah systemd[1]: Starting OpenBSD Secure Shell server… юли 06 20:01:02 noah sshd[1335]: Server listening on 0.0.0.0 port 22. юли 06 20:01:02 noah sshd[1335]: Server listening on :: port 22. юли 06 20:01:02 noah systemd[1]: Started OpenBSD Secure Shell server.

To enable / disable application with systemctl systemctl enable application.service

systemctl disable application.service

To stop / start given application systemcl stop sshd

systemctl stop tor

To reload running application

systemctl reload sshd

Some applications does not have the right functionality in systemd script to reload configuration without fully restarting the app if this is the case use systemctl reload-or-restart application.service

systemctl list-unit-files

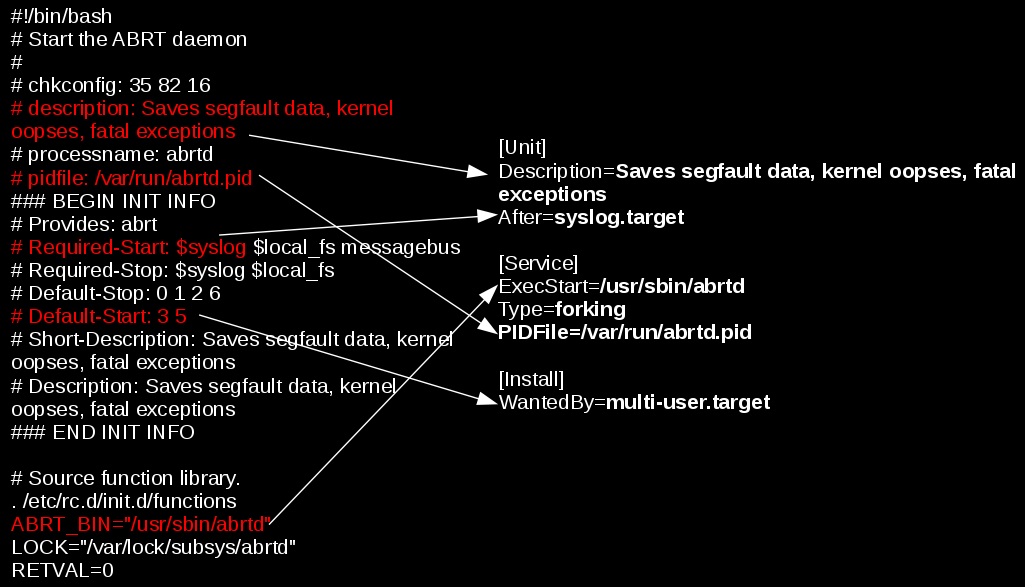
Then to view the content of a single service unit file:

:~# systemctl cat apache2.service
# /lib/systemd/system/apache2.service
[Unit]
Description=The Apache HTTP Server
After=network.target remote-fs.target nss-lookup.target

[Service]
Type=forking
Environment=APACHE_STARTED_BY_SYSTEMD=true
ExecStart=/usr/sbin/apachectl start
ExecStop=/usr/sbin/apachectl stop
ExecReload=/usr/sbin/apachectl graceful
PrivateTmp=true
Restart=on-abort

[Install]
WantedBy=multi-user.target


converting-traditional-init-scripts-to-systemd-graphical-diagram

systemd's advancement over normal SystemV services it is able to track and show dependencies
of a single run service for proper operation on other services

:~# systemctl list-dependencies sshd.service


● ├─system.slice
● └─sysinit.target
●   ├─dev-hugepages.mount
●   ├─dev-mqueue.mount
●   ├─keyboard-setup.service
●   ├─kmod-static-nodes.service
●   ├─proc-sys-fs-binfmt_misc.automount
●   ├─sys-fs-fuse-connections.mount
●   ├─sys-kernel-config.mount
●   ├─sys-kernel-debug.mount
●   ├─systemd-ask-password-console.path
●   ├─systemd-binfmt.service
….

.


You can also mask / unmask service e.g. make it temporary unavailable via systemd with

sudo systemctl mask nginx.service

it will then appear as masked if you do list-unit-files

If you want to change something on a systemd unit file this is done with

systemctl edit –full nginx.service

In case if some modificatgion was done to systemd service files e.g. lets say to
/etc/systemd/system/apache2.service or even you've made a Linux system Upgrade recently
that added extra systemd service config files it will be necessery to reload all files
present in /etc/systemd/system/* with:

systemctl daemon-reload


Systemd has a target states which are pretty similar to the runlevel concept (e.g. runlevel 5 means graphical etc.), for example to check the default target for a system:

One very helpful feature is to restart systemd but it seems this is not well documented as of now and though this might work after some system package upgrade roll-outs it is always better to reboot the system, but you can give it a try if restart can't be done due to application criticallity.

To restart systemd and its spawned subprocesses do:
 

systemctl daemon-reexec


root@noah:/home/hipo# systemctl get-default
graphical.target


 to check all targets possible targets

root@noah:/home/hipo# systemctl list-unit-files –type=target
UNIT FILE                 STATE   
basic.target              static  
bluetooth.target          static  
busnames.target           static  
cryptsetup-pre.target     static  
cryptsetup.target         static  
ctrl-alt-del.target       disabled
default.target            static  
emergency.target          static  
exit.target               disabled
final.target              static  
getty.target              static  
graphical.target          static  

you can put the system in Single user mode if you like without running the good old well known command:

/sbin/init 1 

command with

systemctl rescue

You can even shutdown / poweroff / reboot system via systemctl (though I never did that and I don't recommend) 🙂
To do so use:

systemctl halt
systemctl poweroff
systemctl reboot


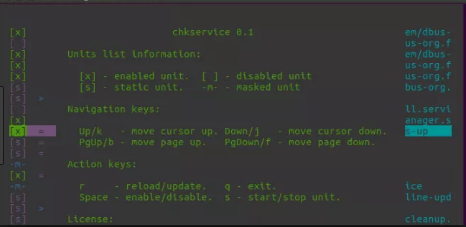
For the lazy ones that don't want to type all the time like crazy to configure and manage simple systemctl set services take a look at chkservice – an ncurses text based menu systemctl management interface

As chkservice is relatively new it is still not present in stable Stretch Debian repositories but it is in current testing Debian unstable Buster / Sid – Testing / Unstable distribution and has installable package for Ubuntu / Arch Linux and Fedora

chkservice-Linux-systemctl-ncurses-text-menu-service-management-interface-start-chkservice
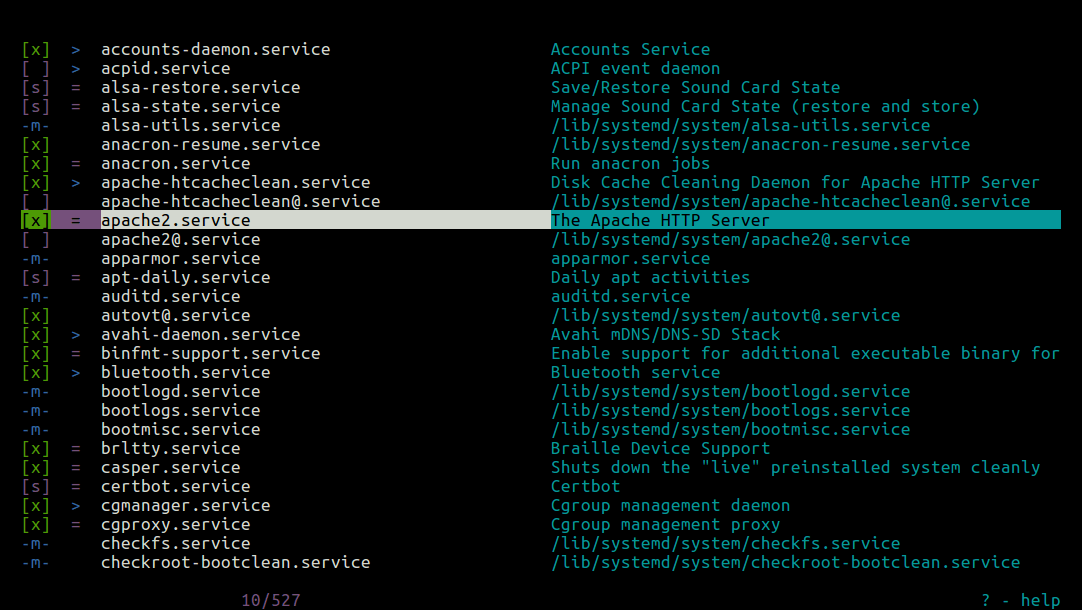
Picture Source Tecmint.com

chkservice linux help screen


3. Analyzing and fix performance boot slowness issues due to a service taking long to boot


The first very useful thing is to know how long exactly all daemons / services got booted
on your GNU / Linux OS.

linux-server:~# systemd-analyze 
Startup finished in 4.135s (kernel) + 3min 47.863s (userspace) = 3min 51.998s

As you can see it reports both the kernel boot time and userspace (surrounding services
that had to boot for the system to be considered fully booted).


Once you have the system properly booted you have a console or / ssh access

root@pcfreak:/home/hipo# systemd-analyze blame
    2min 14.172s tor@default.service
    1min 40.455s docker.service
     1min 3.649s fail2ban.service
         58.806s nmbd.service
         53.992s rc-local.service
         51.458s systemd-tmpfiles-setup.service
         50.495s mariadb.service
         46.348s snort.service
         34.910s ModemManager.service
         33.748s squid.service
         32.226s ejabberd.service
         28.207s certbot.service
         28.104s networking.service
         23.639s munin-node.service
         20.917s smbd.service
         20.261s tinyproxy.service
         19.981s accounts-daemon.service
         18.501s loadcpufreq.service
         16.756s stunnel4.service
         15.575s oidentd.service
         15.376s dev-sda1.device
         15.368s courier-authdaemon.service
         15.301s sysstat.service
         15.154s gpm.service
         13.276s systemd-logind.service
         13.251s rsyslog.service
         13.240s lpd.service
         13.237s pppd-dns.service
         12.904s NetworkManager-wait-online.service
         12.540s lm-sensors.service
         12.525s watchdog.service
         12.515s inetd.service


As you can see you get a list of services time took to boot in secs and you can
further debug each of it to find out why it boots so slow (netwok / DNS / configuration isssue whatever).

On a servers it is useful to look up for some processes slowing it down like gdm.service etc.


Close up words rant on SystemD vs SysemV

init-and-systemd-comparison-commands-linux-booting-1

A lot could be ranted on what is better systemd or systemV. I personally hated systemd since day since I saw it being introduced first in Fedora / CentOS linuxes and a bit later in my beloved desktop used Debian Linux.
I still remember the bugs and headaches with systemd's intruduction as it is with all new the early adoption of technology makes a lot of pain in the ass.
Eventually systemd has become a standard and with my employment as a contractor through Itelligence GmBH for SAP AG I now am forced to work with systemd daily on SLES 12 based Linuces and I was forced to get used to it. 
But still there is my personal preference to SystemV even though the critics of slow boot etc.but for managing a multitude of Linux preinstalled servers like Virtual Machines and trying to standardize a Data Center with Tens of Thousands of Linuxes running on different Hypervisors VMWare / OpenXen + physical hosts etc. systemd brings a bit of more standardization that makes it a winner.

How much memory users uses in GNU / Linux and FreeBSD – Commands and Scripts to find user memory usage on Linux

Tuesday, February 17th, 2015


how-much-memory-users-use-in-gnu-linux-freebsd-command-to-find-and-show-ascending-descending-usage-of-system-memory-tux-memory-logo


If you have to administrate a heterogenous network with Linux and FreeBSD or other UNIX like OSes you should sooner or later need for scripting purposes to have a way to list how much memory separate users take up on your system. Listing memory usage per user is very helpful for admins who manager free-shells or for companies where you have developers, developing software directly on the server via ssh. Being able to check which process eats up most memory is essential for every UNIX / Linux sysadmin, because often we as admins setup (daemons) on servers and we forgot about their existence, just to remember they exist 2 years later and see the server is crashing because of memory exhaustion. Tracking server bottlenecks where RAM memory and Swapping is the bottleneck is among the main swiss amry knives of admins. Checking which user occupies all server memory is among the routine tasks we're forced to do as admins, but because nowdays servers have a lot of memory and we put on servers often much more memory than ever will be used many admins forget to routinely track users / daemons memory consumption or even many probably doesn't know how.  Probably all are aware of the easiest wy to get list of all users memory in console non interactively with free command, e.g.:
 

free -m
             total       used       free     shared    buffers     cached
Mem:         32236      26226       6010          0        983       8430
-/+ buffers/cache:      16812      15424
Swap:        62959        234      62725


but unfortunately free command only shows overall situation with memory and doesn't divide memory usage by user

Thus probably to track memory users the only known way for most pepole is to (interactively) use good old top command or if you like modern (colorful) visualization with htop:

debian:~# top


linux-check_memory_usage_by_logged-in-user-with-top-process-command-gnu-linux-freebsd-screenshot

Once top runs interactive press 'm' to get ordered list of processes which occupy most system memory on Linux server.Top process use status statistics will refresh by default every '3.0' seconds to change that behavior to '1' second press  s and type '1.0'. To get Sort by Memory Use in htop also press 'm'
 

[root@mail-server ~]# htop


htop_show_users_memory_usage_order_ascending-gnu-linux-screenshot


However if you need to be involved in scripting and setting as a cron job tasks to be performed in case if high memroy consumption by a service you will need to use few lines of code. Below are few examples on how Linux user memory usage can be shown with ps cmd.

Probably the most universal way to see memory usage by users on Debian / Ubuntu / CentOS / RHEL and BSDs (FreeBSD / NetBSD) is with below one liner:


server:~# ps hax -o rss,user | awk '{a[$2]+=$1;}END{for(i in a)print i” “int(a[i]/1024+0.5);}' | sort -rnk2
daemon 0
debian-tor 63
dnscache 1
dnslog 0
hipo 21
messagebus 1
mysql 268
ntp 2
privoxy 1
proftpd 1
qmaill 0
qmailq 0
qmailr 0
qmails 0
qscand 291
root 94
shellinabox 1
snmp 1
statd 1
vpopmail 80
www-data 6765


Output is in MBs

Below is output from machine where this blog is running, the system runs ( Apache + PHP + MySQL Webserver + Qmail Mail server and Tor) on Debian GNU / Linux.

 To get more human readable (but obscure to type – useful for scripting) output list of which user takes how much memory use on deb / rpm etc. based Linux :


server:~# echo "USER                 RSS      PROCS" ; echo "——————– ——– —–" ; \
ps hax -o rss,user | awk '{rss[$2]+=$1;procs[$2]+=1;}END{for(user in rss) printf “%-20s %8.0f %5.0f\n”, user, rss[user]/1024, procs[user];}' | sort -rnk2


USER                 RSS      PROCS
——————– ——– —–
www-data                 6918   100
qscand                    291     2
mysql                     273     1
root                       95   120
vpopmail                   81     4
debian-tor                 63     1
hipo                       21    15
ntp                         2     1
statd                       1     1
snmp                        1     1
shellinabox                 1     2
proftpd                     1     1
privoxy                     1     1
messagebus                  1     1
dnscache                    1     1
qmails                      0     2
qmailr                      0     1
qmailq                      0     2
qmaill                      0     4
dnslog                      0     1
daemon                      0     2


It is possible to get the list of memory usage listed in percentage proportion, with a tiny for bash loop and some awk + process list command
 

TOTAL=$(free | awk '/Mem:/ { print $2 }')
for USER in $(ps haux | awk '{print $1}' | sort -u)
do
    ps hux -U $USER | awk -v user=$USER -v total=$TOTAL '{ sum += $6 } END { printf "%s %.2f\n", user, sum / total * 100; }'
done

107 1.34
115 2.10
119 1.34
daemon 1.32
dnscache 1.34
dnslog 1.32
hipo 1.59
mysql 4.79
ntp 1.34
privoxy 1.33
proftpd 1.32
qmaill 1.33
qmailq 1.33
qmailr 1.32
qmails 1.33
qscand 4.98
root 1.33
snmp 1.33
statd 1.33
vpopmail 2.35
www-data 86.48

Also a raw script which can be easily extended to give you some custom information on memory use by user list_memory_use_by_user.sh is here.
You can also want to debug further how much memory a certain users (lets say user mysql and my username hipo) is allocating, this can easily be achieved ps like so:
 

root@pcfreak:~# ps -o size,pid,user,command -u mysql –sort -size
 SIZE   PID USER     COMMAND
796924 14857 mysql   /usr/sbin/mysqld –basedir=/usr –datadir=/var/lib/mysql –plugin-dir=/usr/lib/mysql/plugin –user=mysql –pid-file=/var/run/mysqld/mysqld.pid –socket=/var/run/mysqld/mysqld.sock –port=3306


root@pcfreak~# ps -o size,pid,user,command -u hipo –sort -size|less
 SIZE   PID USER     COMMAND
13408 19063 hipo     irssi
 3168 19020 hipo     SCREEN
 2940  2490 hipo     -bash
 1844 19021 hipo     /bin/bash
 1844 19028 hipo     /bin/bash
 1844 19035 hipo     /bin/bash
 1844 19042 hipo     /bin/bash
 1844 19491 hipo     /bin/bash
 1844 22952 hipo     /bin/bash
  744  2487 hipo     sshd: hipo@pts/0
  744  2516 hipo     sshd: hipo@notty
  524  2519 hipo     screen -r
  412  2518 hipo     /usr/lib/openssh/sftp-server

You see from below output user running with www-data (this is Apache Webserver user in Debian) is eating 86.48% of overall system memory and MySQL server user is using only 4.79% of available memory

Output is shown in Megabytes per username memory usage, and user memory usage is ordered (stepping-down / descentive) from top to bottom

Getting more thoroughful and easier to read reporting without beeing a 31337 bash coder you can install and use on Linux smem – memory reporting tool .

SMEM can provide you with following memory info:

  • system overview listing
  • listings by process, mapping, user
  • filtering by process, mapping, or user
  • configurable columns from multiple data sources
  • configurable output units and percentages
  • configurable headers and totals
  • reading live data from /proc
  • reading data snapshots from directory mirrors or compressed tarballs
  • lightweight capture tool for embedded systems
  • built-in chart generation


Installing smem on Debian 6 / 7 / Ubuntu 14.04 / Turnkey Linux etc. servers is done with standard:


debian:~# apt-get install –yes smem
….


To install smem on CentOS 6 / 7:


[root@centos ~ ]# yum -y install smem
….


On Slackware and other Linux-es where smem is not available as a package you can install it easily from binary archive with:


cd /tmp/
wget http://www.selenic.com/smem/download/smem-1.3.tar.gz
tar xvf smem-1.3.tar.gz
sudo cp /tmp/smem-1.3/smem /usr/local/bin/
sudo chmod +x /usr/local/bin/smem


Two most common smem uses are:


root@mail:~# smem -u
User     Count     Swap      USS      PSS      RSS
dnslog       1       44       48       54      148
qmaill       4      232      124      145      464
hipo        11    13552     8596     9171    13160
qscand       2     4500   295336   295602   297508
root       188   217312  4521080  4568699  7712776


Below command shows (-u – Report memory usage by user, -t – show totals, -k – show unix suffixes)

root@mail:~# smem -u -t -k
User     Count     Swap      USS      PSS      RSS
dnslog       1    44.0K    48.0K    54.0K   148.0K
qmaill       4   232.0K   124.0K   145.0K   464.0K
hipo        11    13.2M     8.4M     9.0M    12.9M
qscand       2     4.4M   288.4M   288.7M   290.5M
root       188   212.2M     4.3G     4.4G     7.4G
—————————————————
           206   230.1M     4.6G     4.6G     7.7G


To get users memory use by percentage with smem:
 

root@mail:~# smem -u -p
User     Count     Swap      USS      PSS      RSS
dnslog       1    0.00%    0.00%    0.00%    0.00%
qmaill       4    0.00%    0.00%    0.00%    0.01%
hipo        11    0.17%    0.11%    0.11%    0.16%
qscand       2    0.05%    3.63%    3.63%    3.66%
root       194    2.64%   56.18%   56.77%   95.56%

It is also useful sometimes when you want to debug system overloads caused by external hardware drivers loaded into kernel causing issues to get list of system wide memory use sorted by user


 root@mail:~# smem -w -p
Area                           Used      Cache   Noncache
firmware/hardware             0.00%      0.00%      0.00%
kernel image                  0.00%      0.00%      0.00%
kernel dynamic memory        38.30%     36.01%      2.28%
userspace memory             60.50%      0.98%     59.53%
free memory                   1.20%      1.20%      0.00%


smem is very nice as if you're running it on a Desktop Linux system with Xserver installed you can see also graphical output of memory use by application:
 

root@desktop-pc:~# smem –bar pid -c "pss uss"


smem_graphical_representation-of-which-user-application-is-consuming-most-memory-gnu-linux-kde-screenshot-smem-command-line-tool

smem can even generate graphical pie charts to visualize better memory use
 

root@desktop-pc:~# smem -P '^k' –pie=name


generate-graphical-staticstics-linux-memory-use-by-pie-chart

If there is a high percentage shown in firmware/hardware this means some buggy module is loaded in kernel eating up memory, to fix it debug further and remove the problematic module.
userspace memory actually shows the percantage of memory out of all server available RAM that is being consumed by applications (non kernel and other system processes which make the system move). You see in above example the kernel itself is consuming about 40% of system overall available memory. 

We all know the SWAP field stands for hard disk drive used as a memory when system is out, but there are 3 fields which smem will report which will be probably unclear for most here is also explanation on what USS / PSS / RSS means?

RSS is the Resident Set Size and is used to show how much memory is allocated to that process and is in RAM. It does not include memory that is swapped out. It does include memory from shared libraries as long as the pages from those libraries are actually in memory. It does include all stack and heap memory too.

There is also PSS (proportional set size). This is a newer measure which tracks the shared memory as a proportion used by the current process. So if there were two processes using the same shared library from before.

USS stands for Unique set size, USS is just the unshared page count, i.e. memory returned when process is killed 

PSS = Proportional set size, (PSS),  is a more meaningful representation of the amount of memory used by libraries and applications in a virtual memory system.  
Because large portions of physical memory are typically shared among multiple applications, the standard measure of memory usage known as resident set size (RSS) will significantly overestimate memory usage. The parameter PSS instead measures each application’s “fair share” of each shared area to give a realistic measure. For most admins checking out the output from RSS (output) should be enough, it will indicate which user and therefore which daemon is eating up all your memory and will help you to catch problematic services which are cause your server to run out of RAM and start swapping to disk.

Monitoring MySQL server queries and debunning performance (slow query) issues with native MySQL commands and with mtop, mytop

Thursday, May 10th, 2012

If you're a Linux server administrator running MySQL server, you need to troubleshoot performance and bottleneck issues with the SQL database every now and then. In this article, I will pinpoint few methods to debug basic issues with MySQL database servers.

1. Troubleshooting MySQL database queries with native SQL commands

a)One way to debug errors and get general statistics is by logging in with mysql cli and check the mysql server status:

# mysql -u root -p
mysql> SHOW STATUS;
+-----------------------------------+------------+
| Variable_name | Value |
+-----------------------------------+------------+
| Aborted_clients | 1132 |
| Aborted_connects | 58 |
| Binlog_cache_disk_use | 185 |
| Binlog_cache_use | 2542 |
| Bytes_received | 115 |
.....
.....
| Com_xa_start | 0 |
| Compression | OFF |
| Connections | 150000 |
| Created_tmp_disk_tables | 0 |
| Created_tmp_files | 221 |
| Created_tmp_tables | 1 |
| Delayed_errors | 0 |
| Delayed_insert_threads | 0 |
| Delayed_writes | 0 |
| Flush_commands | 1 |
.....
.....
| Handler_write | 132 |
| Innodb_page_size | 16384 |
| Innodb_pages_created | 6204 |
| Innodb_pages_read | 8859 |
| Innodb_pages_written | 21931 |
.....
.....
| Slave_running | OFF |
| Slow_launch_threads | 0 |
| Slow_queries | 0 |
| Sort_merge_passes | 0 |
| Sort_range | 0 |
| Sort_rows | 0 |
| Sort_scan | 0 |
| Table_locks_immediate | 4065218 |
| Table_locks_waited | 196 |
| Tc_log_max_pages_used | 0 |
| Tc_log_page_size | 0 |
| Tc_log_page_waits | 0 |
| Threads_cached | 51 |
| Threads_connected | 1 |
| Threads_created | 52 |
| Threads_running | 1 |
| Uptime | 334856 |
+-----------------------------------+------------+
225 rows in set (0.00 sec)

SHOW STATUS; command gives plenty of useful info, however it is not showing the exact list of queries currently processed by the SQL server. Therefore sometimes it is exactly a stucked (slow queries) execution, you need to debug in order to fix a lagging SQL. One way to track this slow queries is via enabling mysql slow-query.log. Anyways enabling the slow-query requires a MySQL server restart and some critical productive database servers are not so easy to restart and the SQL slow queries have to be tracked "on the fly" so to say.
Therefore, to check the exact (slow) queries processed by the SQL server (without restarting it), do
 

mysql> SHOW processlist;
+——+——+—————+——+———+——+————–+——————————————————————————————————+
| Id | User | Host | db | Command | Time | State | Info |
+——+——+—————+——+———+——+————–+——————————————————————————————————+
| 609 | root | localhost | blog | Sleep | 5 | | NULL |
| 1258 | root | localhost | NULL | Sleep | 85 | | NULL |
| 1308 | root | localhost | NULL | Query | 0 | NULL | show processlist |
| 1310 | blog | pcfreak:64033 | blog | Query | 0 | Sending data | SELECT comment_author, comment_author_url, comment_content, comment_post_ID, comment_ID, comment_aut |
+——+——+—————+——+———+——+————–+——————————————————————————————————+
4 rows in set (0.00 sec)
mysql>

SHOW processlist gives a good view on what is happening inside the SQL.

To get more complete information on SQL query threads use the full extra option:

mysql> SHOW full processlist;

This gives pretty full info on running threads, but unfortunately it is annoying to re-run the command again and again – constantly to press UP Arrow + Enter keys.

Hence it is useful to get the same command output, refresh periodically every few seconds. This is possible by running it through the watch command:

debian:~# watch "'show processlist' | mysql -u root -p'secret_password'"

watch will run SHOW processlist every 2 secs (this is default watch refresh time, for other timing use watch -n 1, watch -n 10 etc. etc.

The produced output will be similar to:

Every 2.0s: echo 'show processlist' | mysql -u root -p'secret_password' Thu May 10 17:24:19 2012

Id User Host db Command Time State Info
609 root localhost blog Sleep 3 NULL1258 root localhost NULL Sleep 649 NULL1542 blog pcfreak:64981 blog Query 0 Copying to tmp table \
SELECT p.ID, p.post_title, p.post_content,p.post_excerpt, p.pos
t_date, p.comment_count, count(t_r.o
1543 root localhost NULL Query 0 NULL show processlist

Though this "hack" is one of the possible ways to get some interactivity on what is happening inside SQL server databases and tables table. for administering hundred or thousand SQL servers running dozens of queries per second – monitor their behaviour few times aday using mytop or mtop is times easier.

Though, the names of the two tools are quite similar and I used to think both tools are one and the same, actually they're not but both are suitable for monitoring sql database execution in real time.

As a sys admin, I've used mytop and mtop, on almost each Linux server with MySQL server installed.
Both tools has helped me many times in debugging oddities with sql servers. Therefore my personal view is mytop and mtop should be along with the Linux sysadmin most useful command tools outfit, still I'm sure many administrators still haven't heard about this nice goodies.

1. Installing mytop on Debian, Ubuntu and other deb based GNU / Linux-es

mytop is available for easy install on Debian and across all debian / ubuntu and deb derivative distributions via apt.

Here is info obtained with apt-cache show

debian:~# apt-cache show mytop|grep -i description -A 3
Description: top like query monitor for MySQL
Mytop is a console-based tool for monitoring queries and the performance
of MySQL. It supports version 3.22.x, 3.23.x, 4.x and 5.x servers.
It's written in Perl and support connections using TCP/IP and UNIX sockets.

Installing the tool is done with the trivial:

debian:~# apt-get --yes install mytop
....

mtop used to be available for apt-get-ting in Debian Lenny and prior Debian releases but in Squeeze onwards, only mytop is included (probably due to some licensing incompitabilities with mtop??).

For those curious on how mtop / mytop works – both are perl scripts written to periodically connects to the SQL server and run commands similar to SHOW FULL PROCESSLIST;. Then, the output is parsed and displayed to the user.

Here how mytop running, looks like:

MyTOP showing queries running on Ubuntu 8.04 Linux - Debugging interactively top like MySQL

2. Installing mytop on RHEL and CentOS

By default in RHEL and CentOS and probably other RedHat based Linux-es, there is neither mtop nor mytop available in package repositories. Hence installing the tools on those is only available from 3rd parties. As of time of writting an rpm builds for RHEL and CentOS, as well as (universal rpm distros) src.rpm package is available on http://pkgs.repoforge.org/mytop/. For the sake of preservation – if in future those RPMs disappear, I made a mirror of mytop rpm's here

Mytop rpm builds depend on a package perl(Term::ReadKey), my attempt to install it on CentOS 5.6, returned following err:

[root@cenots ~]# rpm -ivh mytop-1.4-2.el5.rf.noarch.rpm
warning: mytop-1.4-2.el5.rf.noarch.rpm: Header V3 DSA signature: NOKEY, key ID 6b8d79e6
error: Failed dependencies:
perl(Term::ReadKey) is needed by mytop-1.4-2.el5.rf.noarch

The perl(Term::ReadKey package is not available in CentOS 5.6 and (probably other centos releases default repositories so I had to google perl(Term::ReadKey) I found it on http://rpm.pbone.net/ package repository, the exact url to the rpm dependency as of time of writting this post is:

ftp://ftp.pbone.net/mirror/yum.trixbox.org/centos/5/old/perl-Term-ReadKey-2.30-2.rf.i386.rpm

Quickest, way to install it is:

[root@centos ~]# rpm -ivh ftp://ftp.pbone.net/mirror/yum.trixbox.org/centos/5/old/perl-Term-ReadKey-2.30-2.rf.i386.rpmRetrieving ftp://ftp.pbone.net/mirror/yum.trixbox.org/centos/5/old/perl-Term-ReadKey-2.30-2.rf.i386.rpmPreparing... ########################################### [100%]
1:perl-Term-ReadKey ########################################### [100%]

This time mytop, install went fine:

[root@centos ~]# rpm -ivh mytop-1.4-2.el5.rf.noarch.rpm
warning: mytop-1.4-2.el5.rf.noarch.rpm: Header V3 DSA signature: NOKEY, key ID 6b8d79e6
Preparing... ########################################### [100%]
1:mytop ########################################### [100%]

To use it further, it is the usual syntax:

mytop -u username -p 'secret_password' -d database

CentOS Linux MyTOP MySQL query benchmark screenshot - vpopmail query

3. Installing mytop and mtop on FreeBSD and other BSDs

To debug the running SQL queries in a MySQL server running on FreeBSD, one could use both mytop and mtop – both are installable via ports:

a) To install mtop exec:

freebsd# cd /usr/ports/sysutils/mtop
freebsd# make install clean
....

b) To install mytop exec:

freebsd# cd /usr/ports/databases/mytop
freebsd# make install clean
....

I personally prefer to use mtop on FreeBSD, because once run it runs prompts the user to interactively type in the user/pass

freebsd# mtop

Then mtop prompts the user with "interactive" dialog screen to type in user and pass:

Mtop interactive type in username and password screenshot on FreeBSD 7.2

It is pretty annoying, same mtop like syntax don't show user/pass prompt:

freebsd# mytop
Cannot connect to MySQL server. Please check the:

* database you specified "test" (default is "test")
* username you specified "root" (default is "root")
* password you specified "" (default is "")
* hostname you specified "localhost" (default is "localhost")
* port you specified "3306" (default is 3306)
* socket you specified "" (default is "")
The options my be specified on the command-line or in a ~/.mytop
config file. See the manual (perldoc mytop) for details.
Here's the exact error from DBI. It might help you debug:
Unknown database 'test'

The correct syntax to run mytop instead is:

freebsd# mytop -u root -p 'secret_password' -d 'blog'

Or the longer more descriptive:

freebsd# mytop --user root --pass 'secret_password' --database 'blog'

By the way if you take a look at mytop's manual you will notice a tiny error in documentation, where the three options –user, –pass and –database are wrongly said to be used as -user, -pass, -database:

freebsd# mytop -user root -pass 'secret_password' -database 'blog'
Cannot connect to MySQL server. Please check the:

* database you specified "atabase" (default is "test")
* username you specified "ser" (default is "root")
* password you specified "ass" (default is "")
* hostname you specified "localhost" (default is "localhost")
* port you specified "3306" (default is 3306)
* socket you specified "" (default is "")a
...
Access denied for user 'ser'@'localhost' (using password: YES)

Actually it is interesting mytop, precededed historically mtop.
mtop was later written (probably based on mytop), to run on FreeBSD OS by a famous MySQL (IT) spec — Jeremy Zawodny .
Anyone who has to do frequent MySQL administration tasks, should already heard Zawodny's name.
For those who haven't, Jeremy used to be a head database administrators and developer in Yahoo! Inc. some few years ago.
His website contains plenty of interesting thoughts and writtings on MySQL server and database management
 

After a loooongg, looong waiting finally a New Version of Skype 4.0 is out – Skype 4 on Debian GNU / Linux short review

Sunday, June 17th, 2012

After about 3 years of no new version for GNU / Linux finally Skype has released a new version of Skype.
I thought already there will be never a new skype version out for GNU / Linux, since the moment Microsoft purchased skype.

Now suddenly and quite in quiet the new version of Skype 4.0 is out for download from Skype's website. The latest Skype download for Linux is to be found here

As of time of writting this post there are Skype 4 versions for following Linux-es;;;
 

  • Ubuntu 10.04 32 / 64-bit (probably would work fine on latest Ubuntus too)
  • Debian 6.0 Squeeze 32 / 64-bit
  • Fedora 16 / 32 bit
  • OpenSUSE 12.1 32bit (only)
  • Most likely the Ubuntu release of skype 4 will work flawlessly on Linux Mint and other debian derivatives.The The release mentions, Skype 4 is supposed to have 4 major advancements and the gap in interface and usability with latest Mac OS and M$ Windows Skype versions is now filled.The four major changes said in the announcement are;;;

  • 1. a new Conversations View where users can easily track all of their chats in a unified window.
    Those users who prefer the old view can disable this in the Chat options;
  • 2. a brand new Call View;
  • 3.Call quality has never been better thanks to several investments we made in improving audio quality;
  • 4. Improved video call quality and extended support for more cameras.
  • Some of the minor improvements in those

  • new Linux skype
  • are:- improved chat synchronization- new presence and emoticon icons- the ability to store and view phone numbers in a Skype contact's profile- much lower chance Skype for Linux will crash or freeze- chat history loading is now much faster- support for two new languages: Czech (flag:cz) and Norwegian (flag:no)Just like with prior Skype releases 2.0 and 2.2beta this release comes with almost same list of non-english language support ,,,Seeing those announcement, I've hurried to download and test skype 4 on my 64-bit desktop running Debian 6 Squeeze.Once downloaded to install the pack skype-debian_4.0.0.7-1_amd64.deb I used the usual dpkg -i i,e,;;;noah:~# dpkg -iskype-debian_4.0.0.7-1_amd64.deb…………..Just like the release announcement mentions the first initial launch of Skype 4 took about 3 or 4 minutes doing something (probably sending half of my hard disk data to Microsoft 🙂 🙂 🙂 ) along with importing the prior skype data and chat history :)The minimum software dependencies for correct operation of Skype are:Qt libraries; D-Bus; libasound and pulseaudioHere are few screenshots of Skype 4 to give you an idea what to expect:The Skype Options is almost identical to Skype 2.2. One interesting new feature I've noticed is Skype WIFIUnfortunately to use Skype WIFI you need to have purchased skype credits.Another notable difference is the organization of Skype Chats, which is more like in the good old times of mIRC and IRC chat clientsHere is also the list of Skype emoticons including bundled with Skype 4:The "look & feel" of the new interface gives the impression of seriously improved Skype client stability too.There was a minor trouble with the voice recording (microphone) with Skype 4;To make the microphone work properly I had to raise up the mic volume from PulseAudio settings in Skype options.Well that's all the only unpleasent thing for this new skype is it is using KDE's libQT and seems not to have a native interface for GNOME via GTK2. If we put away this I guess this version of Skype is much more stable and therefore I would recommend anyone to update.Of course we never know if this new updated more stable Skype release is not filled up with backdoors or does not transfer all our conversations to microsoft but we didn't know that even when Skype was not Microsoft's so and since it is not a free software I guess it doesn't matter so much.As you can guess Microsoft has imposed centralization on Skype protocol so connecting the peers is now done by Microsoft servers this news is another intriguing one.According to one recent article from May 1, 2012 Microsoft Skype replaces the Peer-to-Peer P2P supernodes with Linux boxes hosted by Microsoft – In short that probably means that by changing this nowdays microsoft probably now logs all chat sessions between Skype users, even it is likely the calls between users are recorded too. We all know Microsoft imperialism pretty well so I guess this is not a big news …..This new release of Skype if it is significantly more stable than it is prior releases would certainly have serious positive implication on the development and adoption of Linux for the Desktop. So far I'm sure one of the obstacles of many manufacturers of notebooks and comp equipment to ship with Linux was the lack of a stable and easy to implement skype release for Linux.Well that's all folks. Enjoy the New Skype Cheeres ! 🙂