Posts Tagged ‘Print’

ipmitool: Reset and manage IPMI (Intelligent Platform Management Interface) / ILO (Integrated Lights Out) remote board on Linux servers

Friday, December 20th, 2019

ipmitool-how-to-get-information-about-hardware-and-reset-ipmi-bmc-linux-access-ipmi-ilo-interface-logo

As a system administration nomatter whether you manage a bunch of server in a own brew and run Data Center location with some Rack mounted Hardware like PowerEdge M600 / ProLiant DL360e G8 / ProLiant DL360 Gen9 (755258-B21) or you're managing a bunch of Dedicated Servers, you're or will be faced  at some point to use the embedded in many Rack mountable rack servers IPMI / ILO interface remote console board management. If IPMI / ILO terms are new for you I suggest you quickly read my earlier article What is IPMI / IPKVM / ILO /  DRAC Remote Management interfaces to server .
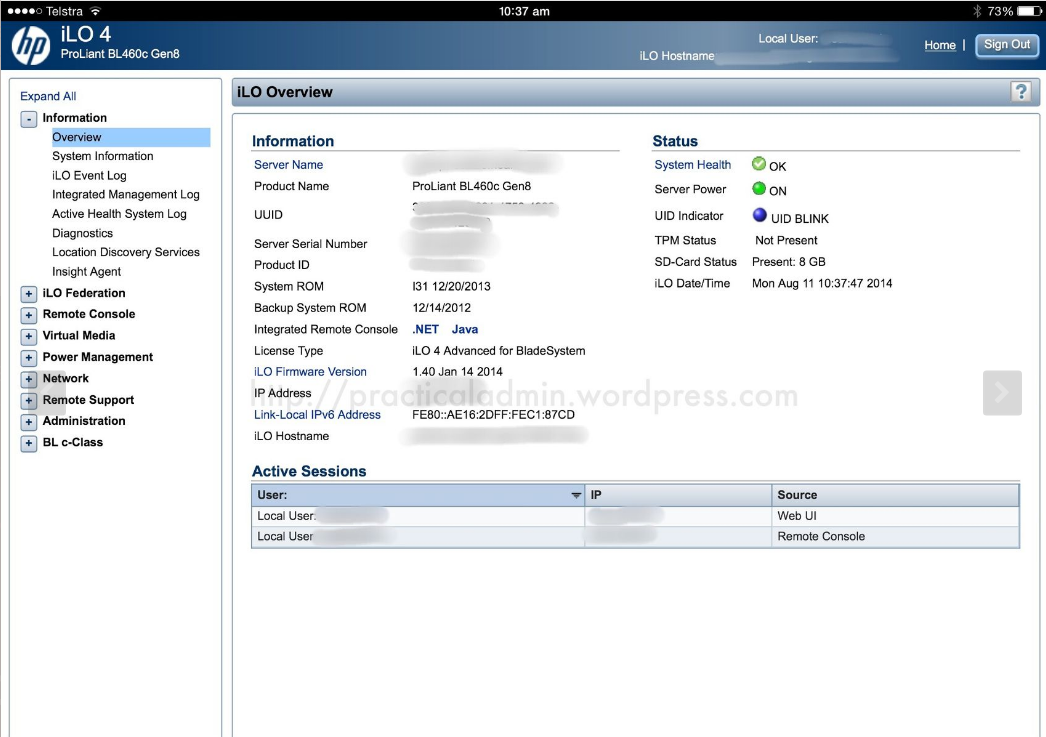
hp-proliant-bl460c-ILO-Interface-screenshot

HP Proliant BL460 C IPMI (ILO) Web management interface 

In short Remote Management Interface is a way that gives you access to the server just like if you had a Monitor and a Keyboard plugged in directly to server.
When a remote computer is down the sysadmin can access it through IPMI and utilize a text console to the boot screen.
The IPMI protocol specification is led by Intel and was first published on September 16, 1998. and currently is supported by more than 200 computer system vendors, such as Cisco, Dell, Hewlett Packard Enterprise, Intel, NEC Corporation, SuperMicro and Tyan and is a standard for remote board management for servers.
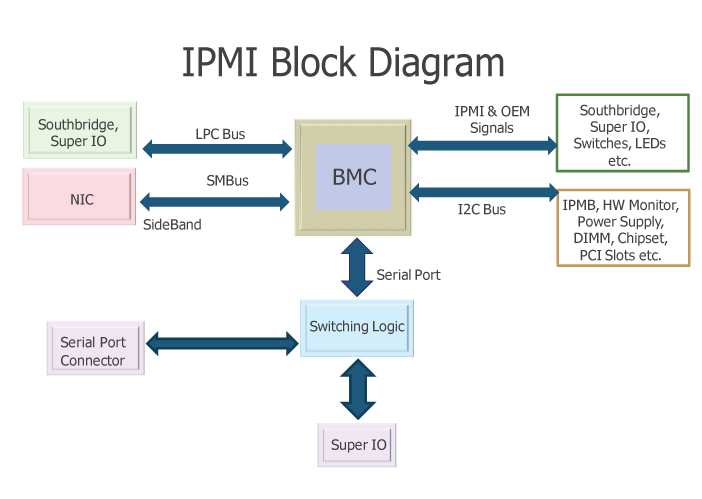
IPMI-Block-Diagram-how-ipmi-works-and-its-relation-to-BMC
As you can see from diagram Baseboard Management Controllers (BMCs) is like the heart of IPMI.

Having this ILO / IPMI access is usually via a Web Interface Java interface that gives you the console and usually many of the machines also have an IP address via which a normal SSH command prompt is available giving you ability to execute diagnostic commands to the ILO on the status of attached hardware components of the server / get information about the attached system sensors to get report about things such as:

  • The System Overall heat
  • CPU heat temperature
  • System fan rotation speed cycles
  • Extract information about the server chassis
  • Query info about various system peripherals
  • Configure BIOS or UEFI on a remote system with no monitor / keyboard attached

Having a IPMI (Intelligent Platform Management Interface) firmware embedded into the server Motherboard is essential for system administration because besides this goodies it allows you to remotely Install Operating System to a server without any pre-installed OS right after it is bought and mounted to the planned Data Center Rack nest, just like if you have a plugged Monitor / Keyboard and Mouse and being physically in the remote location.

IPMI is mega useful for system administration also in case of Linux / Windows system updates that requires reboot in which essential System Libraries or binaries are updated and a System reboot is required, because often after system Large bundle updates or Release updates the system fails to boot and you need a way to run a diagnostic stuff from a System rescue Operating System living on a plugged in via a USB stick or CD Drive.
As prior said IPMI remote board is usually accessed and used via some Remote HTTPS encrypted web interface or via Secure Shell crypted session but sometimes the Web server behind the IPMI Web Interface is hanging especially when multiple sysadmins try to access it or due to other stuff and at times due to strange stuff even console SSH access might not be there, thansfully those who run a GNU / Linux Operating system on the Hardware node can use ipmitool tool http://ipmitool.sourceforge.net/ written for Linux that is capable to do a number of useful things with the IPMI management board including a Cold Reset of it so it turns back to working state / adding users / grasping the System hardware and components information health status, changing the Listener address of the IPMI access Interface and even having ability to update the IPMI version firmware.

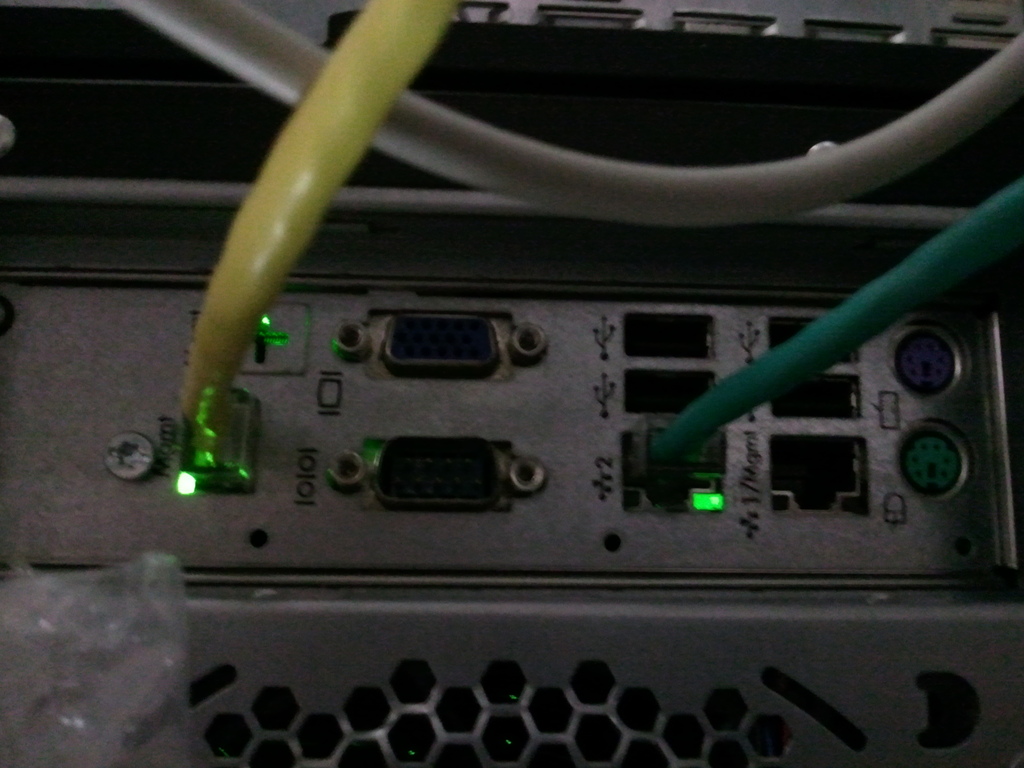
Prior to be able to access IPMI remotely it has to be enabled usually via a UTP cable connected to the Network from which you expect it to be accesible. The location of the IPMI port on different server vendors is different.
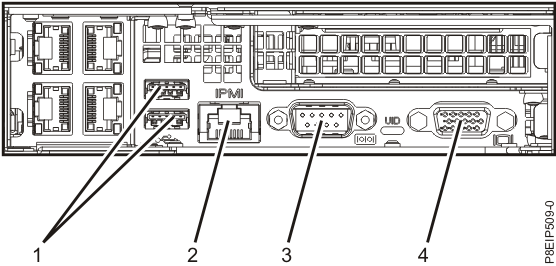
ibm-power9-server-ipmi

IBM Power 9 Server IPMI port

HP-ILO-Bladeserver-Management-port-MGMT-yellow-cabled

HP IPMI console called ILO (Integrated Lights-Out) Port cabled with yellow cable (usually labelled as
Management Port MGMT)
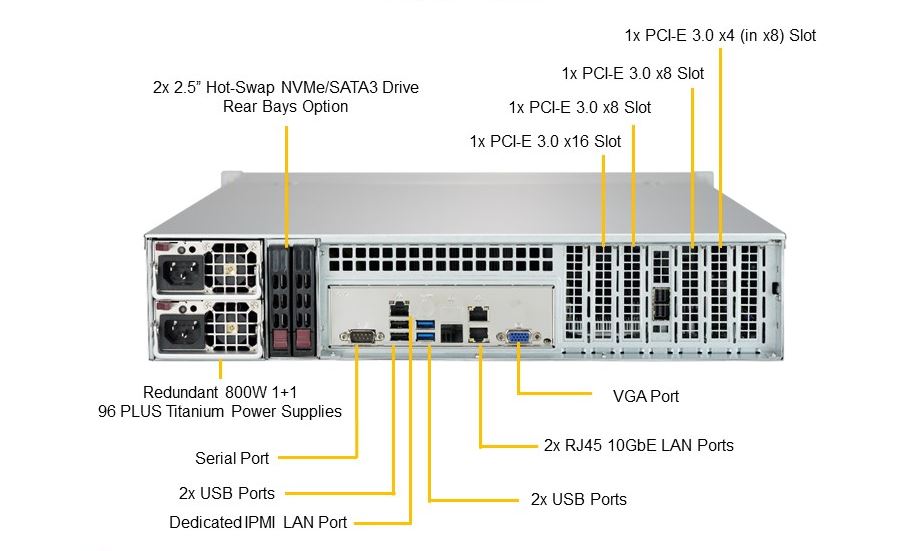
Supermicro-SSG-5029P-E1CTR12L-Rear-Annotated-dedicated-IPMI-lan-port

Supermicro server IPMI Dedicated Lan Port


 In this article I'll shortly explain how IPMITool is available and can be installed and used across GNU / Linux Debian / Ubuntu and other deb based Linuxes with apt or on Fedora / CentOS (RPM) based with yum etc.


1. Install IPMITool


– On Debian


# apt-get install –yes ipmitool 


– On CentOS


# yum install ipmitool OpenIPMI-tools


# ipmitool -V
ipmitool version 1.8.14


On CentOS ipmitool can run as a service and collect data and do some nice stuff to run it:


[root@linux ~]# chkconfig ipmi on 


[root@linux ~]# service ipmi start


Before start using it is worthy to give here short description from ipmitool man page
 

DESCRIPTION
       This program lets you manage Intelligent Platform Management Interface (IPMI) functions of either the local system, via a kernel device driver, or a remote system, using IPMI v1.5 and IPMI v2.0.
       These functions include printing FRU information, LAN configuration, sensor readings, and remote chassis power control.

IPMI management of a local system interface requires a compatible IPMI kernel driver to be installed and configured.  On Linux this driver is called OpenIPMI and it is included in standard  dis‐
       tributions.   On Solaris this driver is called BMC and is included in Solaris 10.  Management of a remote station requires the IPMI-over-LAN interface to be enabled and configured.  Depending on
       the particular requirements of each system it may be possible to enable the LAN interface using ipmitool over the system interface.


2. Get ADMIN IP configured for access
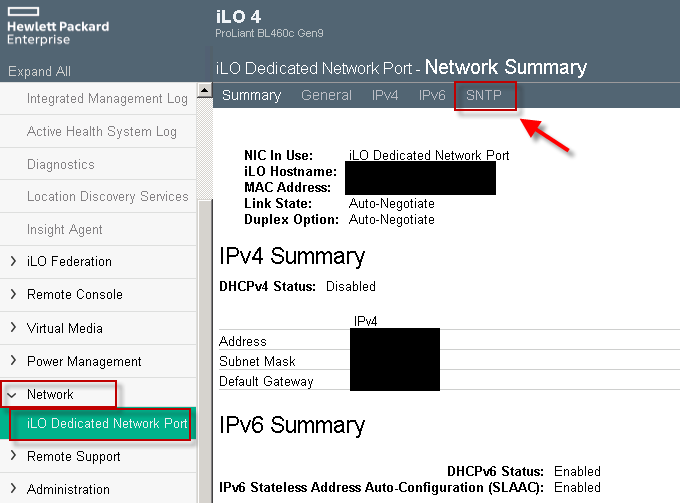
https://3.bp.blogspot.com/-jojgWqj7acg/Wo6bSP0Av1I/AAAAAAAAGdI/xaHewnmAujkprCiDXoBxV7uHonPFjtZDwCLcBGAs/s1600/22-02-2018%2B15-31-09

To get a list of what is the current listener IP with no access to above Web frontend via which IPMI can be accessed (if it is cabled to the Access / Admin LAN port).


# ipmitool lan print 1
Set in Progress         : Set Complete
Auth Type Support       : NONE MD2 MD5 PASSWORD
Auth Type Enable        : Callback : MD2 MD5 PASSWORD
                        : User     : MD2 MD5 PASSWORD
                        : Operator : MD2 MD5 PASSWORD
                        : Admin    : MD2 MD5 PASSWORD
                        : OEM      :
IP Address Source       : Static Address
IP Address              : 10.253.41.127
Subnet Mask             : 255.255.254.0
MAC Address             : 0c:c4:7a:4b:1f:70
SNMP Community String   : public
IP Header               : TTL=0x00 Flags=0x00 Precedence=0x00 TOS=0x00
BMC ARP Control         : ARP Responses Enabled, Gratuitous ARP Disabled
Default Gateway IP      : 10.253.41.254
Default Gateway MAC     : 00:00:0c:07:ac:7b
Backup Gateway IP       : 10.253.41.254
Backup Gateway MAC      : 00:00:00:00:00:00
802.1q VLAN ID          : 8
802.1q VLAN Priority    : 0
RMCP+ Cipher Suites     : 1,2,3,6,7,8,11,12
Cipher Suite Priv Max   : aaaaXXaaaXXaaXX
                        :     X=Cipher Suite Unused
                        :     c=CALLBACK
                        :     u=USER
                        :     o=OPERATOR
                        :     a=ADMIN
                        :     O=OEM


3. Configure custom access IP and gateway for IPMI


[root@linux ~]# ipmitool lan set 1 ipsrc static


[root@linux ~]# ipmitool lan set 1 ipaddr 192.168.1.211
Setting LAN IP Address to 192.168.1.211


[root@linux ~]# ipmitool lan set 1 netmask 255.255.255.0
Setting LAN Subnet Mask to 255.255.255.0


[root@linux ~]# ipmitool lan set 1 defgw ipaddr 192.168.1.254
Setting LAN Default Gateway IP to 192.168.1.254


[root@linux ~]# ipmitool lan set 1 defgw macaddr 00:0e:0c:aa:8e:13
Setting LAN Default Gateway MAC to 00:0e:0c:aa:8e:13


[root@linux ~]# ipmitool lan set 1 arp respond on
Enabling BMC-generated ARP responses


[root@linux ~]# ipmitool lan set 1 auth ADMIN MD5

[root@linux ~]# ipmitool lan set 1 access on


4. Getting a list of IPMI existing users


# ipmitool user list 1
ID  Name             Callin  Link Auth  IPMI Msg   Channel Priv Limit
2   admin1           false   false      true       ADMINISTRATOR
3   ovh_dontchange   true    false      true       ADMINISTRATOR
4   ro_dontchange    true    true       true       USER
6                    true    true       true       NO ACCESS
7                    true    true       true       NO ACCESS
8                    true    true       true       NO ACCESS
9                    true    true       true       NO ACCESS
10                   true    true       true       NO ACCESS


– To get summary of existing users

# ipmitool user summary
Maximum IDs         : 10
Enabled User Count  : 4
Fixed Name Count    : 2

5. Create new Admin username into IPMI board
 

[root@linux ~]# ipmitool user set name 2 Your-New-Username


[root@linux ~]# ipmitool user set password 2
Password for user 2: 


[root@linux ~]# ipmitool channel setaccess 1 2 link=on ipmi=on callin=on privilege=4


[root@linux ~]# ipmitool user enable 2
[root@linux ~]# 


6. Configure non-privilege user into IPMI board

If a user should only be used for querying sensor data, a custom privilege level can be setup for that. This user then has no rights for activating or deactivating the server, for example. A user named monitor will be created for this in the following example:

[root@linux ~]# ipmitool user set name 3 monitor


[root@linux ~]# ipmitool user set password 3
Password for user 3: 


[root@linux ~]# ipmitool channel setaccess 1 3 link=on ipmi=on callin=on privilege=2


[root@linux ~]# ipmitool user enable 3

The importance of the various privilege numbers will be displayed when  ipmitool channel  is called without any additional parameters.


[root@linux ~]# ipmitool channel
Channel Commands: authcap   <channel number> <max privilege>
                  getaccess <channel number> [user id]
                  setaccess <channel number> <user id> [callin=on|off] [ipmi=on|off] [link=on|off] [privilege=level]
                  info      [channel number]
                  getciphers <ipmi | sol> [channel]


Possible privilege levels are:
   1   Callback level
   2   User level
   3   Operator level
   4   Administrator level
   5   OEM Proprietary level
  15   No access
[root@linux ~]# 

The user just created (named 'monitor') has been assigned the USER privilege level. So that LAN access is allowed for this user, you must activate MD5 authentication for LAN access for this user group (USER privilege level).

[root@linux ~]# ipmitool channel getaccess 1 3
Maximum User IDs     : 15
Enabled User IDs     : 2

User ID              : 3
User Name            : monitor
Fixed Name           : No
Access Available     : call-in / callback
Link Authentication  : enabled
IPMI Messaging       : enabled
Privilege Level      : USER

[root@linux ~]# 


7. Check server firmware version on a server via IPMI


# ipmitool mc info
Device ID                 : 32
Device Revision           : 1
Firmware Revision         : 3.31
IPMI Version              : 2.0
Manufacturer ID           : 10876
Manufacturer Name         : Supermicro
Product ID                : 1579 (0x062b)
Product Name              : Unknown (0x62B)
Device Available          : yes
Provides Device SDRs      : no
Additional Device Support :
    Sensor Device
    SDR Repository Device
    SEL Device
    FRU Inventory Device
    IPMB Event Receiver
    IPMB Event Generator
    Chassis Device


ipmitool mc info is actually an alias for the ipmitool bmc info cmd.

8. Reset IPMI management controller or BMC if hanged


As earlier said if for some reason Web GUI access or SSH to IPMI is lost, reset with:

root@linux:/root#  ipmitool mc reset
[ warm | cold ]


If you want to stop electricity for a second to IPMI and bring it on use the cold reset (this usually
should be done if warm reset does not work).


root@linux:/root# ipmitool mc reset cold


otherwise soft / warm is with:


ipmitool mc reset warm


Sometimes the BMC component of IPMI hangs and only fix to restore access to server Remote board is to reset also BMC


root@linux:/root# ipmitool bmc reset cold


9. Print hardware system event log


root@linux:/root# ipmitool sel info
SEL Information
Version          : 1.5 (v1.5, v2 compliant)
Entries          : 0
Free Space       : 10240 bytes
Percent Used     : 0%
Last Add Time    : Not Available
Last Del Time    : 07/02/2015 17:22:34
Overflow         : false
Supported Cmds   : 'Reserve' 'Get Alloc Info'
# of Alloc Units : 512
Alloc Unit Size  : 20
# Free Units     : 512
Largest Free Blk : 512
Max Record Size  : 20


 ipmitool sel list
SEL has no entries

In this particular case the system shows no entres as it was run on a tiny Microtik 1U machine, however usually on most Dell PowerEdge / HP Proliant / Lenovo System X machines this will return plenty of messages.

ipmitool sel elist

ipmitool sel clear

To clear anything if such logged

ipmitool sel clear


10.  Print Field Replaceable Units ( FRUs ) on the server 


[root@linux ~]# ipmitool fru print


FRU Device Description : Builtin FRU Device (ID 0)
 Chassis Type          : Other
 Chassis Serial        : KD5V59B
 Chassis Extra         : c3903ebb6237363698cdbae3e991bbed
 Board Mfg Date        : Mon Sep 24 02:00:00 2012
 Board Mfg             : IBM
 Board Product         : System Board
 Board Serial          : XXXXXXXXXXX
 Board Part Number     : 00J6528
 Board Extra           : 00W2671
 Board Extra           : 1400
 Board Extra           : 0000
 Board Extra           : 5000
 Board Extra           : 10

 Product Manufacturer  : IBM
 Product Name          : System x3650 M4
 Product Part Number   : 1955B2G
 Product Serial        : KD7V59K
 Product Asset Tag     :

FRU Device Description : Power Supply 1 (ID 1)
 Board Mfg Date        : Mon Jan  1 01:00:00 1996
 Board Mfg             : ACBE
 Board Product         : IBM Designed Device
 Board Serial          : YK151127R1RN
 Board Part Number     : ZZZZZZZ
 Board Extra           : ZZZZZZ<FF><FF><FF><FF><FF>
 Board Extra           : 0200
 Board Extra           : 00
 Board Extra           : 0080
 Board Extra           : 1

FRU Device Description : Power Supply 2 (ID 2)
 Board Mfg Date        : Mon Jan  1 01:00:00 1996
 Board Mfg             : ACBE
 Board Product         : IBM Designed Device
 Board Serial          : YK131127M1LE
 Board Part Number     : ZZZZZ
 Board Extra           : ZZZZZ<FF><FF><FF><FF><FF>
 Board Extra           : 0200
 Board Extra           : 00
 Board Extra           : 0080
 Board Extra           : 1

FRU Device Description : DASD Backplane 1 (ID 3)
….


Worthy to mention here is some cheaper server vendors such as Trendmicro might show no data here (no idea whether this is a protocol incompitability or IPMItool issue).


11. Get output about system sensors Temperature / Fan / Power Supply


Most newer servers have sensors to track temperature / voltage / fanspeed peripherals temp overall system temp etc.
To get a full list of sensors statistics from IPMI 
 

# ipmitool sensor
CPU Temp         | 29.000     | degrees C  | ok    | 0.000     | 0.000     | 0.000     | 95.000    | 98.000    | 100.000
System Temp      | 40.000     | degrees C  | ok    | -9.000    | -7.000    | -5.000    | 80.000    | 85.000    | 90.000
Peripheral Temp  | 41.000     | degrees C  | ok    | -9.000    | -7.000    | -5.000    | 80.000    | 85.000    | 90.000
PCH Temp         | 56.000     | degrees C  | ok    | -11.000   | -8.000    | -5.000    | 90.000    | 95.000    | 100.000
FAN 1            | na         |            | na    | na        | na        | na        | na        | na        | na
FAN 2            | na         |            | na    | na        | na        | na        | na        | na        | na
FAN 3            | na         |            | na    | na        | na        | na        | na        | na        | na
FAN 4            | na         |            | na    | na        | na        | na        | na        | na        | na
FAN A            | na         |            | na    | na        | na        | na        | na        | na        | na
Vcore            | 0.824      | Volts      | ok    | 0.480     | 0.512     | 0.544     | 1.488     | 1.520     | 1.552
3.3VCC           | 3.296      | Volts      | ok    | 2.816     | 2.880     | 2.944     | 3.584     | 3.648     | 3.712
12V              | 12.137     | Volts      | ok    | 10.494    | 10.600    | 10.706    | 13.091    | 13.197    | 13.303
VDIMM            | 1.496      | Volts      | ok    | 1.152     | 1.216     | 1.280     | 1.760     | 1.776     | 1.792
5VCC             | 4.992      | Volts      | ok    | 4.096     | 4.320     | 4.576     | 5.344     | 5.600     | 5.632
CPU VTT          | 1.008      | Volts      | ok    | 0.872     | 0.896     | 0.920     | 1.344     | 1.368     | 1.392
VBAT             | 3.200      | Volts      | ok    | 2.816     | 2.880     | 2.944     | 3.584     | 3.648     | 3.712
VSB              | 3.328      | Volts      | ok    | 2.816     | 2.880     | 2.944     | 3.584     | 3.648     | 3.712
AVCC             | 3.312      | Volts      | ok    | 2.816     | 2.880     | 2.944     | 3.584     | 3.648     | 3.712
Chassis Intru    | 0x1        | discrete   | 0x0100| na        | na        | na        | na        | na        | na


To get only partial sensors data from the SDR (Sensor Data Repositry) entries and readings


[root@linux ~]# ipmitool sdr list 

Planar 3.3V      | 3.31 Volts        | ok
Planar 5V        | 5.06 Volts        | ok
Planar 12V       | 12.26 Volts       | ok
Planar VBAT      | 3.14 Volts        | ok
Avg Power        | 80 Watts          | ok
PCH Temp         | 45 degrees C      | ok
Ambient Temp     | 19 degrees C      | ok
PCI Riser 1 Temp | 25 degrees C      | ok
PCI Riser 2 Temp | no reading        | ns
Mezz Card Temp   | no reading        | ns
Fan 1A Tach      | 3071 RPM          | ok
Fan 1B Tach      | 2592 RPM          | ok
Fan 2A Tach      | 3145 RPM          | ok
Fan 2B Tach      | 2624 RPM          | ok
Fan 3A Tach      | 3108 RPM          | ok
Fan 3B Tach      | 2592 RPM          | ok
Fan 4A Tach      | no reading        | ns
Fan 4B Tach      | no reading        | ns
CPU1 VR Temp     | 27 degrees C      | ok
CPU2 VR Temp     | 27 degrees C      | ok
DIMM AB VR Temp  | 24 degrees C      | ok
DIMM CD VR Temp  | 23 degrees C      | ok
DIMM EF VR Temp  | 25 degrees C      | ok
DIMM GH VR Temp  | 24 degrees C      | ok
Host Power       | 0x00              | ok
IPMI Watchdog    | 0x00              | ok


[root@linux ~]# ipmitool sdr type Temperature
PCH Temp         | 31h | ok  | 45.1 | 45 degrees C
Ambient Temp     | 32h | ok  | 12.1 | 19 degrees C
PCI Riser 1 Temp | 3Ah | ok  | 16.1 | 25 degrees C
PCI Riser 2 Temp | 3Bh | ns  | 16.2 | No Reading
Mezz Card Temp   | 3Ch | ns  | 44.1 | No Reading
CPU1 VR Temp     | F7h | ok  | 20.1 | 27 degrees C
CPU2 VR Temp     | F8h | ok  | 20.2 | 27 degrees C
DIMM AB VR Temp  | F9h | ok  | 20.3 | 25 degrees C
DIMM CD VR Temp  | FAh | ok  | 20.4 | 23 degrees C
DIMM EF VR Temp  | FBh | ok  | 20.5 | 26 degrees C
DIMM GH VR Temp  | FCh | ok  | 20.6 | 24 degrees C
Ambient Status   | 8Eh | ok  | 12.1 |
CPU 1 OverTemp   | A0h | ok  |  3.1 | Transition to OK
CPU 2 OverTemp   | A1h | ok  |  3.2 | Transition to OK


[root@linux ~]# ipmitool sdr type Fan
Fan 1A Tach      | 40h | ok  | 29.1 | 3034 RPM
Fan 1B Tach      | 41h | ok  | 29.1 | 2592 RPM
Fan 2A Tach      | 42h | ok  | 29.2 | 3145 RPM
Fan 2B Tach      | 43h | ok  | 29.2 | 2624 RPM
Fan 3A Tach      | 44h | ok  | 29.3 | 3108 RPM
Fan 3B Tach      | 45h | ok  | 29.3 | 2592 RPM
Fan 4A Tach      | 46h | ns  | 29.4 | No Reading
Fan 4B Tach      | 47h | ns  | 29.4 | No Reading
PS 1 Fan Fault   | 73h | ok  | 10.1 | Transition to OK
PS 2 Fan Fault   | 74h | ok  | 10.2 | Transition to OK


[root@linux ~]# ipmitool sdr type ‘Power Supply’
Sensor Type "‘Power" not found.
Sensor Types:
        Temperature               (0x01)   Voltage                   (0x02)
        Current                   (0x03)   Fan                       (0x04)
        Physical Security         (0x05)   Platform Security         (0x06)
        Processor                 (0x07)   Power Supply              (0x08)
        Power Unit                (0x09)   Cooling Device            (0x0a)
        Other                     (0x0b)   Memory                    (0x0c)
        Drive Slot / Bay          (0x0d)   POST Memory Resize        (0x0e)
        System Firmwares          (0x0f)   Event Logging Disabled    (0x10)
        Watchdog1                 (0x11)   System Event              (0x12)
        Critical Interrupt        (0x13)   Button                    (0x14)
        Module / Board            (0x15)   Microcontroller           (0x16)
        Add-in Card               (0x17)   Chassis                   (0x18)
        Chip Set                  (0x19)   Other FRU                 (0x1a)
        Cable / Interconnect      (0x1b)   Terminator                (0x1c)
        System Boot Initiated     (0x1d)   Boot Error                (0x1e)
        OS Boot                   (0x1f)   OS Critical Stop          (0x20)
        Slot / Connector          (0x21)   System ACPI Power State   (0x22)
        Watchdog2                 (0x23)   Platform Alert            (0x24)
        Entity Presence           (0x25)   Monitor ASIC              (0x26)
        LAN                       (0x27)   Management Subsys Health  (0x28)
        Battery                   (0x29)   Session Audit             (0x2a)
        Version Change            (0x2b)   FRU State                 (0x2c)


12. Using System Chassis to initiate power on / off / reset / soft shutdown


!!!!!  Beware only run this if you know what you're realling doing don't just paste into a production system, If you do so it is your responsibility !!!!! 

–  do a soft-shutdown via acpi 


ipmitool [chassis] power soft


– issue a hard power off, wait 1s, power on 


ipmitool [chassis] power cycle


– run a hard power off


ipmitool [chassis] power off

 
– do a hard power on 


ipmitool [chassis] power on


–  issue a hard reset


ipmitool [chassis] power reset


– Get system power status
 

ipmitool chassis power status


13. Use IPMI (SoL) Serial over Lan to execute commands remotely


Besides using ipmitool locally on server that had its IPMI / ILO / DRAC console disabled it could be used also to query and make server do stuff remotely.

If not loaded you will have to load lanplus kernel module.
 

modprobe lanplus


 ipmitool -I lanplus -H 192.168.99.1 -U user -P pass chassis power status

ipmitool -I lanplus -H 192.168.98.1 -U user -P pass chassis power status

ipmitool -I lanplus -H 192.168.98.1 -U user -P pass chassis power reset

ipmitool -I lanplus -H 192.168.98.1 -U user -P pass chassis power reset

ipmitool -I lanplus -H 192.168.98.1 -U user -P pass password sol activate

– Deactivating Sol server capabilities
 

 ipmitool -I lanplus -H 192.168.99.1 -U user -P pass sol deactivate


14. Modify boot device order on next boot


!!!!! Do not run this except you want to really modify Boot device order, carelessly copy pasting could leave your server unbootable on next boot !!!!!

– Set first boot device to be as BIOS

ipmitool chassis bootdev bios


– Set first boot device to be CD Drive

ipmitool chassis bootdev cdrom 


– Set first boot device to be via Network Boot PXE protocol

ipmitool chassis bootdev pxe 


15. Using ipmitool shell


root@iqtestfb:~# ipmitool shell
ipmitool> 
help
Commands:
        raw           Send a RAW IPMI request and print response
        i2c           Send an I2C Master Write-Read command and print response
        spd           Print SPD info from remote I2C device
        lan           Configure LAN Channels
        chassis       Get chassis status and set power state
        power         Shortcut to chassis power commands
        event         Send pre-defined events to MC
        mc            Management Controller status and global enables
        sdr           Print Sensor Data Repository entries and readings
        sensor        Print detailed sensor information
        fru           Print built-in FRU and scan SDR for FRU locators
        gendev        Read/Write Device associated with Generic Device locators sdr
        sel           Print System Event Log (SEL)
        pef           Configure Platform Event Filtering (PEF)
        sol           Configure and connect IPMIv2.0 Serial-over-LAN
        tsol          Configure and connect with Tyan IPMIv1.5 Serial-over-LAN
        isol          Configure IPMIv1.5 Serial-over-LAN
        user          Configure Management Controller users
        channel       Configure Management Controller channels
        session       Print session information
        dcmi          Data Center Management Interface
        sunoem        OEM Commands for Sun servers
        kontronoem    OEM Commands for Kontron devices
        picmg         Run a PICMG/ATCA extended cmd
        fwum          Update IPMC using Kontron OEM Firmware Update Manager
        firewall      Configure Firmware Firewall
        delloem       OEM Commands for Dell systems
        shell         Launch interactive IPMI shell
        exec          Run list of commands from file
        set           Set runtime variable for shell and exec
        hpm           Update HPM components using PICMG HPM.1 file
        ekanalyzer    run FRU-Ekeying analyzer using FRU files
        ime           Update Intel Manageability Engine Firmware
ipmitool>


16. Changing BMC / DRAC time setting


# ipmitool -H XXX.XXX.XXX.XXX -U root -P pass sel time set "01/21/2011 16:20:44"


17. Loading script of IPMI commands

# ipmitool exec /path-to-script/script-with-instructions.txt  


Closure

As you saw ipmitool can be used to do plenty of cool things both locally or remotely on a server that had IPMI server interface available. The tool is mega useful in case if ILO console gets hanged as it can be used to reset it.
I explained shortly what is Intelligent Platform Management Interface, how it can be accessed and used on Linux via ipmitool. I went through some of its basic use, how it can be used to print the configured ILO access IP how
this Admin IP and Network configuration can be changed, how to print the IPMI existing users and how to add new Admin and non-privileged users.
Then I've shown how a system hardware and firmware could be shown, how IPMI management BMC could be reset in case if it hanging and how hardware system even logs can be printed (useful in case of hardware failure errors etc.), how to print reports on current system fan / power supply  and temperature. Finally explained how server chassis could be used for soft and cold server reboots locally or via SoL (Serial Over Lan) and how boot order of system could be modified.

ipmitool is a great tool to further automate different sysadmin tasks with shell scrpts for stuff such as tracking servers for a failing hardware and auto-reboot of inacessible failed servers to guarantee Higher Level of availability.
Hope you enjoyed artcle .. It wll be interested to hear of any other known ipmitool scripts or use, if you know such please share it.
What is inode and how to find out which directory is eating up all your filesystem inodes on Linux, Increase inode count on a ext3 ext4 and ufs filesystems

Tuesday, August 20th, 2019

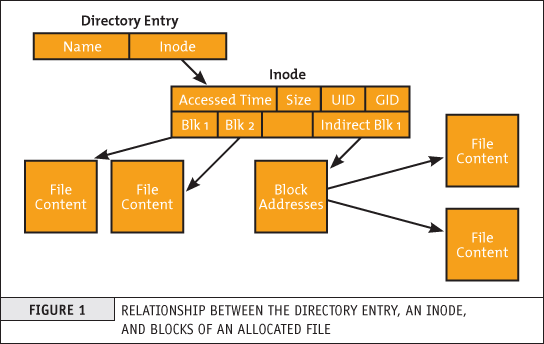
what-is-inode-find-out-which-filesystem-or-directory-eating-up-all-your-system-inodes-linux_inode_diagram

If you're a system administrator of multiple Linux servers used for Web serving delivery / Mail server sysadmin, Database admin or any High amount of Drives Data Storage used for backup servers infra, Data Repository administrator such as Linux hosted Samba / CIFS shares, etc. or using some Linux Hosting Provider to host your website or any other UNIX like Infrastructure servers that demands a storage of high number of files under a Directory  you might end up with the common filesystem inode depletion issues ( Maximum Inode number for a filesystem is predefined, limited and depending on the filesystem configured size).

In case a directory stored files end up exceding the amount of possible addressable inodes could prevent any data to be further assiged and stored on the Filesystem.

When a device runs out of inodes, new files cannot be created on the device, even though there may be plenty free space available and the first time it happened to me very long time ago I was completely puzzled how this is possible as I was not aware of Inodes existence  …

Reaching maximum inodes number (e.g. inode depletion), often happens on Busy Mail servers (receivng tons of SPAM email messages) or Content Delivery Network (CDN – Website Image caching servers) which contain many small files on EXT3 or EXT4 Journalled filesystems. File systems (such as Btrfs, JFS or XFS) escape this limitation with extents or dynamic inode allocation, which can 'grow' the file system or increase the number of inodes.


Hence ending being out of inodes could cause various oddities on how stored data behaves or communicated to other connected microservices and could lead to random application disruptions and odd results costing you many hours of various debugging to find the root cause of inodes (index nodes) being out of order.

In below article, I will try to give an overall explanation on what is an I-Node on a filesystem, how inodes of FS unit could be seen, how to diagnose a possible inode poblem – e.g.  see the maximum amount of inodes available per filesystem and how to prepare (format) a new filesystem with incrsed set of maximum inodes.


What are filesystem i-nodes?


This is a data structure in a Unix-style file system that describes a file-system object such as a file or a directory.
The data structure described in the inodes might vary slightly depending on the filesystem but usually on EXT3 / EXT4 Linux filesystems each inode stores the index to block that contains attributes and disk block location(s) of the object's data.
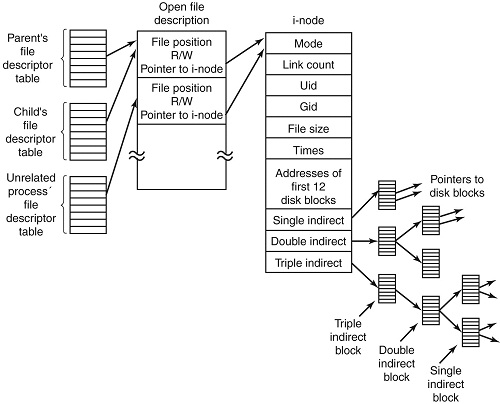
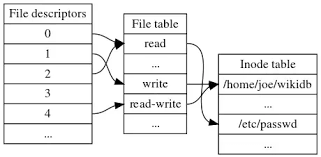
– Yes for those who are not aware on how a filesystem is structured on *nix it does allocate all stored data in logical separeted structures called data blocks. Each file stored on a local filesystem has a file descriptor, there are virtual unit structures file tables and each of the inodes that are a reference number has a own data structure (inode table).

Inodes / "Index" are slightly unusual on file system structure that stored the access information of files as a flat array on the disk, with all the hierarchical directory information living aside from this as explained by Unix creator and pioneer- Dennis Ritchie (passed away few years ago).

what-is-inode-very-simplified-explanation-diagram-data

Simplified explanation on file descriptors, file table and inode, table on a common Linux filesystem

Here is another description on what is I-node, given by Ken Thompson (another Unix pioneer and father of Unix) and Denis Ritchie, described in their paper published in 1978:

"    As mentioned in Section 3.2 above, a directory entry contains only a name for the associated file and a pointer to the file itself. This pointer is an integer called the i-number (for index number) of the file. When the file is accessed, its i-number is used as an index into a system table (the i-list) stored in a known part of the device on which the directory resides. The entry found thereby (the file's i-node) contains the description of the file:…
    — The UNIX Time-Sharing System, The Bell System Technical Journal, 1978  "


What is typical content of inode and how I-nodes play with rest of Filesystem units?


The inode is just a reference index to a data block (unit) that contains File-system object attributes. It may include metadata information such as (times of last change, access, modification), as well as owner and permission data.


On a Linux / Unix filesystem, directories are lists of names assigned to inodes. A directory contains an entry for itself, its parent, and each of its children.

Structure-of-inode-table-on-Linux-Filesystem-diagram


Structure of inode table-on Linux Filesystem diagram (picture source GeeksForGeeks.org)

  • Information about files(data) are sometimes called metadata. So you can even say it in another way, "An inode is metadata of the data."
  •  Inode : Its a complex data-structure that contains all the necessary information to specify a file. It includes the memory layout of the file on disk, file permissions, access time, number of different links to the file etc.
  •  Global File table : It contains information that is global to the kernel e.g. the byte offset in the file where the user's next read/write will start and the access rights allowed to the opening process.
  • Process file descriptor table : maintained by the kernel, that in turn indexes into a system-wide table of files opened by all processes, called the file table .

The inode number indexes a table of inodes in a known location on the device. From the inode number, the kernel's file system driver can access the inode contents, including the location of the file – thus allowing access to the file.

  •     Inodes do not contain its hardlink names, only other file metadata.
  •     Unix directories are lists of association structures, each of which contains one filename and one inode number.
  •     The file system driver must search a directory looking for a particular filename and then convert the filename to the correct corresponding inode number.

The operating system kernel's in-memory representation of this data is called struct inode in Linux. Systems derived from BSD use the term vnode, with the v of vnode referring to the kernel's virtual file system layer.


But enough technical specifics, lets get into some practical experience on managing Filesystem inodes.
 

Listing inodes on a Fileystem


Lets say we wan to to list an inode number reference ID for the Linux kernel (files):


root@linux: # ls -i /boot/vmlinuz-*
 3055760 /boot/vmlinuz-3.2.0-4-amd64   26091901 /boot/vmlinuz-4.9.0-7-amd64
 3055719 /boot/vmlinuz-4.19.0-5-amd64  26095807 /boot/vmlinuz-4.9.0-8-amd64


To list an inode of all files in the kernel specific boot directory /boot:


root@linux: # ls -id /boot/
26091521 /boot/


Listing inodes for all files stored in a directory is also done by adding the -i ls command flag:

Note the the '-1' flag was added to to show files in 1 column without info for ownership permissions


root@linux:/# ls -1i /boot/
26091782 config-3.2.0-4-amd64
 3055716 config-4.19.0-5-amd64
26091900 config-4.9.0-7-amd64
26095806 config-4.9.0-8-amd64
26091525 grub/
 3055848 initrd.img-3.2.0-4-amd64
 3055644 initrd.img-4.19.0-5-amd64
26091902 initrd.img-4.9.0-7-amd64
 3055657 initrd.img-4.9.0-8-amd64
26091756 System.map-3.2.0-4-amd64
 3055703 System.map-4.19.0-5-amd64
26091899 System.map-4.9.0-7-amd64
26095805 System.map-4.9.0-8-amd64
 3055760 vmlinuz-3.2.0-4-amd64
 3055719 vmlinuz-4.19.0-5-amd64
26091901 vmlinuz-4.9.0-7-amd64
26095807 vmlinuz-4.9.0-8-amd64


To get more information about Linux directory, file, such as blocks used by file-unit, Last Access, Modify and Change times, current External Symbolic or Static links for filesystem object:
 

root@linux:/ # stat /etc/
  File: /etc/
  Size: 16384         Blocks: 32         IO Block: 4096   catalog
Device: 801h/2049d    Inode: 6365185     Links: 231
Access: (0755/drwxr-xr-x)  Uid: (    0/    root)   Gid: (    0/    root)
Access: 2019-08-20 06:29:39.946498435 +0300
Modify: 2019-08-14 13:53:51.382564330 +0300
Change: 2019-08-14 13:53:51.382564330 +0300
 Birth: –


Within a POSIX system (Linux-es) and *BSD are more or less such, a file has the following attributes[9] which may be retrieved by the stat system call:

   – Device ID (this identifies the device containing the file; that is, the scope of uniqueness of the serial number).
    File serial numbers.
    – The file mode which determines the file type and how the file's owner, its group, and others can access the file.
    – A link count telling how many hard links point to the inode.
    – The User ID of the file's owner.
    – The Group ID of the file.
    – The device ID of the file if it is a device file.
    – The size of the file in bytes.
    – Timestamps telling when the inode itself was last modified (ctime, inode change time), the file content last modified (mtime, modification time), and last accessed (atime, access time).
    – The preferred I/O block size.
    – The number of blocks allocated to this file.


Getting more extensive information on a mounted filesystem


Most Linuxes have the tune2fs installed by default (in debian Linux this is through e2fsprogs) package, with it one can get a very good indepth information on a mounted filesystem, lets say about the ( / ) root FS.
 

root@linux:~# tune2fs -l /dev/sda1
tune2fs 1.44.5 (15-Dec-2018)
Filesystem volume name:   <none>
Last mounted on:          /
Filesystem UUID:          abe6f5b9-42cb-48b6-ae0a-5dda350bc322
Filesystem magic number:  0xEF53
Filesystem revision #:    1 (dynamic)
Filesystem features:      has_journal ext_attr resize_inode dir_index filetype needs_recovery sparse_super large_file
Filesystem flags:         signed_directory_hash
Default mount options:    (none)
Filesystem state:         clean
Errors behavior:          Continue
Filesystem OS type:       Linux
Inode count:              30162944
Block count:              120648960
Reserved block count:     6032448
Free blocks:              13830683
Free inodes:              26575654
First block:              0
Block size:               4096
Fragment size:            4096
Reserved GDT blocks:      995
Blocks per group:         32768
Fragments per group:      32768
Inodes per group:         8192
Inode blocks per group:   512
Filesystem created:       Thu Sep  6 21:44:22 2012
Last mount time:          Sat Jul 20 11:33:38 2019
Last write time:          Sat Jul 20 11:33:28 2019
Mount count:              6
Maximum mount count:      22
Last checked:             Fri May 10 18:32:27 2019
Check interval:           15552000 (6 months)
Next check after:         Wed Nov  6 17:32:27 2019
Lifetime writes:          338 GB
Reserved blocks uid:      0 (user root)
Reserved blocks gid:      0 (group root)
First inode:              11
Inode size:              256
Required extra isize:     28
Desired extra isize:      28
Journal inode:            8
First orphan inode:       21554129
Default directory hash:   half_md4
Directory Hash Seed:      d54c5a90-bc2d-4e22-8889-568d3fd8d54f
Journal backup:           inode blocks


Important note to make here is file's inode number stays the same when it is moved to another directory on the same device, or when the disk is defragmented which may change its physical location. This also implies that completely conforming inode behavior is impossible to implement with many non-Unix file systems, such as FAT and its descendants, which don't have a way of storing this invariance when both a file's directory entry and its data are moved around. Also one inode could point to a file and a copy of the file or even a file and a symlink could point to the same inode, below is example:

$ ls -l -i /usr/bin/perl*
266327 -rwxr-xr-x 2 root root 10376 Mar 18  2013 /usr/bin/perl
266327 -rwxr-xr-x 2 root root 10376 Mar 18  2013 /usr/bin/perl5.14.2

A good to know is inodes are always unique values, so you can't have the same inode number duplicated. If a directory is damaged, only the names of the things are lost and the inodes become the so called “orphan”, e.g.  inodes without names but luckily this is recoverable. As the theory behind inodes is quite complicated and is complicated to explain here, I warmly recommend you read Ian Dallen's Unix / Linux / Filesystems – directories inodes hardlinks tutorial – which is among the best academic Tutorials explaining various specifics about inodes online.


How to Get inodes per mounted filesystem


root@linux:/home/hipo# df -i
Filesystem       Inodes  IUsed   IFree IUse% Mounted on


dev             2041439     481   2040958   1% /dev
tmpfs            2046359     976   2045383   1% /run
tmpfs            2046359       4   2046355   1% /dev/shm
tmpfs            2046359       6   2046353   1% /run/lock
tmpfs            2046359      17   2046342   1% /sys/fs/cgroup
/dev/sdb5        1221600    2562   1219038   1% /usr/var/lib/mysql
/dev/sdb6        6111232  747460   5363772  13% /var/www/htdocs
/dev/sdc1      122093568 3083005 119010563   3% /mnt/backups
tmpfs            2046359      13   2046346   1% /run/user/1000


As you see in above output Inodes reported for each of mounted filesystems has a specific number. In above output IFree on every mounted FS locally on Physical installed OS Linux is good.


Here is an example on how to recognize a depleted Inodes on a OpenXen Virtual Machine with attached Virtual Hard disks.

linux:~# df -i
Filesystem         Inodes     IUsed      IFree     IUse%   Mounted on
/dev/xvda         2080768    2080768     0      100%    /
tmpfs             92187      3          92184   1%     /lib/init/rw
varrun            92187      38          92149   1%    /var/run
varlock            92187      4          92183   1%    /var/lock
udev              92187     4404        87783   5%    /dev
tmpfs             92187       1         92186   1%    /dev/shm


Finding files with a certain inode


At some cases if you want to check all the copy files of a certain file that have the same i-node pointer it is useful to find them all by their shared inode this is possible with simple find (below example is for /usr/bin/perl binary sharing same inode as perl5.28.1:


ls -i /usr/bin/perl
23798851 /usr/bin/perl*


 find /usr/bin -inum 435308 -print
/usr/bin/perl5.28.1
/usr/bin/perl


Find directory that has a large number of files in it?

To get an overall number of inodes allocated by a certain directory, lets say /usr /var


root@linux:/var# du -s –inodes /usr /var
566931    /usr
56020    /var/

To get a list of directories use by inode for a directory with its main contained sub-directories sorted from 1 till highest number use:
 

du -s –inodes * 2>/dev/null |sort -g


Usually running out of inodes means there is a directory / fs mounts that has too many (small files) that are depleting the max count of possible inodes.

The most simple way to list directories and number of files in them on the server root directory is with a small bash shell loop like so:
 

for i in /*; do echo $i; find $i |wc -l; done


Another way to identify the exact directory that is most likely the bottleneck for the inode depletion in a sorted by file count, human readable form:
 

find / -xdev -printf '%h\n' | sort | uniq -c | sort -k 1 -n


This will dump a list of every directory on the root (/) filesystem prefixed with the number of files (and subdirectories) in that directory. Thus the directory with the largest number of files will be at the bottom.


The -xdev switch is used to instruct find to narrow it's search to only the device where you're initiating the search (any other sub-mounted NAS / NFS filesystems from a different device will be omited).


Print top 10 subdirectories with Highest Inode Usage


Once identifed the largest number of files directories that is perhaps the issue, to further get a list of Top subdirectories in it with highest amount of inodes used, use below cmd:


for i in `ls -1A`; do echo "`find $i | sort -u | wc -l` $i"; done | sort -rn | head -10


To list more than 10 of the top inodes used dirs change the head -10 to whatever num needed.

N.B. ! Be very cautious when running above 2 find commands on a very large filesystems as it will be I/O Excessive and in filesystems that has some failing blocks this could create further problems.

To omit putting a high I/O load on a production filesystem, it is possible to also use du + very complex regular expression:
 

cd /backup
du –inodes -S | sort -rh | sed -n         '1,50{/^.\{71\}/s/^\(.\{30\}\).*\(.\{37\}\)$/\1…\2/;p}'


Results returned are from top to bottom.


How to Increase the amount of Inodes count on a new created volume EXT4 filesystem

Some FS-es XFS, JFS do have an auto-increase inode feature in case if their is physical space, whether otheres such as reiserfs does not have inodes at all but still have a field reported when queried for errors. But the classical Linux ext3 / ext4 does not have a way to increase the inode number on a live filesystem. Instead the way to do it there is to prepare a brand new filesystem on a Disk / NAS / attached storage.

The number of inodes at format-time of the block storage can be as high as 4 billion inodes. Before you create the new FS, you have to partition the new the block storage as ext4 with lets say parted command (or nullify the content of an with dd to clean up any previous existing data on a volume if there was already existing data:
 

parted /dev/sda


dd if=/dev/zero of=/dev/path/to/volume


  then format it with this additional parameter:


mkfs.ext4 -N 3000000000 /dev/path/to/volume


Here in above example the newly created filesystem of EXT4 type will be created with 3 Billion inodes !, for setting a higher number on older ext3 filesystem max inode count mkfs.ext3 could be used instead.

Bear in mind that 3 Billion number is a too high number and if you plan to have some large number of files / directories / links structures just raise it up to your pre-planning requirements for FS. In most cases it will be rarely anyone that want to have this number higher than 1 or 2 billion of inodes.

On FreeBSD / NetBSD / OpenBSD setting inode maximum number for a UFS / UFS2 (which is current default FreeBSD FS), this could be done via newfs filesystem creation command after the disk has been labeled with disklabel:


freebsd# newfs -i 1024 /dev/ada0s1d


Increase the Max Count of Inodes for a /tmp filesystem


Sometimes on some machines it is necessery to have ability to store very high number of small files (e.g. have a very large number of inodes) on a temporary filesystem kept in memory. For example some web applications served by Web Server Apache + PHP, Nginx + Perl-FastCGI are written in a bad manner so they kept tons of temporary files in /tmp, leading to issues with exceeded amount of inodes.
If that's the case to temporary work around you can increase the count of Inodes for /tmp to a very high number like 2 billions using:


mount -o remount,nr_inodes=<bignum> /tmp

To make the change permanent on next boot if needed don't forget to put the nr_inodes=whatever_bignum as a mount option for the temporary fs to /etc/fstab

Eventually, if you face this issues it is best to immediately track which application produced the mess and ask the developer to fix his messed up programs architecture.


Conclusion


It was explained on the very common issue of having maximum amount of inodes on a filesystem depleted and the unpleasent consequences of inability to create new files on living FS.
Then a general overview was given on what is inode on a Linux / Unix filesystem, what is typical content of inode, how inode addressing is handled on a FS. Further was explained how to get basic information about available inodes on a filesystem, how to get a filename/s based on inode number (with find), the well known way to determine inode number of a directory or file (with ls) and get more extensive information on a FS on inodes with tune2fs.
Also was explained how to identify directories containing multitudes of files in order to determine a sub-directories that is consuming most of the inodes on a filesystem. Finally it was explained very raughly how to prepare an ext4 filesystem from scratch with predefined number to inodes to much higher than the usual defaults by mkfs.ext3 / mkfs.ext4 and *bsds newfs as well as how to raise the number of inodes of /tmp tmpfs temporary RAM filesystem.

Find all running hosts, used IPs and ports on your local wireless / ethernet network or how to do a basic network security audit with nmap

Monday, September 4th, 2017

Find all running hosts / used IPs on your local wireless or ethernet network

nmap-scn-local-network-find-all-running-hosts-used-IPs-on-your-wireless-ethernet-network

If you're using a Free Software OS such as GNU / Linux or some other proprietary OS such as Mac OS X or Windows and you need a quick way to check all running IPs hosts / nodes locally on your current connected Ethernet or Wireless network, here is how to do it with nmap (Network exploration and security tool port scanner).

So why would you do scan that? 

Well just for fun, out of curiousity or just because you want to inspect your local network whether someone unexpected cracker did not break and is not using your Wi-Fi or Ethernet local network and badly snoring your network listening for passwords.

Before you start you should have installed NMAP network scanner on your GNU / Linux, to do so on 

Redhat Based Linux (Fedora / CentOS / Redhat Enterprise RHEL):


yum -y install nmap


On Deb based GNU / Linux-es such as Ubuntu / Mint / Debian etc.


apt-get install –yes nmap


To install nmap on FreeBSD / NetBSD / OpenBSD OS issue from console or terminal:


cd /usr/ports/security/nmap
make install clean 


or if you prefer to install it from latest binary instead of compiling


pkg_add -vr nmap


On a proprietary Mac OS X (I don't recommend you to use this obnoxious OS which is designed as a proprpietary software to steal your freedom and control you, but anyways for Mac OS victims), you can do it to with Macs equivalent tool of apt-get / yum called homebrew:

Open Mac OS X terminal and to install homebrew run:


ruby -e "$(curl -fsSL https://raw.githubusercontent.com/Homebrew/install/master/install)"
brew install nmap
brew search nmap
brew info nmap


If you want to do it system wide become root (super user) from Mac terminal with


su root


and run above commands as administrator user.

Windows users might take a look at Nmap for Windows or use the M$ Windows native portqry command line port scanner

Test whether nmap is properly installed and ready to use with command:


nmap –help
Nmap 6.00 ( http://nmap.org )
Usage: nmap [Scan Type(s)] [Options] {target specification}
TARGET SPECIFICATION:
  Can pass hostnames, IP addresses, networks, etc.
  Ex: scanme.nmap.org, microsoft.com/24, 192.168.0.1; 10.0.0-255.1-254
  -iL <inputfilename>: Input from list of hosts/networks
  -iR <num hosts>: Choose random targets
  –exclude <host1[,host2][,host3],…>: Exclude hosts/networks
  –excludefile <exclude_file>: Exclude list from file
HOST DISCOVERY:
  -sL: List Scan – simply list targets to scan
  -sn: Ping Scan – disable port scan
  -Pn: Treat all hosts as online — skip host discovery
  -PS/PA/PU/PY[portlist]: TCP SYN/ACK, UDP or SCTP discovery to given ports
  -PE/PP/PM: ICMP echo, timestamp, and netmask request discovery probes
  -PO[protocol list]: IP Protocol Ping
  -n/-R: Never do DNS resolution/Always resolve [default: sometimes]
  –dns-servers <serv1[,serv2],…>: Specify custom DNS servers
  –system-dns: Use OS's DNS resolver
  –traceroute: Trace hop path to each host
SCAN TECHNIQUES:
  -sS/sT/sA/sW/sM: TCP SYN/Connect()/ACK/Window/Maimon scans
  -sU: UDP Scan
  -sN/sF/sX: TCP Null, FIN, and Xmas scans
  –scanflags <flags>: Customize TCP scan flags
  -sI <zombie host[:probeport]>: Idle scan
  -sY/sZ: SCTP INIT/COOKIE-ECHO scans
  -sO: IP protocol scan
  -b <FTP relay host>: FTP bounce scan
PORT SPECIFICATION AND SCAN ORDER:
  -p <port ranges>: Only scan specified ports
    Ex: -p22; -p1-65535; -p U:53,111,137,T:21-25,80,139,8080,S:9
  -F: Fast mode – Scan fewer ports than the default scan
  -r: Scan ports consecutively – don't randomize
  –top-ports <number>: Scan <number> most common ports
  –port-ratio <ratio>: Scan ports more common than <ratio>
SERVICE/VERSION DETECTION:
  -sV: Probe open ports to determine service/version info
  –version-intensity <level>: Set from 0 (light) to 9 (try all probes)
  –version-light: Limit to most likely probes (intensity 2)
  –version-all: Try every single probe (intensity 9)
  –version-trace: Show detailed version scan activity (for debugging)
SCRIPT SCAN:
  -sC: equivalent to –script=default
  –script=<Lua scripts>: <Lua scripts> is a comma separated list of 
           directories, script-files or script-categories
  –script-args=<n1=v1,[n2=v2,…]>: provide arguments to scripts
  –script-args-file=filename: provide NSE script args in a file
  –script-trace: Show all data sent and received
  –script-updatedb: Update the script database.
  –script-help=<Lua scripts>: Show help about scripts.
           <Lua scripts> is a comma separted list of script-files or
           script-categories.
OS DETECTION:
  -O: Enable OS detection
  –osscan-limit: Limit OS detection to promising targets
  –osscan-guess: Guess OS more aggressively
TIMING AND PERFORMANCE:
  Options which take <time> are in seconds, or append 'ms' (milliseconds),
  's' (seconds), 'm' (minutes), or 'h' (hours) to the value (e.g. 30m).
  -T<0-5>: Set timing template (higher is faster)
  –min-hostgroup/max-hostgroup <size>: Parallel host scan group sizes
  –min-parallelism/max-parallelism <numprobes>: Probe parallelization
  –min-rtt-timeout/max-rtt-timeout/initial-rtt-timeout <time>: Specifies
      probe round trip time.
  –max-retries <tries>: Caps number of port scan probe retransmissions.
  –host-timeout <time>: Give up on target after this long
  –scan-delay/–max-scan-delay <time>: Adjust delay between probes
  –min-rate <number>: Send packets no slower than <number> per second
  –max-rate <number>: Send packets no faster than <number> per second
FIREWALL/IDS EVASION AND SPOOFING:
  -f; –mtu <val>: fragment packets (optionally w/given MTU)
  -D <decoy1,decoy2[,ME],…>: Cloak a scan with decoys
  -S <IP_Address>: Spoof source address
  -e <iface>: Use specified interface
  -g/–source-port <portnum>: Use given port number
  –data-length <num>: Append random data to sent packets
  –ip-options <options>: Send packets with specified ip options
  –ttl <val>: Set IP time-to-live field
  –spoof-mac <mac address/prefix/vendor name>: Spoof your MAC address
  –badsum: Send packets with a bogus TCP/UDP/SCTP checksum
OUTPUT:
  -oN/-oX/-oS/-oG <file>: Output scan in normal, XML, s|<rIpt kIddi3,
     and Grepable format, respectively, to the given filename.
  -oA <basename>: Output in the three major formats at once
  -v: Increase verbosity level (use -vv or more for greater effect)
  -d: Increase debugging level (use -dd or more for greater effect)
  –reason: Display the reason a port is in a particular state
  –open: Only show open (or possibly open) ports
  –packet-trace: Show all packets sent and received
  –iflist: Print host interfaces and routes (for debugging)
  –log-errors: Log errors/warnings to the normal-format output file
  –append-output: Append to rather than clobber specified output files
  –resume <filename>: Resume an aborted scan
  –stylesheet <path/URL>: XSL stylesheet to transform XML output to HTML
  –webxml: Reference stylesheet from Nmap.Org for more portable XML
  –no-stylesheet: Prevent associating of XSL stylesheet w/XML output
MISC:
  -6: Enable IPv6 scanning
  -A: Enable OS detection, version detection, script scanning, and traceroute
  –datadir <dirname>: Specify custom Nmap data file location
  –send-eth/–send-ip: Send using raw ethernet frames or IP packets
  –privileged: Assume that the user is fully privileged
  –unprivileged: Assume the user lacks raw socket privileges
  -V: Print version number
  -h: Print this help summary page.
EXAMPLES:
  nmap -v -A scanme.nmap.org
  nmap -v -sn 192.168.0.0/16 10.0.0.0/8
  nmap -v -iR 10000 -Pn -p 80
SEE THE MAN PAGE (http://nmap.org/book/man.html) FOR MORE OPTIONS AND EXAMPLES


Most local router local networks are running under an IP range of 192.168.0.1/24 (192.168.0.1.254) or 192.168.1.1/24 or at some weird occasions depending on how the router is configured it might be something like 192.168.10.0/24 to be sure on what kind of network your computer is configured, you can check with ifconfig command, what kind of network IP has the router assigned to your computer, here is output from my Debian GNU / Linux /sbin/ifconfig


 hipo@noah:~$ /sbin/ifconfig 
lo        Link encap:Local Loopback  
          inet addr:127.0.0.1  Mask:255.0.0.0
          inet6 addr: ::1/128 Scope:Host
          UP LOOPBACK RUNNING  MTU:16436  Metric:1
          RX packets:336 errors:0 dropped:0 overruns:0 frame:0
          TX packets:336 errors:0 dropped:0 overruns:0 carrier:0
          collisions:0 txqueuelen:0 
          RX bytes:26656 (26.0 KiB)  TX bytes:26656 (26.0 KiB)


wlan0     Link encap:Ethernet  HWaddr 00:1c:bf:bd:27:59  
          inet addr:192.168.0.103  Bcast:192.168.0.255  Mask:255.255.255.0
          inet6 addr: fe80::21c:bfff:ffbd:2759/64 Scope:Link
          UP BROADCAST RUNNING MULTICAST  MTU:1500  Metric:1
          RX packets:112836 errors:0 dropped:0 overruns:0 frame:0
          TX packets:55363 errors:0 dropped:0 overruns:0 carrier:0
          collisions:0 txqueuelen:1000 
          RX bytes:141318655 (134.7 MiB)  TX bytes:7391330 (7.0 MiB)


As evident from above output my router assigns IPs via DHCP once authenticated into the Wi-Fi router under standard IP range of 192.168.0.0/24

So under this IP range case, to inspect my small local networkconnected computer I had to run from gnome-terminal or under a /dev/ttyX virtual console:


hipo@noah:~$ nmap -sn 192.168.0.0/24

Starting Nmap 6.00 ( http://nmap.org ) at 2017-09-04 12:45 EEST
Nmap scan report for pcfreak (192.168.0.1)
Host is up (0.011s latency).
Nmap scan report for 192.168.0.103
Host is up (0.00011s latency).
Nmap done: 256 IP addresses (2 hosts up) scanned in 2.53 seconds


-sn argument instructs nmap to do the so called ping scan, e.g. not to do a port s
can after host discovery but just print available hosts that are responding

Some bigger corporate networks are configured to run a couple of local networks simultaneously such as 192.168.168.0.0/24, 192.168.1.0/24, 192.168.2.0/24 etc.

So if that's the case you can add more virtual IPs to your ifconfig after becoming root super user with:


hipo@noah:~$ su root 
Password: 
root@noah:/home/hipo# 


And then run:


/sbin/ifconfig wlan0:0 192.168.1.110 netmask 255.255.255.0
/sbin/ifconfig wlan0:1 192.168.2.110 netmask 255.255.255.0


etc.

Note that here I purposefully choose .110 IP because often the 192.168.1.1 is an IP assigned to the router and that might cause some IP conflicts and trigger alarms in the router security which I want to avoid.

To check just added extra Virtual IPs on wlan0 wireless interface (note that depending on your Wi-Fi card and your driver this interface might come under a different name on your computer):


root@noah# /sbin/ifconfig |grep -i wlan0 -A 1
wlan0     Link encap:Ethernet  HWaddr 00:1c:bf:bd:25:59  
          inet addr:192.168.0.103  Bcast:192.168.0.255  Mask:255.255.255.0

wlan0:0   Link encap:Ethernet  HWaddr 00:1c:bf:bd:25:59  
          inet addr:192.168.1.110  Bcast:192.168.1.255  Mask:255.255.255.0

wlan0:1   Link encap:Ethernet  HWaddr 00:1c:bf:bd:27:59  
          inet addr:192.168.2.110  Bcast:192.168.2.255  Mask:255.255.255.0


If you're scanning not on your own network but on a public connected network you might prefer to not use the ping scan as this might identify you in router's firewall as possible intruder and could cause you headaches, besides that some network connected nodes are connected to not respond on a ping scan (some networks purposefully disable pings at all) to avoid possibility of the so called ping flood that might overload a router buffer or bring down hosts on the network beinf flooded.

If you have doubts that a network has ping disabled and it shows no result you can give a try to the so called SYN / FIN Stealth packet scan with added requirement to scan for UDP open ports (-sS) argument


root@noah:/~# nmap -sS -sU -sT 192.168.0.1-255

Starting Nmap 6.00 ( http://nmap.org ) at 2017-09-04 13:31 EEST
Nmap scan report for pcfreak (192.168.0.1)
Host is up (0.012s latency).
Not shown: 998 closed ports
PORT     STATE SERVICE
80/tcp   open  http
1900/tcp open  upnp
MAC Address: 10:FE:ED:43:CF:0E (Unknown)

Nmap scan report for 192.168.0.100
Host is up (0.0036s latency).
Not shown: 998 closed ports
PORT      STATE SERVICE
625/tcp   open  apple-xsrvr-admin
49153/tcp open  unknown
MAC Address: 84:38:35:5F:28:75 (Unknown)

Nmap scan report for 192.168.0.103
Host is up (0.000012s latency).
Not shown: 999 closed ports
PORT   STATE SERVICE
22/tcp open  ssh


You might also like to add some verbosy (that would generate a lot of output so be careful):

In case if above scan fails due to firewalls and you have a ping scan disabled on the network too you might also try out the so called nmap connect TCP connect scan (-sT), that would avoid the SYN scan. The -sT is useful also if you're not possessing root superprivileges on nmap running host.


nmap -sS -sU 192.168.0.1-255


Note that connect scan could take ages as nmap tries to connect every port from default port scanned ranged on remote found hosts that are reporting as up and running.

If the shown results lead you find some unknown computer / tablet / mobile / phone device connected to your network, then connect to your router and thoroughfully inspect the traffic flowing through it, if you find intruder cut him off and change immediately your router passwords and monitor your network periodically to make sure the unwanted guest did not go back in future.

There is much more you can do with nmap so if you have some extra time and interest into penetration testing I recommend you check out Nmap Book (The Official Nmap project guide to Network Discovery and Security Scanning)

How to check Microsoft Windows uptime – Check server uptime in Windows server

Wednesday, May 21st, 2014

how-to-check-windows-uptime-windows-server-uptime-logo
In Linux to check uptime there is the uptime command, so how is it possible to check your system uptime – e.g. check when was last time Windows host was rebooted?

Or in other words what is Windows server equivalent to Linux's uptime command?

To check uptime on Windows OS, there is the:

net statistics server

command a shorter reference to this command is net stats srv

To run it quickest way is to press Windows (button)+r type cmd.exe and exec command in Windows command prompt:


C:UsersGeorgi>net statistics server
Server Statistics for \SM07862

Statistics since 21.05.2014 09:55:21

Sessions accepted 1
Sessions timed-out 0
Sessions errored-out 0

Kilobytes sent 0
Kilobytes received 0

Mean response time (msec) 0

System errors 0
Permission violations 0
Password violations 0

Files accessed 0
Communication devices accessed 0
Print jobs spooled 0

Times buffers exhausted

Big buffers 0
Request buffers 0

The command completed successfully.

C:UsersGeorgi>

Statistics since 21.05.2014 09:55:21 – shows when system booted last time, so to check the difference between current time and when system booted last – you need to check current time with time command


C:UsersGeorgi>time
The current time is: 16:59:26,60
Enter the new time:

Alternative command to check when Windows system booted is:

C:UsersGeorgi>systeminfo|findstr "System Boot Time"
System Boot Time: 21.05.2014, 09:54:11
System Manufacturer: HP
System Model: ProLiant BL460c G7
System Type: x64-based PC
System Directory: C:Windowssystem32
Boot Device: DeviceHarddiskVolume1
System Locale: de;German (Germany)
Time Zone: (UTC+01:00) Amsterdam, Berlin, Bern, Rome, Stockholm, Vienna

C:UsersGeorgi>

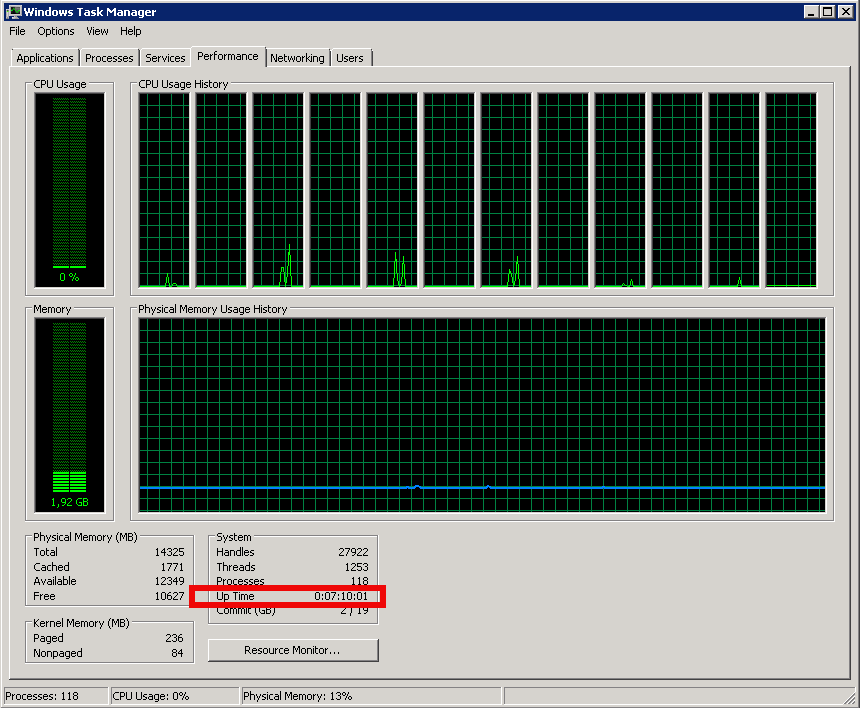
If you want to check Windows boot time "the Windows way" through the GUI, launch Windows Task Manager – run taskmgr command and go to Performance tab

images/check-windows-server-uptime-with-taskmanager-performance-tab-screenshot


How to make Print SysRQ keyboard key working on Slackware Linux’s XFCE

Saturday, March 17th, 2012

By default Slackware's XFCE, does not allow screenshot taking by simply pressing PrintScreen SysRQ, like is in most of the "more advanced" graphical environments (GNOME, KDE), MS-Windows 🙂 etc.

To have a key binding assinged to PrintScreen SysRQ key in XFCE, you will first need to have xfce4-screenshooter

I've earlier blogged on how to take screenshots on Slackware's XFCE by installing and using xfce4-screenshooter program , so I suggest you take a look at it.

After xfce4-screenshooter is installed start:

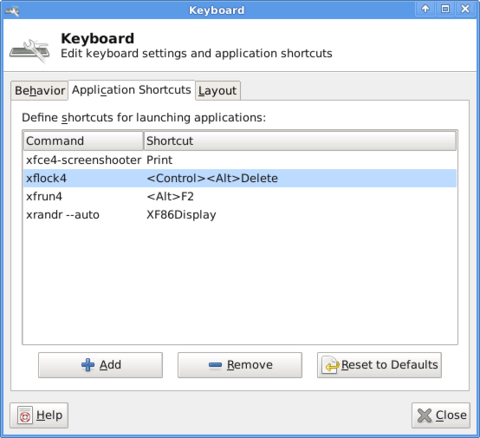
bash-4.1$ xfce4-keyboard-settings

XFCE4 keyboard settings window Slackware Linux screenshot

Further on go to:

Application Shortcuts (tab) -> Add

Type in the command prompt to appear xfce4-screenshooter and press the PrintScreen SysRQ keyboard button.
From now onwards pressing it will allow you to take screenshot like with GNOME's gnome-screenshot -i command.
Happy Screenshoting 😉

How to take area screenshots in GNOME – Take quick area selection screenshots in G* / Linux and BSD

Thursday, March 15th, 2012

Quick Area screenshot in GNOME how to make quick area selection screenshots in Linux and FreeBSD gnome-screenshot shot

Often when, you do something on your PC, you need to make a quick screenshot of a screen area.. Yes GNOME's feature to take complete screenshots of Screen with Print Screen SysRQ and consequential picture edit with GIMP is one way, but this is far away from quick. This method to chop out of a complete display screenshot usually takes from 40 secs to 1 minute to properly cut and save a selection of the whole picture.
Another common use, that I love in GNOME is the ALT + Print Screen SysRQ key combination. alt+ print scr sysrq is handy while taking a single window screenshot is desired. Anyways often you only need to make a screenshot of a tiny area of the screen. Many people might think this is not possible currently in GNOME, but they will be wrong as there are no impossible but hard things to achieve on Linux / FreeBSD 😉

There are at least two ways using a predefined command for taking quick area screen snapshot.

1. Taking quick area screenshot by using ImageMagick's import command

To use import you will need to have installed ImageMagickswiss army knife of command line image manipulation 😉
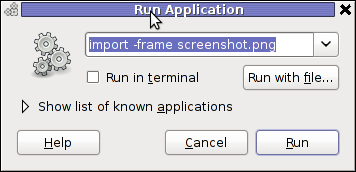
For area screenshot with import, press ALT+F2 and type inside Run Application box:

Screenshot GNOME run application GNU / Linux Debian ImageMagick import area screenshot

import -frame screenshot.png

Now make the selection of the exact screen area you would like to screeshot in file screenshot.png
Note that screenshot.png file will be saved by default in your home directory as it is read from $HOME shell variable:

hipo@noah:~$ echo $HOME/home/hipo
hipo@noah:~$ ls -al screenshot.png
-rw-r--r-- 1 hipo hipo 4950 Mar 14 21:11 screenshot.png

You see my $HOME equals /home/hipo, therefore screenshot.png just grabbed is saved in there.

One downside of taking the screenshot with import is that picture snapshot is not further edittable, if it has to be further processed with GIMP or some other graphic editor program.

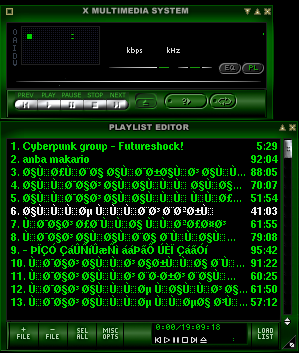
In the screenshot, below I show you one screen area of my XMMS taken with import -frame screenshot.png cmd:

XMMS Screen Area Screenshot import screenshot

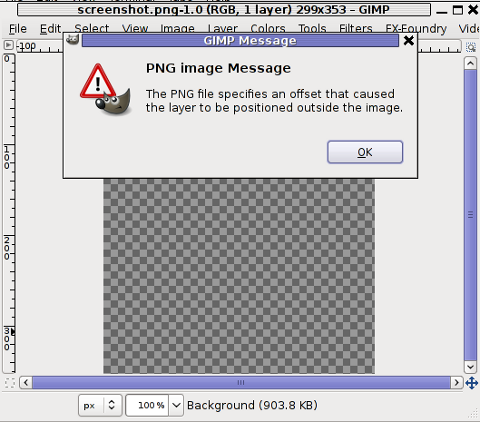
Trying to open the screenshot.png, file with GIMP displays the following error in GIMP:

PNG image message PNG the file specifies offset that caused the layer to be positioned outiside image GIMP screenshot

Not all area snapshots taken with import -frame, create this issue sometimes screenshots are opening in GIMP but only area of the screenshot.png is visible in gimp.

Thanksfull, there is work around to this issue by converting the import generated PNG format picture to JPEG with ImageMagick's convert and then edit the .JPEG with GIMP etc.:

hipo@noah:~$ convert screenshot.png screenshot.jpg

Hence to permanently work around it, in case you intend to apply (GIMP modifications), once area snapshot is made instruct import to save its output picture in .jpeg, e.g.:

hipo@noah:~$ import -frame screenshot.jpeg

2. Taking quick area screenshot using gnome-screenshot cmd

Once again invoke the GNOME command Launcher by pressing Alt+F2 (holding alt and pressing F2) and type in the launch box:

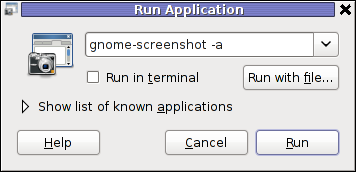
gnome-screenshot -a

gnome-screenshot Run Application in GNOME 2.30 on Debian GNU / Linux

Below is a small area from my desktop, chopped with gnome-screenshot 🙂

GNOME desktop area chop screenshot with gnome-screenshot on my home Debian Linux

You see on above screenshot a tiny (picture) icon one of the greatest, if not the greatest bulgarian saint – saint John of Rila. St. John's lived as hermit for many years in Rila mountain and by God's grace possessed incorruptable body. His incorruptable body is still kept and can be venerated in Rila Monastery. The monastery is located 160 km from Bulgaria's capital city Sofia

St. Johns first Bulgarian established monastery Rila Monastery is currently the biggest functioing monastery in Bulgaria. The saints monastery is considered one of the most holy places in Bulgaria. If you have a travel or plan a holiday in Bulgaria, I warmly recommend you go there and venerate the saint incorruptable relics.

3. Binding keys to allow quick area screenshot taking with gnome-screenshot in GNOME

This configuration is for GNOME 2.x and is tested to work on my Debian (Squeeze 6.0), GNOME ver. 2.30.2, it should work in earlier Ubuntu versions shipped with GNOME 2.2.xx too. As I've red on the Internet it works well with Ubuntu 10.10Binding a key for screenshot area grab, should be working properly also on any GNOME 2.2.x supporting OS, including the BSD family OSes (FreeBSD, OpenBSD, NetBSD)

a) setting gnome-screenshot key binding for interactive screenshot area grab

Navigate the mouse cursor to GNOME main menus panel in left top, where you see (Applications, Places, System).
Therein use menus:

System -> Preferences -> Keybord Shortcuts -> Add ->

Alternatively if you prefer you can directly invoke the Keyboard Shortcuts configuration with command:

hipo@noah:~$ gnome-keybinding-properties

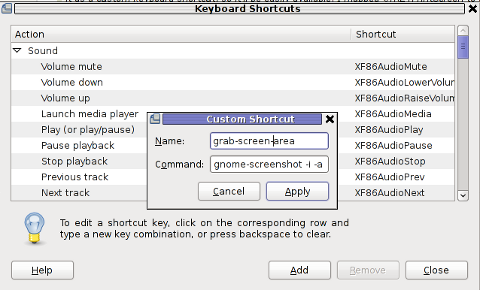
Further on, assign a shortcut by filling in something like:

name: grab-screen-area
command: gnome-screenshot -i -a

GNOME add keyboard shortcut map key for area interactive screenshot

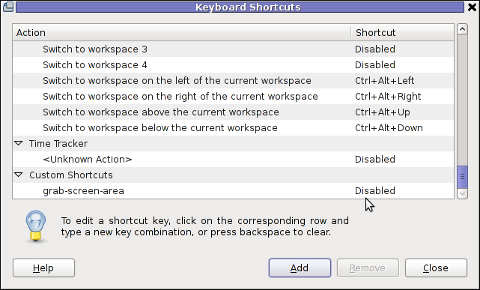
press Apply and next map a key to the new defined key binding:

GNOME add keyboard shortcut map key

Under the Shortcut column click on Disabled and assign some key combination to invoke the cmd for example Ctrl+F4

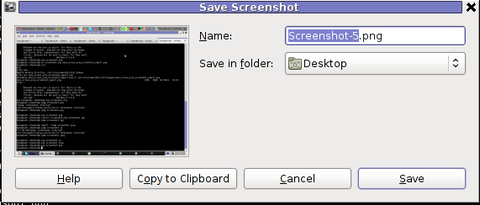
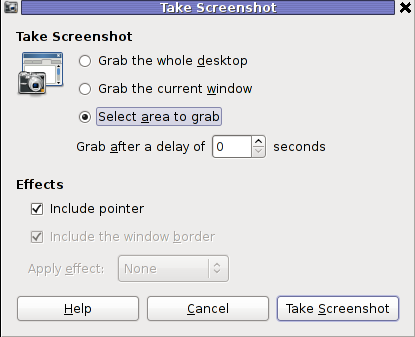
The command gnome-screenshot -i makes gnome-screenshot, show interactive make screenshot dialog like the one in below screenshot.

GNOME screenshot interactive screenshot select area grab shot

b) creating gnome-screenshot -a area screenshot key binding for quick area screenshots "on the fly"

The procedure is precisely the same as with adding interactive screenshot; Under Keyboard Shortcuts GNOME config assign new key binding by pressing Add button and adding:

name: grab-screen-area1
command: gnome-screenshot -a

Once again in Shortcut column in line starting with grab-screen-area1 add your desired key switch. I personally like Ctrl+Print Screen SysRQ as it is close to the default GNOME key combination assigned for taking screenshot for a Windows Alt+Print SysRq

It was logical, that this key binding should work and a direct selection mouse cursor to appear once Alt+Print SysRQ is pressed, however for some reason this is not working (hmm, maybe due to bug) ??

Thanksfully it is always possible to substitute the just assigned gnome-screenshot -a key binding with import -frame /home/hipo/Desktop/screenshot.png

If you have followed literally my article so far and you did tried to place a bind for gnome-screenshot -a, modifty grab-screen-area1 to be something like:

name: grab-screen-area1
command: import -frame /home/hipo/Desktop/screenshot.png

Where modify the path /home/hipo/Desktop/screenshot.png, to wherever you prefer the region screep capture to be stored.

c) bind keys for delayed screenshot

This also a handy binding, especially if you every now and then need to make screenshots of screen with a few secs interval.
Add one more keyboard shortcut;

name: grab-screen-area2
command: gnome-screenshot -d 5

Assign a key to make a screenshot of the active display after a delay of 5 seconds. I prefer Ctrl+F5

Onwards every time you would like to make an area screenshot, just use the defined keys:

Ctrl+F4 - will prompt you interactively for the precise type of screenshot you would like to take
Ctrl+Print SysRQ - will prompt you for a direct area to select and once selected will immediately screenshot it
Ctrl+F5 - would do delayed screenshot of entire screen after a delay of 5 seconds

4. Adding border and drop shadow effects with gnome-screenshot Actually, there is plenty of interesting things to do with Screenshots which I never thought were possible.
While reading gnome-screenshot's man page, I've stumbled to an interesting argument:

-e, --effect=EFFECT,
Add an effect to the outside of the screenshot border. EFFECT can be ``shadow'' (adding drop shadow), ``border'' (adding
rectangular space around the screenshot) or ``none'' (no effect). Default is ``none''.

This would have been a nice feature but as of time of writting this article, untofrtunately it is not working in GNOME 2.30.2. I'm not sure if this is a local Debian bug, however I suspect on other Linux distributions with different GNOME build configuration, this features might be working well. My guess here is drop shadow effect and border effect are not working because, gnome-screenshot was compiled without (support for ImageMagick?).
Anyways the way the feature is supposed to be work is by invoking commands:
:

hipo@noah:~$ gnome-screenshot --border-effect=shadow
hipo@noah:~$ nome-screenshot --border-effect=border

The same basic effects, are also available through GIMP's menus:

Image -> Effects

5. Setting default behaviour of gnome-screenshot in gconf-editor GConf (Gnome config registry db)

Experienced, GNOME users should already know about the existence of gconf-editor and the gnome registry database. For those who have don't, coming from MS-Windows background gconf-editor is GNOME (graphical environment) equivalent to Microsoft Windows registry regedit command

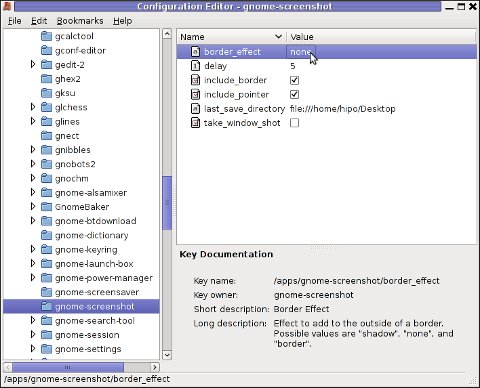
gconf-editor can be used to atune the way the screenshots are taken by default. To do so, launch gconf-editor cmd and follow to sub-structure:

/ -> apps -> gnome-screenshot

gconf-editor GNOME screenshot border effect none default gnome-screenshot gnome behaviour

The settings in above screenshot are configurations which are used by default by gnome-screenshot, right after install.
You can play with the options to change the default way PrintScreen SysRQ key press will take screenshots.
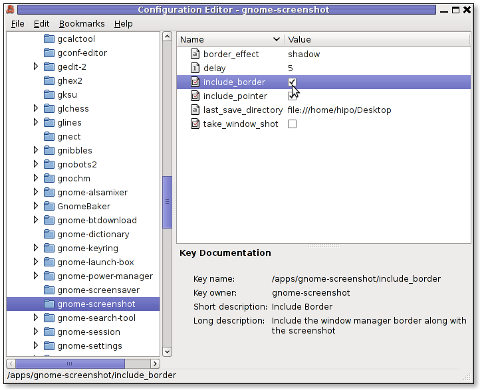
Here is one example for changing the gnome-screenshot default GNOME behaviour:

GConf Editor GNOME screenshot, border effect drop shadow and include border option set on Linux Debian

As you can see in above screenshot, I've changed my default gnome-screenshot snap taking to include a drop shadow effect:
Name | Value
border_effect | shadow include_border | (tick on)
last_save_directory | file://home/hipo/Desktop

As you see you can also control, where by default gnome-screenshot will save its screenshots, by default, its saved in $HOME/Desktop
. If you prefer some custom directory to only contain Screenshots taken for instance $HOME/Screenshots, create the directory:
hipo@noah:~$ mkdir ~/Screenshots

and then change the value for last_save_directory gconf var:

last_save_directory | file://home/hipo/Screenshots

Once settings are applied screenshots with Print Screen SysRQ key will be made with Shadow Border effect and saved in /home/hipo/Screenshots

Strangely enough, changing gnome-screenshot default screenshotting values to include screenshot effects like drop shadow or screenshot border effect works just fine.
Even though gnome-screenshot –border-effect=shadow and gnome-screenshot –border-effect=border doesn't directly affect the current screenshot to be made, I've later noticed writting this two commands in the gnome-terminal, does change the border settings for gconf-editor screenshot border.

If you enjoyed, this article and you intend to become "a professional screnshotter" :), you might also enjoy my two other articles:

Happy screenshotting 😉

How to print simple text pages on Linux in console with old LPR parallel port attached printer

Tuesday, February 7th, 2012

LPT parallel port pinout diagram with explanations

Many younger people, might not know lpr command, historically it was heavily used for printing in the early GNU / Linux days.
lpr ships the text to be printed to the printer which is physically attached on LPT (Line Print Terminal) parallel port . Those who lived the DOS era surely know in those "ancient" days, everyone who wanted to print has to use the LPT parallel port

Present time, everyone knows there is almost no modern printer that is attached to the PC via LPT port but rather the USB port is used for communication between the printer the computer.
Nevertheless The USB printers on Linux are managed by CUPS, the lpr command is still functional shipping the text to be printed via CUPS (cups-lpd daemon).
Before cups-lpd was introduced the service managing the print jobs was lpd
Hence lpr is still functional.

To print a plain text file of one page with lpr on Linux:

linux:~# cat text-file-to-print.txt | lpr

For multiple printers to switch between multiple printers there is the PRINTER shell variable:

linux:~# export PRINTER=printer-Name-and-Type

To print a really long text file (a book in TXT) the pr command comes handy. As you can read in the cmd manual pr converts text files for printing

Lets say you would like to have a 60 lines of text per printed page, the cmd to issue is:

linux:~# pr -l60 text-file-to-print.txt | lrp

All queued printing jobs can be reviewed with the lpq, if you have a printer attached try:

linux:~# lpq
lp is ready and printing
Rank Owner Job Files Total Size
active hipo 1 text-file-to-print.txt 62045 bytes

Since some years it is pretty rare for people to use lpq, since most of the parallel printing is managed by CUPS server, what most people use nowdays to check the printer queue is lpstat : e.g.

linux:~# lpstat
...

Printing status and all things related to queued jobs for printing gets logged in /var/log/lpr.log

There is even more simplistic way to print directly to the printer (if the printer is attached via a LPT port) through the kernel /dev/lp, for example:

linux:~# cat text-file-to-print.txt >> /dev/lp

For more than one printer attached the naming of /dev/lp, might probably be /dev/lp0, /dev/lp1 etc.
The lprm command also exists in case if you would like to cancel a printjob in the queue. Lets say I want to cancel a job in the queue with Job ID 5:

linux:~# lrpm 5
...

To cancel a current running job in the middle the /usr/bin/cancel command exists.

An interesting historic fact is that nowdays opening lpr, lpq or any of the other tools for simple text mode printing one sees on top of the page Apple Inc.

Lets clear this up CUPS (Common Unix Printing System) (open source) printing platform is not owned by Apple, since it is licensed under GPL2 and LGPL. The reason why the Apple Inc. shows up in man pages is because in year 2007, the founder of CUPS printing server Michael Sweet hired him to work for Apple Inc. "purchasing" the CUPS source. However as we know they did not really purchased the code, because the code was already belonging to the community (licensed under GPL2). Apple however as a marketing trick used the fact that Sweet worked for them and as probably as a matter of marketing asked him to place the Apple Inc. in the copyright source and manual areas. Obviously this is not true, since Apple Inc. does not hold copyright for CUPS as CUPS can be copied by anyone (its open source) 😉

Most of the people will never print using this commands, since printing is now, ages ahead, anyways for simple people (like me), who just need to print a text with no special fonts or graphics text printing is just great.

Text printing is also a good learning experience for Linux novices and is good to be known just as a piece of UNIX history.

How to Screenshot single Windows on GNU / Linux GNOME Desktop

Friday, October 28th, 2011

Every now and then I have to screenshot particular windows positioned on the screen on my GNOME Desktop envronment
Recently I was happy to find there is a very easy way to do this with the default Screenshotting program that is bundled with gnome gnome-screenshot

To screenshot a particular window using gnome-screenshot , its quite easy all one has to do is point the mouse cursor to the window he wants to snapshot and press:

Alt + PrtScr (Print Screen)

Here is a screenshot, I’ve taken of my gnome-terminal using the above command:

Particular window Screenshot Window screenshotting using GNOME gnome-screenshot

One can do it also via the command line using the /usr/bin/gnome-screenshot , by pressing Alt + F2 to invoke the run application and type in:

/usr/bin/gnome-screenshot -w


I was quite happy to find out that this is possible on Linux inside gnome without bothering to run GIMP or use any external programs for the cause. Hope this helps someone 😉