Posts Tagged ‘server hardware’

Get Hardware System info on Debian Linux / How to detecting hardware and servers model on GNU / Linux

Wednesday, December 12th, 2012

hardware-info-getting-on-linux-howto

Users who are novice to Linux should be probably interested on how to get a decent Hardware System Information. Getting system info on Windows is quite straight forward, however on Linux and especially on Linux servers it is a bit confusing at first and even for people who spend years administrating Linux servers, or even have a Linux desktop it is very likely after a period of time to forget how exactly last time got the hardware system information. I'm administrating Linux servers and running a linux desktop for already almost 11 years and often it happened I'm away from configuring a new server for a year, or even when configuring a new server I don't need to get exact system information from command line, as I know it already from the server hardware manual. However whether managing a bunch of dedicated servers or purchasing new systems which are physically away and someone pre-configured the server with some basis Linux install, often a very raw info is provided by the Dedicated Provider on exact server metrics. Other situation, where it is good idea to have a precise system hardware vendor information on a server, is if you just joined a company with a bunch of existing dedicated servers, whose exact hardware configuration is no documented anywhere and suddenly some RAID or piece of hardware located on 1 of the 100 dedicated servers starts misbehaving causing hour down-times and client important data loss.

In any of those cases it always takes me few times of research to find out what exact methodology I used to get the hardware info last time. To make my life for future times easier and not loose the few minutes of research and reading on how to get Linux server system information I decided to write this short article, which might hopefully be useful to others out there who face similar periodic questioning on what was the command to get hardware system info.

Of course the general commands to get some general overview on a Linux server as anyone knows are:

a. dmesg
b. cat /proc/cpuinfo
c. lspci
d. lsusb
c. free -m

A note to make here is that in order to have lsusb and lspci commands present you will have to have installed the deb packs lsusb and pciutils.

However as I prior said, this tools output is not enough or the output is not enough systematic and hard to read and understand especially for lazy or short memory admins like me. Thus it is worthy to mention few others which can be installed as a separate packages and gives more structured and very precised information on what kind of machine hardware you're accessing through ssh.

Here is the list of all of profiled hardware detection progs and scripts:

1. dmidecode

2. lshw

3. x86info

4. hwinfo

5. hardinfo

6. biosdecode


To install all of them in a raw with apt-get do:

debian:~# apt-get install --yes dmidecode lshw x86info hwinfo hardinfo superiotool
Reading package lists... Done
Building dependency tree      
Reading state information... Done
dmidecode is already the newest version.
hardinfo is already the newest version.
lshw is already the newest version.
The following extra packages will be installed:
  libhd16
The following NEW packages will be installed:
  hwinfo libhd16 superiotool x86info
0 upgraded, 4 newly installed, 0 to remove and 9 not upgraded.
Need to get 827 kB of archives.
After this operation, 4,506 kB of additional disk space will be used.
Get:1 http://ftp.uk.debian.org/debian/ squeeze/main libhd16 amd64 16.0-2 [696 kB]
Get:2 http://ftp.uk.debian.org/debian/ squeeze/main hwinfo amd64 16.0-2 [46.6 kB]
Get:3 http://ftp.uk.debian.org/debian/ squeeze/main superiotool amd64 0.0+r5050-1 [43.0 kB]
Get:4 http://ftp.uk.debian.org/debian/ squeeze/main x86info amd64 1.25-1 [40.9 kB]
Fetched 827 kB in 2s (378 kB/s)  
Selecting previously deselected package libhd16.
(Reading database ... 85783 files and directories currently installed.)
Unpacking libhd16 (from .../libhd16_16.0-2_amd64.deb) ...
Selecting previously deselected package hwinfo.
Unpacking hwinfo (from .../hwinfo_16.0-2_amd64.deb) ...
Selecting previously deselected package superiotool.
Unpacking superiotool (from .../superiotool_0.0+r5050-1_amd64.deb) ...
Selecting previously deselected package x86info.
Unpacking x86info (from .../x86info_1.25-1_amd64.deb) ...
Processing triggers for man-db ...
Setting up libhd16 (16.0-2) ...
Setting up hwinfo (16.0-2) ...
Setting up superiotool (0.0+r5050-1) ...
Setting up x86info (1.25-1) ...

Next just try to launch the tools one by one and check the content of the output, in my view  the most useful one and maybe also the most popular is dmidecode, the rest however might be useful to get specific hardware debug info.

1.  hwinfo

debian:~# hwinfo |tee -a server-hardware-info.txt
....

hwinfo will provide you a very long list of very thoroughful information on hardware. A lot of the info it shows however is not so useful for regular admins, but will be of high value to people who need to develop a new Linux driver for respective hardware.

2. lswh

debian:~# lshw > linux-hw-info.txt

lshw provides long list of debug information and if the output is not redirected to a file the screen gets flooded, if not piped to less. For that reason I will not paste output here.

3. x86info

debian:~# x86info

x86info v1.25.  Dave Jones 2001-2009
Feedback to <davej@redhat.com>.

Found 2 CPUs
————————————————————————–
CPU #1

EFamily: 0 EModel: 2 Family: 6 Model: 42 Stepping: 7
CPU Model: Unknown model.
Processor name string: Intel(R) Pentium(R) CPU G630 @ 2.70GHz
Type: 0 (Original OEM)    Brand: 0 (Unsupported)
Number of cores per physical package=8
Number of logical processors per socket=16
Number of logical processors per core=2
APIC ID: 0x0    Package: 0  Core: 0   SMT ID 0
————————————————————————–
CPU #2
EFamily: 0 EModel: 2 Family: 6 Model: 42 Stepping: 7
CPU Model: Unknown model.
Processor name string: Intel(R) Pentium(R) CPU G630 @ 2.70GHz
Type: 0 (Original OEM)    Brand: 0 (Unsupported)
Number of cores per physical package=8
Number of logical processors per socket=16
Number of logical processors per core=2
APIC ID: 0x2    Package: 0  Core: 0   SMT ID 2
————————————————————————–
WARNING: Detected SMP, but unable to access cpuid driver.
Used Uniprocessor CPU routines. Results inaccurate.

As you see x86info, mainly provides information on CPU Cache, exact model, family AND APIC (don't mix it with ACPI – advanced power management interface)
APIC is a chip that remaps IOs and IRQs of your computer to the CPU(s), thus in most cases it is more of not so needed debug information.

4. biosdecode

debian:~#  biosdecode
# biosdecode 2.9
ACPI 2.0 present.
    OEM Identifier: LENOVO
    RSD Table 32-bit Address: 0xBCD9C028
    XSD Table 64-bit Address: 0x00000000BCD9C068
SMBIOS 2.6 present.
    Structure Table Length: 2233 bytes
    Structure Table Address: 0x000EBB70
    Number Of Structures: 59
    Maximum Structure Size: 184 bytes
PNP BIOS 1.0 present.
    Event Notification: Not Supported
    Real Mode 16-bit Code Address: F000:BC66
    Real Mode 16-bit Data Address: F000:0000
    16-bit Protected Mode Code Address: 0x000FBC8E
    16-bit Protected Mode Data Address: 0x000F0000
PCI Interrupt Routing 1.0 present.
    Router ID: 00:1f.0
    Exclusive IRQs: None
    Compatible Router: 8086:27b8
    Slot Entry 1: ID 00:1f, on-board
    Slot Entry 2: ID 00:1b, on-board
    Slot Entry 3: ID 00:16, on-board
    Slot Entry 4: ID 00:1c, on-board
    Slot Entry 5: ID 02:00, slot number 21
    Slot Entry 6: ID 00:01, on-board
    Slot Entry 7: ID 00:06, on-board
    Slot Entry 8: ID 00:1d, on-board
    Slot Entry 9: ID 00:1a, on-board
    Slot Entry 10: ID 03:00, on-board
    Slot Entry 11: ID 00:02, on-board
    Slot Entry 12: ID 00:00, on-board

As you see biosdecode, also provides a lot of hex addresses, also reports on the exact CPU architecture on the system.

The line   XSD Table 64-bit Address: 0x00000000BCD9C068, indicated the host is running a 64 bit CPU, most of the rest info like Slot entries IDs etc. is not so useful.

The most useful info that biosdecode provides is the exact type of BIOS (Basic Input Output System) bundled with the system in my case the BIOS is running on a Lenovo host and is vendored by Lenovo, thus it shows in the cmd output:

OEM Identifier: LENOVO

5. hardinfo

debian:~# hardinfo | tee -a hardware-info.txt


hardinfo gnome screenshot debian gnu / linux

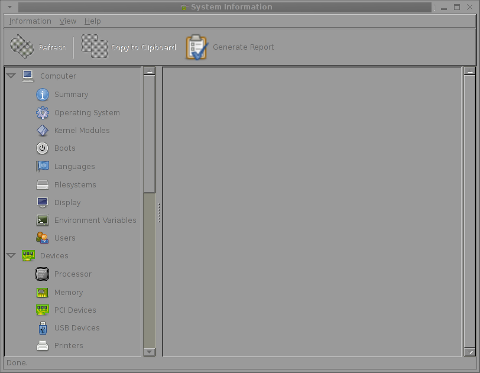
HardInfo is the GNOME GTK+ program which displays robust and thouroughful info in same was as Windows System Info does on  GNOME Desktop. If however you run it under console or via ssh it does display what it detects as: 

Computer hardware, operating system, kernel modules, supported system languages, existing filesystems, Display, set environment variables, Existing system users, Processor type, Memory, PCI and USB devices, Printers (if attached), Battery type (if run on laptop), Storage, Other Input devices

hardinfo, does a few benchmarking tests using CPU stress test algorithms to do Blowfish encryption, CryptoHash, Fibonacci, N-Queens, FPU FFT and FPU raytracing. This benchmark values, if run on a couple of hosts can be used to compare different hardware performances.

6. dmidecode

debian: # dmidecode > system-hware-info.txt

The output from dmidecode is very very detailed and verbose. Though along with the useful info there is plenty of debug information, the debug information it provides is much user friendly / user comprehensible than the rest of tools, thus I guess dmidecode is nowadays preferred by me and probably most of the Linux sys admins.

debian:~# dmidecode |head -n 34
# dmidecode 2.9
SMBIOS 2.6 present.
59 structures occupying 2233 bytes.
Table at 0x000EBB70.

Handle 0x0000, DMI type 0, 24 bytes
BIOS Information
    Vendor: LENOVO
    Version: 9QKT37AUS
    Release Date: 02/14/2012
    Address: 0xF0000
    Runtime Size: 64 kB
    ROM Size: 2560 kB
    Characteristics:
        PCI is supported
        BIOS is upgradeable
        BIOS shadowing is allowed
        Boot from CD is supported
        Selectable boot is supported
        BIOS ROM is socketed
        EDD is supported
        5.25"/1.2 MB floppy services are supported (int 13h)
        3.5"/720 KB floppy services are supported (int 13h)
        3.5"/2.88 MB floppy services are supported (int 13h)
        Print screen service is supported (int 5h)
        8042 keyboard services are supported (int 9h)
        Serial services are supported (int 14h)
        Printer services are supported (int 17h)
        ACPI is supported
        USB legacy is supported
        BIOS boot specification is supported
        Targeted content distribution is supported
    BIOS Revision: 0.37
 

Though it is the most useful tool on some hardware configurations it might not display any data because the BIOS is lacking a DMI implementation.

In almost all cases dmidecode is enough to check what kind of hardware you have ssh-ed to. dmidecode is available also not only on Debian but on Fedora and almost all (if not all Linux distros), through default repositories.

Resume sftp / scp cancelled (interrupted) network transfer – Continue (large) partially downloaded files on Linux / Windows

Thursday, April 23rd, 2015

resume-sftp-scp-cancelled-interrupted-file-transfer-download-upload-network-transfer-continue-large-partially-downloaded-file-howto-linux-windows
I've recentely have a task to transfer some huge Application server long time stored data (about 70GB) of data after being archived between an old Linux host server and a new one to where the new Tomcat Application (Linux) server will be installed to fit the increased sites accessibility (server hardware overload).

The two systems are into a a paranoid DMZ network and does not have access between each other via SSH / FTP / FTPs and even no Web Access on port (80 or SSL – 443) between the two hosts, so in order to move the data I had to use a third HOP station Windows (server) which have a huge SAN network attached storage of 150 TB (as a Mapped drive I:/).

On the Windows HOP station which is giving me access via Citrix Receiver to the DMZ-ed network I'm using mobaxterm so I have the basic UNIX commands such as sftp / scp already existing on the Windows system via it.
Thus to transfer the Chronos Tomcat application stored files .tar.gz archived I've sftp-ed into the Linux host and used get command to retrieve it, e.g.:


sftp UserName@Linux-server.net
Password:
Connected to Linux-server.
sftp> get Chronos_Application_23_04_2015.tar.gz

….


The Secured DMZ Network seemed to have a network shaper limiting my get / Secured SCP download to be at 2.5MBytes / sec, thus the overall file transfer seemed to require a lot of time about 08:30 hours to complete. As it was the middle of day about 13:00 and my work day ends at 18:00 (this meant I would be able to keep the file retrieval session for a maximum of 5 hrs) and thus file transfer would cancel when I logout of the HOP station (after 18:00). However I've already left the file transfer to continue for 2hrs and thus about 23% of file were retrieved, thus I wondered whether SCP / SFTP Protocol file downloads could be resumed. I've checked thoroughfully all the options within sftp (interactive SCP client) and the scp command manual itself however none of it doesn't have a way to do a resume option. Then I thought for a while what I can use to continue the interrupted download and I remembered good old rsync (versatile remote and local file copying tool) which I often use to create customer backup stragies has the ability to resume partially downloaded files I wondered whether this partially downloaded file resume could be done only if file transfer was only initiated through rsync itself and luckily rsync is able to continue interrupted file transfers no matter what kind of HTTP / HTTPS / SCP / FTP program was used to start file retrievalrsync is able to continue cancelled / failed transfer due to network problems or user interaction activity), that turned even pretty easy to continue failed file transfer download from where it was interrupted I had to change to directory where file is located:
 

cd /path/to/interrupted_file/


and issue command:
 

rsync -av –partial username@Linux-server.net:/path/to/file .


the –partial option is the one that does the file resume trick, -a option stands for –archive and turns on the archive mode; equals -rlptgoD (no -H,-A,-X) arguments and -v option shows a file transfer percantage status line and an avarage estimated time for transfer to complete, an easier to remember rsync resume is like so:
 

rsync -avP username@Linux-server.net:/path/to/file .
Password:
receiving incremental file list
chronos_application_23_04_2015.tar.gz
  4364009472   8%    2.41MB/s    5:37:34

To continue a failed file upload with rsync (e.g. if you used sftp put command and the upload transfer failed or have been cancalled:
 

rsync -avP chronos_application_23_04_2015.tar.gz username@Linux-server.net:/path/where_to/upload


Of course for the rsync resume to work remote Linux system had installed rsync (package), if rsync was not available on remote system this would have not work, so before using this method make sure remote Linux / Windows server has rsync installed. There is an rsync port also for Windows so to resume large Giga or Terabyte file archive downloads easily between two Windows hosts use cwRsync.

WordPress Plugins to monitor and debug WP enabled plugins – Find Errors / Warnings and Remove WP problematic plugins slowing down your Website (blog) database

Thursday, February 19th, 2015

plugins-to-monitor-debug-wordpress-enabled-plugins-how-to-track-find-errors-and-warnings-and-remove-problematic-wp-extensions-that-slow-down-your-website

Recent days, I'm spending a lot of time again trying to optimize my wordpress blog. Optimizing WP for better efficiency is becoming harder and harder task day by day as the website file content data is growing along with SQL databases. Moreover situation gets even worse because the number of plugins enabled on my blog is incrementally growing with time because, there is more and more goodies I'd like to add.
Optimizing WordPress to run for Speed on a server is a whole a lot of art and its a small universe in itself, because as of time of writting this post the count (number) of WordPress available PLUGINS is 36,197 ! 

1. Manually Tracking WordPress  Plugins causing Slow SQL Queries (MySQL bottleneck) issues directly using console / SSH

Because of its open source development and its nice modular design wordpress has turned into a standard for building small, middle sized and large websites (some WordPress based blogs and sites have from 50 000 to 100 000 unique pages!). My blog is still a small WordPress site with only 1676 posts, so I still haven't reached the high volume traffic optimization requirements but still even though I have a relatively good server hardware  8GB RAM / (2×2.70 Ghz Intel CPU) / 500 GB (7400 RPM HDD) at times I see Apache Webservers is unable to properly serve coming requests because of MySQL database (LEFT JOIN) requests being slow to serve (taking up to few seconds to complete) and creating a MySQL table lock, putting all the rest SQL queries to stay in a long unserved queues line, I've realized about this performance issue by using a a mysql cli (command) client and few commands and console command (tool) called mytop (also known as mtop). MyTop refreshes every 3 seconds, so the slow query will immediately stay on screen to view moer info about it press "f" and type the  in query ID.

mysql-top-running-on-gnu-linux-server-tracking-sql-queries-in-console-screenshot.png

mysql-top-running-on-gnu-linux-server-tracking-sql-queries-in-console-screenshot2

Finally it is very useful to run  for a while MySQL server logging to /var/log/mysql/slow-query.log:
Slow query is enabled (on my Debian 7 Wheezy host) by adding to /etc/mysql/my.cnf
after conf section


vim /etc/mysql/my.cnf
#
# * Logging and Replication
#
# Both location gets rotated by the cronjob.
# Be aware that this log type is a performance killer.
# As of 5.1 you can enable the log at runtime!
#general_log_file        = /var/log/mysql/mysql.log
#general_log             = 1
#
# Error logging goes to syslog due to /etc/mysql/conf.d/mysqld_safe_syslog.cnf.
#
# Here you can see queries with especially long duration


Paste:


slow_query_log = 1
slow_query_log_file = /var/log/mysql/slow-query.log
long_query_time = 2
log-queries-not-using-indexes


And then to make new mysql configuration load restarted mysql server:


debian-server:~# /etc/init.d/mysql restart
Stopping MySQL database server: mysqld.
Starting MySQL database server: mysqld ..
Checking for tables which need an upgrade, are corrupt or were
not closed cleanly..


Leaving mysql-slow.log to be enabled for 30 minutes to an 1 hrs is a good time to track most problematic slow queries and based on this queries, I took parts of  SQL UPDATE / SELECT / INSERT etc. Db queries which was problematic and grepped throughout /var/www/blog/wp-content/plugin files in order to determine which WordPress Plugin is triggering the slow query, causing blog to hang when too many clients try to see it in browser.

My main problematic SQL query having long execution time  (about 2 to 3 seconds!!!) most commonly occuring in slow-query.log was:


SELECT DISTINCT post_title, ID, post_type, post_name FROM wp_posts wposts LEFT JOIN wp_postmeta wpostmeta ON wposts.ID = wpostmeta.post_id LEFT JOIN wp_term_relationships ON (wposts.ID = wp_term_relationships.object_id) LEFT JOIN wp_term_taxonomy ON (wp_term_relationships.term_taxonomy_id = wp_term_taxonomy.term_taxonomy_id) WHERE (post_type='page' OR (wp_term_taxonomy.taxonomy = 'category' AND wp_term_taxonomy.term_id IN(11))) AND post_status = 'publish' AND LENGTH(post_title)>=5 ORDER BY LENGTH(post_title) ASC LIMIT 500

Because above query uses SQL Column names and Tables which are not hard coded in PHP code, to find out which plugins is most probably to launch this complex LEFT JOIN query, I used a quick bash one-liner:


# cd /var/www/blog/wp-content/plugins


# for i in $(grep -rli 'SELECT DISTINCT' *); do grep -rli 'LEFT JOIN' $i; done 
./seo-automatic-links/seo-links.php
./wp-postviews/wp-postviews.php
./yet-another-related-posts-plugin/classes/YARPP_Cache_Tables.php


I wanted to put less load on CPU during grep so looked for string only in .PHP extensioned files with:


 # for i in $(find . -iname '*.php' -exec grep -rli 'SELECT DISTINCT' '{}' \;); do grep -rli 'LEFT JOIN' $i; done
./seo-automatic-links/seo-links.php
./wp-postviews/wp-postviews.php
./yet-another-related-posts-plugin/classes/YARPP_Cache_Tables.php


As you can see the complex query is being called from PHP file belonging to one of 3 plugins

  • SEO Automatic Links – this is SEO Smart Links WP plugin (Does internal bliog interlinking in order to boast SEA)
  • WP PostViews – WordPress Post Views plugin (Which allows me to show how many times an article was read in WP Widget menu)
  • Yet Another Related Posts – Which is WP plugin I installed / enabled to show Related posts down on each blog post


2. Basic way to optimize MySQL slow queries (EXPLAIN / SHOW CREATE TABLE)

Now as I have a basic clue on plugins locking my Database, I disabled them one by one while keeping enabled mysql slow query log and viewing queries in mytop and I figure out that actually all of the plugins were causing a short time overheat (lock) on server Database because of LEFT JOINs. Though I really like what this plugins are doing, as they boast SEO and attract prefer to disable them for now and have my blog all the time responsible light fast instead of having a little bit better Search Engine Optimization (Ranking) and loosing many of my visitors because they're annoyed to wait until my articles open

Before disabling I tried to optimize the queries using MySQL EXPLAIN command + SHOW CREATE TABLE (2 commands often used to debug slow SQL queries and find out whether a Column needs to have added INDEX-ing to boast MySQL query).

Just in case if you decide to give them a try here is example on how they're used to debug problematic SQL query:
 

  1. mysql> explain SELECT DISTINCT post_title, ID, post_type, post_name
  2.     -> FROM wp_posts wposts LEFT JOIN wp_postmeta wpostmeta
  3.     -> ON wposts.ID = wpostmeta.post_id LEFT JOIN wp_term_relationships
  4.     -> ON (wposts.ID = wp_term_relationships.object_id) LEFT JOIN wp_term_taxonomy
  5.     -> ON (wp_term_relationships.term_taxonomy_id = wp_term_taxonomy.term_taxonomy_id)
  6.     -> WHERE (post_type='page'
  7.     -> OR (wp_term_taxonomy.taxonomy = 'category'
  8.     -> AND wp_term_taxonomy.term_id IN(11,15,17)))
  9.     -> AND post_status = 'publish'
  10.     -> AND LENGTH(post_title)>=5
  11.     -> ORDER BY LENGTH(post_title) ASC
  12.     -> LIMIT 500;
  13. +—-+————-+———————–+——–+——————+———+———+———————————————+——+———————————————-+
  14. | id | select_type | table                 | type   | possible_keys    | key     | key_len | ref                                         | rows | Extra                                        |
  15. +—-+————-+———————–+——–+——————+———+———+———————————————+——+———————————————-+
  16. |  1 | SIMPLE      | wposts                | ALL    | type_status_date | NULL    | NULL    | NULL                                        | 1715 | Using where; Using temporary; Using filesort |
  17. |  1 | SIMPLE      | wpostmeta             | ref    | post_id          | post_id | 8       | blog.wposts.ID                              |   11 | Using index; Distinct                        |
  18. |  1 | SIMPLE      | wp_term_relationships | ref    | PRIMARY          | PRIMARY | 8       | blog.wposts.ID                              |   19 | Using index; Distinct                        |
  19. |  1 | SIMPLE      | wp_term_taxonomy      | eq_ref | PRIMARY          | PRIMARY | 8       | blog.wp_term_relationships.term_taxonomy_id |    1 | Using where; Distinct                        |
  20. +—-+————-+———————–+——–+——————+———+———+———————————————+——+———————————————-+
  21. 4 rows in set (0.02 sec)
  22.  
  23. mysql>
  24.  


  1. mysql> show create table wp_posts;
  2. +———-+————————–+
  3. | Table    | Create Table                                                                                                                                                                                                                                                                                                                                                                                                                                 |
  4. +———-+————————–+
  5. | wp_posts | CREATE TABLE `wp_posts` (
  6.   `ID` bigint(20) unsigned NOT NULL AUTO_INCREMENT,
  7.   `post_author` bigint(20) unsigned NOT NULL DEFAULT '0',
  8.   `post_date` datetime NOT NULL DEFAULT '0000-00-00 00:00:00',
  9.   `post_date_gmt` datetime NOT NULL DEFAULT '0000-00-00 00:00:00',
  10.   `post_content` longtext NOT NULL,
  11.   `post_title` text NOT NULL,
  12.   `post_excerpt` text NOT NULL,
  13.   `post_status` varchar(20) NOT NULL DEFAULT 'publish',
  14.   `comment_status` varchar(20) NOT NULL DEFAULT 'open',
  15.   `ping_status` varchar(20) NOT NULL DEFAULT 'open',
  16.   `post_password` varchar(20) NOT NULL DEFAULT '',
  17.   `post_name` varchar(200) NOT NULL DEFAULT '',
  18.   `to_ping` text NOT NULL,
  19.   `pinged` text NOT NULL,
  20.   `post_modified` datetime NOT NULL DEFAULT '0000-00-00 00:00:00',
  21.   `post_modified_gmt` datetime NOT NULL DEFAULT '0000-00-00 00:00:00',
  22.   `post_content_filtered` longtext NOT NULL,
  23.   `post_parent` bigint(20) unsigned NOT NULL DEFAULT '0',
  24.   `guid` varchar(255) NOT NULL DEFAULT '',
  25.   `menu_order` int(11) NOT NULL DEFAULT '0',
  26.   `post_type` varchar(20) NOT NULL DEFAULT 'post',
  27.   `post_mime_type` varchar(100) NOT NULL DEFAULT '',
  28.   `comment_count` bigint(20) NOT NULL DEFAULT '0',
  29.   PRIMARY KEY (`ID`),
  30.   KEY `post_name` (`post_name`),
  31.   KEY `type_status_date` (`post_type`,`post_status`,`post_date`,`ID`),
  32.   KEY `post_parent` (`post_parent`),
  33.   KEY `post_author` (`post_author`),
  34.   FULLTEXT KEY `post_related` (`post_title`,`post_content`)
  35. ) ENGINE=MyISAM AUTO_INCREMENT=12033 DEFAULT CHARSET=utf8 |
  36. +———-+———————-+
  37. 1 row in set (0.00 sec)
  38.  
  39. mysql>
  40.  


By the way above output is a paste from the the new PasteBin Open Source (Stikked powered) service I started on www.pc-freak.net – paste.www.pc-freak.net (p.www.pc-freak.net) 🙂

Before I took final decision to disable slow WP plugins, I've experimented a bit trying to add INDEX to Table Column (wposts) in hope that this would speed up SQL queries with:


mysql> ALTER TABLE TABLE_NAME ADD INDEX (wposts);


But this didn't improve query speed even on the contrary it make execution time worse.

3. Tracking WordPress Plugin PHP Code Execution time and Plugins causing Slow SQL Queries (MySQL bottleneck) issues through WP itself

Well fine, I'm running my own hosted Blog and WordPress sites, but for people who have wordpress sites on shared hosting, there is usually no SSH (Terminal) Access to server, those people will be happy to hear there are 2 Free easy installable WordPress plugins which can be used to Debug Slow WordPress Plugins SQL Queries as well as plugin to Track which plugin takes most time to execute, this are:


a) P3 Plugin Performance Profiler  

runs a scan over your site to determine what resources your plugins are using, and when, during a standard page request. P3 PPP Can even create reports in a beatiful Excel like Pie chart sheet.

p3-plugin-performance-profiler-godaddy-screenshot-debian-gnu-linux-wordpress-website

Another useful thing to see with P3 PPP is Detailed Timeline it shows when the plugins are being loaded during new page request so you can see if there is a certain sequence in time when a plugin slows down the website.

detailed_timeline-wordpress-p3-performance-plugin-on-website-screenshot

The pictures says it all as P3 PPP is Godaddy's work, congrats to GoDaddy, they've done great job.


b) WordPress memory Viewer WP plugins

Is useful to check how much memory each of WordPress plugin is taking on user (visitor) request.
Memory Viewer is allows you to view WordPress’ memory utilization at several hooks during WordPress’ execution. It also shows a summary of MySQL Queries that have ran as well as CPU time.
To use it download it to plugins/ folder as usual enable it from:

Installed Plugins -> (Inactive) -> Memory Viewer (Enable)

To see statistics from Memory Viewer open any post from your blog website and scroll down to the bottom you will notice the statistics, showing up there, like on below screenshot.

wordpress-memory-viewer-plugin-debian-gnu-linux-hosted-website-show-which-plugin-component-eats-most-memory-in-wordprses-blog
 

Though WP Memory Viewer is said to work only up to WP version 3.2.1, I've tested it and it works fine on my latest stable WordPress 4.1 based blog.

c) WordPress Query Monitor

wordpress-query-monitor-plugin-to-monitor-track-and-optimize-problems-with-sql-caused-by-wp-plugins.png
 

Query Monitor is a debugging plugin for anyone developing with WordPress but also very helpful for anyone who want to track issues with plugins who use the database unefficient.
It has some advanced features not available in other debugging plugins, including automatic AJAX debugging and the ability to narrow down things by plugin or theme.
You can view plenty of precious statistics on how enabled plugins query the database server, here is a short overview on its Database Queries capabilities:

  • Shows all database queries performed on the current page
  • Shows affected rows and time for all queries
  • Show notifications for slow queries and queries with errors
  • Filter queries by query type (SELECT, UPDATE, DELETE, etc)
  • Filter queries by component (WordPress core, Plugin X, Plugin Y, theme)
  • Filter queries by calling function
  • View aggregate query information grouped by component, calling function, and type
  • Super advanced: Supports multiple instances of wpdb on one page
  • Once enabled from Plugins you will see it appear as a new menu on bottom Admin raw.

An important note to make here is latest Query Monitor extension fails when loaded on current latest Wordpress 4.1, to use it you will have to download and useolder Query Monitor plugin version 2.6.8 you can download it from here

d) Debug Bar

If you want you want a Memory Viewer like plugin for more complex used components memory debugging, reporting if (WP_DEBUG is set in wp-config.php) also check out Debug Bar .
For me Debug Bar was very useful because it show me depreciated functions some plugins used, so I substituted the obsoleted function with new one.


debug-bar-debug-wordpress-plugins-memory-use-screenshot-website


4. Server Hardware hungry (slow) WordPress plugins that you better not use

While spending time to Google for some fixes to WP slow query plugins – I've stumbled upon this post giving a good list with WordPress Plugins better off not to use because they will slow down your site
This is a publicly well known list of WP plugins every WordPress based site adminstrator should avoid, but until today I didn't know so my assumption is you don't know either ..

Below plugins are extremely database intensive mentioned in article that we should better (in all cases!) avoid:

  • Dynamic Related Posts
  • SEO Auto Links & Related Posts
  • Yet Another Related Posts Plugin
  • Similar Posts
  • Contextual Related Posts
  • Broken Link Checker — Overwhelms even our robust caching layer with an inordinate amount of HTTP requests.
  • MyReviewPlugin — Slams the database with a fairly significant amount of writes.
  • LinkMan — Much like the MyReviewPlugin above, LinkMan utilizes an unscalable amount of database writes.
  • Fuzzy SEO Booster — Causes MySQL issues as a site becomes more popular.
  • WP PostViews — Inefficiently writes to the database on every page load. To track traffic in a more scalable manner, both the stats module in Automattic’s Jetpack plugin and Google Analytics work wonderfully.
  • Tweet Blender — Does not play nicely with our caching layer and can cause increased server load.


A good Complete list of known WordPress slow plugins that will hammer down your wordpress performance is here

There are few alternatives to this plugins and when I have some free time I will download and test their alternatives but for now I plan the plugins to stay disabled.
 

For the absolute WP Performance Optimization Freaks, its good to check out the native way to Debug a wordpress installation through using few embedded
variables


define('WP_DEBUG', true);
define('WP_DEBUG', false);
define('WP_DEBUG_LOG', true);
define('WP_DEBUG_DISPLAY', false);
define('SAVEQUERIES', true);


An article describing how you can use native WP debug variables is here


Happy Optimizing  ! 🙂

how to archive with Windows default zip (compress) algorithm

Tuesday, April 1st, 2014

windows-sent-to-compressed-file
I'm working on a decomissioning project (for those who hear decomissioning for a first time – in corporate world this means removal of service/s or assigned resources of a server or a physical server hardware that is not to be used in future or is obsolete). The decomissioning includes removal of Apache Tomcat (Software Configuration Item CI – in HP terms) from Microsoft Windows 2007 – Service Pack 2.
Part of decomissioning is of course to create backup of Tomcat Application server and for that I needed to create compressed archive of Tomcat instances. Usually I do archives on Windows using Winrar or Winzip but this time as the server productive server has the minimum installed there was no any external vendor produced archiving software available.

My memories from past were that there is a native compressing program embedded into Windows as I've unzipped compressed archives on Win hosts with no need for external WinZip. However until so far I never did .ZIP archive with no available external uncompress software.

Using Winzip or Winrar so far to make archive from a number of files I used to select files to enter Archive press right mouse button and select Create Archive (Add To Archive) so I expected this will work whenever no Winrar, however there was no obvious button like this, so I googled a bit to find out how is that possible ending up on Article from Microsoft titled "Compress and uncompress files (zip files)", there is a dumb proof video teaching Compressing files with Microsoft default ZIP program is done by the the weird "Send To" menu 🙂 

Selecting files to enter Archive;
> (Click Right Mouse Button) -> (Send To Compressed Zipped Folder)

compress_zipped_folder_with_windows_default_archive_algorithm how to archive with windows default compress archive

Honestly If I didn't checked the net probably I will never think of looking it there.

Rsync slow data (bandwidth limit) transferring on productive Linux / *BSD servers to 2nd

Thursday, March 7th, 2013

If amount of Unique users on website has increased dramatically and Apache + PHP server starts to get user load higher than 50% in times of most users site activity then it is time to move to think of migrating data on more powerful Server hardware.

Moving few thousands of Gigabytes of PHP, JS, PNG, JPG images and plain text files data from a productive host to another puts an extra burden on hard disk Input / Output (I/O) operations, thus risking to put extraordinary server load and make websites on server inaccessible. The normal way I copy data on less busy servers is create  .tar.gz archive of data from one server and transfer with sftp or scp. In this situation, doing so however puts too much load on server and thus is risking to stone the server and make it inaccessible to users. A solution to problem is to use rsync instead, synchronizing data between the servers by instructing it to transfer data from one hard disk to another via network using a maximum read/write bandwidth.

rsync command argument specifying a maximum bandwidth is --bwlimit=KBPS

To transfer data between two servers specifyinga maximum transfer bandwidth of 10MB per second you have to pass 2MBytes as it is in megabytes (2*1024Kb) = 2048.

Hence to make the transfer while logged to current productive server via SSH to host server with IP XXX.XXX.XXX.XXX I used:
w:~# cd /home/sites
w:/home/sites# /usr/bin/rsync --bwlimit=2048 -avz -e ssh . root@XXX.XXX.XXX.XXX:/home/sites/

The arguments to above rsync command are clear enough (-e ssh) – tells to use ssh as data transfer protocol, (root@) – specifies to connect to second server with root user and (:/home/sites/) – tells rsync to transfer to remote server to same directory (/home/sites/) like from which copying.

Bear in mind that, in order this method to work, rsync has to be installed both on the server from which data is transferred and to second one to where data is transferred.
Since rsync is available in Linux as well as has port in FreeBSD / NetBSD / OpenBSD ports tree, same way to transfer "web data" while upgrading BSD OS host to another is possible.

How to tune MySQL Server to increase MySQL performance using mysqltuner.pl and Tuning-primer.sh

Tuesday, August 9th, 2011

MySQL Easy performance tuning with mysqltuner.pl and Tuning-primer.sh scripts

Improving MySQL performance is crucial for improving a website responce times, reduce server load and improve overall work efficiency of a mysql database server.

I’ve seen however many Linux System administrators who does belittle or completely miss the significance of tuning a newly installed MySQL server installation.
The reason behind that is probably caused by fact that many people think MySQL config variables, would not significantly improve performance and does not pay back for optimization efforts. Moreover there are a bunch of system admins who has to take care for numerous services so they don’t have time to get good knowledge to optimize MySQL servers.
Thus many admins and webmasters nowdays, think optimizations depend mostly on the side of the website programmers.
It’s also sometimes falsely believed that optimizing a MySQL server could reduce the overall server stability.

With the boom of Internet website building and internet marketing, many webmasters emerged and almost anybody with almost no knowledge on GNU/Linux or minimal or no knowledge on PHP can start his Online store, open a blog or create a website powered by some CMS like joomla.
Thus nowdays many servers even doesn’t have a hired system administrators but are managed by people whose knowledge on *Nix is almost next to zero, this is another reason why dozens of MySQL installations online are a default ones and are not taking a good advantage of the server hardware.

The incrase of website visitors leads people servers expectations for hardware also to grow, thus many companies simply buy a new hardware instead of taking the few time to investigate on how current server hardware can be utilized better.
In that manner of thought I though it will be a good idea to write this small article on Tuning mysql servers with two scripts Tuning-primer.sh and mysqltuner.pl.
The scripts are ultra easy to use and does not require only a minimal knowledge on MySQL, Linux or (*BSD *nix if sql is running on BSD).
Tuning-primer.sh and mysqltuner.pl are therefore suitable for a quick MySQL server optimizations to even people who are no computer experts.

I use this two scripts for MySQL server optimizations on almost every new configured GNU/Linux with a MySQL backend.
Use of the script comes to simply download with wget, lynx, curl or some other web client and execute it on the server host which is already running the MySQL server.

Here is an example of how simple it is to run the scripts to Optimize MySQL:

debian:~# perl mysqltuner.pl
>> MySQLTuner 1.2.0 - Major Hayden >major@mhtx.net<
>> Bug reports, feature requests, and downloads at http://mysqltuner.com/
>> Run with '--help' for additional options and output filtering

——– General Statistics ————————————————–
[–] Skipped version check for MySQLTuner script
[OK] Currently running supported MySQL version 5.1.49-3
[OK] Operating on 64-bit architecture

——– Storage Engine Statistics ——————————————-
[–] Status: +Archive -BDB -Federated +InnoDB -ISAM -NDBCluster
[–] Data in MyISAM tables: 6G (Tables: 952)
[!!] InnoDB is enabled but isn’t being used
[!!] Total fragmented tables: 12

——– Security Recommendations ——————————————-
[OK] All database users have passwords assigned

——– Performance Metrics ————————————————-
[–] Up for: 1d 2h 3m 35s (68M q [732.193 qps], 610K conn, TX: 49B, RX: 11B)
[–] Reads / Writes: 76% / 24%
[–] Total buffers: 512.0M global + 2.8M per thread (2000 max threads)
[OK] Maximum possible memory usage: 6.0G (25% of installed RAM)
[OK] Slow queries: 0% (3K/68M)
[OK] Highest usage of available connections: 7% (159/2000)
[OK] Key buffer size / total MyISAM indexes: 230.0M/1.7G
[OK] Key buffer hit rate: 97.8% (11B cached / 257M reads)
[OK] Query cache efficiency: 76.6% (46M cached / 61M selects)
[!!] Query cache prunes per day: 1822075
[OK] Sorts requiring temporary tables: 0% (1K temp sorts / 2M sorts)
[!!] Joins performed without indexes: 63635
[OK] Temporary tables created on disk: 1% (26K on disk / 2M total)
[OK] Thread cache hit rate: 99% (159 created / 610K connections)
[!!] Table cache hit rate: 4% (1K open / 43K opened)
[OK] Open file limit used: 17% (2K/16K)
[OK] Table locks acquired immediately: 99% (36M immediate / 36M locks)

——– Recommendations —————————————————–
General recommendations:
Add skip-innodb to MySQL configuration to disable InnoDB
Run OPTIMIZE TABLE to defragment tables for better performance
Enable the slow query log to troubleshoot bad queries
Increasing the query_cache size over 128M may reduce performance
Adjust your join queries to always utilize indexes
Increase table_cache gradually to avoid file descriptor limits
Variables to adjust:
query_cache_size (> 256M) [see warning above] join_buffer_size (> 256.0K, or always use indexes with joins) table_cache (> 7200)

You see there are plenty of things, the script reports, for the unexperienced most of the information can be happily skipped without need to know the cryptic output, the section of importance here is Recommendations for some clarity, I’ve made this section to show up bold.

The most imporant things from the Recommendations script output is actually the lines who give suggestions for incrase of certain variables for MySQL.In this example case this are the last three variables:
query_cache_size,
join_buffer_size and
table_cache

All of these variables are tuned from /etc/mysql/my.cnf (on Debian) and derivatives distros and from /etc/my.cnf on RHEL, CentOS, Fedora and the other RPM based Linux distributions.

On some custom server installs my.cnf is also located in /usr/local/mysql/etc/ or some other a bit more unstandard location 😉

Anyways now having the Recommendation from the script, it’s necessery to edit my.cnf and try to double the values for the suggested variables.

First, I check if all the suggested variables are existent in my config with grep , if they’re not then I’ll simply add the variable with doubled size of the suggested values.
P.S: One note here is sometimes some values which are configured, are the default value for the MySQL server and does not have a record in my.cnf

debian:~# grep -E 'query_cache_size|join_buffer_size|table_cache' /etc/mysql/my.cnf table_cache = 7200
query_cache_size = 256M
join_buffer_size = 262144

All of my variables are in the config so, now edit my.cnf and set values to:
table_cache = 14400
query_cache_size = 512M
join_buffer_size = 524288

I always, however preserve the old variable’s value, because sometimes raising the value might create problem and the MySql server might be unable to restart properly.
Thus before going with adding the new values make sure the old ones are commented with # , e.g.:
#table_cache = 7200
#query_cache_size = 256M
#join_buffer_size = 262144

I would recommend vim as editor of choice while editing my.cnf as vim completely rox 😉 If you’re not acquainted to vim use nano or mcedit or your editor of choice 😉 :

debian:~# vim /etc/mysql/my.cnf
...

Assuming that the changes are made, it’s time to restart MySQL to make sure the new values are read by the SQL server.

debian:~# /etc/init.d/mysql restart
* Stopping MySQL database server mysqld [ OK ]
* Starting MySQL database server mysqld [ OK ]
Checking for tables which need an upgrade, are corrupt or were not closed cleanly.

If mysql server fails, however to restart, make sure immediately you reverse back the changed variables to the commented values and restart once again via mysql init script to make server load.

Afterwards start adding the values one by one until find out which one is causing the mysqld to fail.

Now the second script (Tuning-primer.sh) is also really nice for MySQL performance optimizations are necessery. However it’s less portable (as it’s written in bash scripting language).
Consider running this script among different GNU/Linux distributious (especially the newer ones) might produce errors.
Tuning-primer.sh requires some minor code changes to be able to run on FreeBSD, NetBSD and OpenBSD *nices.

The way Tuning-primer.sh works is precisely like mysqltuner.pl , one runs it it gives some info about current running MySQL server and based on certain factors gives suggestions on how increasing or decresing certain my.cnf variables could reduce sql query bottlenecks, solve table locking issues as well as generally improve INSERT, UPDATE query times.

Here is an example output from tuning-primer.sh run on another server:

server:~# wget https://www.pc-freak.net/files/Tuning-primer.sh
...
server:~# sh Tuning-primer.sh
-- MYSQL PERFORMANCE TUNING PRIMER --
- By: Matthew Montgomery -

MySQL Version 5.0.51a-24+lenny5 x86_64

Uptime = 8 days 10 hrs 19 min 8 sec
Avg. qps = 179
Total Questions = 130851322
Threads Connected = 1

Server has been running for over 48hrs.
It should be safe to follow these recommendations

To find out more information on how each of these
runtime variables effects performance visit:
http://dev.mysql.com/doc/refman/5.0/en/server-system-variables.html

SLOW QUERIES
Current long_query_time = 1 sec.
You have 16498 out of 130851322 that take longer than 1 sec. to complete
The slow query log is NOT enabled.
Your long_query_time seems to be fine

MAX CONNECTIONS
Current max_connections = 2000
Current threads_connected = 1
Historic max_used_connections = 85
The number of used connections is 4% of the configured maximum.
Your max_connections variable seems to be fine.

WORKER THREADS
Current thread_cache_size = 128
Current threads_cached = 84
Current threads_per_sec = 0
Historic threads_per_sec = 0
Your thread_cache_size is fine

MEMORY USAGE
Tuning-primer.sh: line 994: let: expression expected
Max Memory Ever Allocated : 741 M
Configured Max Memory Limit : 5049 M
Total System Memory : 23640 M

KEY BUFFER
Current MyISAM index space = 1646 M
Current key_buffer_size = 476 M
Key cache miss rate is 1 / 56
Key buffer fill ratio = 90.00 %
You could increase key_buffer_size
It is safe to raise this up to 1/4 of total system memory;
assuming this is a dedicated database server.

QUERY CACHE
Query cache is enabled
Current query_cache_size = 64 M
Current query_cache_used = 38 M
Current Query cache fill ratio = 59.90 %

SORT OPERATIONS
Current sort_buffer_size = 2 M
Current record/read_rnd_buffer_size = 256.00 K
Sort buffer seems to be fine

JOINS
Current join_buffer_size = 128.00 K
You have had 111560 queries where a join could not use an index properly
You have had 91 joins without keys that check for key usage after each row
You should enable “log-queries-not-using-indexes”
Then look for non indexed joins in the slow query log.
If you are unable to optimize your queries you may want to increase your
join_buffer_size to accommodate larger joins in one pass.

TABLE CACHE
Current table_cache value = 3600 tables
You have a total of 798 tables
You have 1904 open tables.
The table_cache value seems to be fine

TEMP TABLES
Current tmp_table_size = 128 M
1% of tmp tables created were disk based
Created disk tmp tables ratio seems fine

TABLE SCANS
Current read_buffer_size = 128.00 K
Current table scan ratio = 797 : 1
read_buffer_size seems to be fine

TABLE LOCKING
Current Lock Wait ratio = 1 : 1782
You may benefit from selective use of InnoDB.

As seen from script output, there are certain variables which might be increased a bit for better SQL performance, one such variable as suggested is key_buffer_size(You could increase key_buffer_size)

Now the steps to make the tunings to my.cnf are precisely the same as with mysqltuner.pl, e.g.:
1. Preserve old config variables which will be changed by commenting them
2. Double value of current variables in my.cnf suggested by script
3. Restart Mysql server via /etc/init.d/mysql restart cmd.
4. If mysql runs fine monitor mysql performance with mtop or mytop for at least 15 mins / half an hour.

if all is fine run once again the tuning scripts to see if there are no further improvement suggestions, if there are more follow the 4 steps described procedure once again.

It’s also a good idea that these scripts are periodically re-run on the server like once per few months as changes in SQL queries amounts and types will require changes in MySQL operational variables.
The authors of these nice scripts has done great job and have saved us a tons of nerves time, downtimes and money spend on meaningless hardware. So big thanks for the awesome scripts guys 😉
Finally after hopefully succesful deployment of changes, enjoy the incresed SQL server performance 😉

Possible way to Improve wordpress performance with wp-config.php 4 config variables

Tuesday, March 6th, 2012

Wordpress improve performance wp-config.php logo chromium effect GIMP

Nowdays WordPress is ran by million of blogs and websites all around the net. I myself run wordpress for this blog in general wordpress behaves quite well in terms of performance. However as with time the visitors tend to increase, on frequently updated websites or blogs. As a consequence, the blog / website performance slowly starts to decrease as result of the MySQL server read / write operations creating I/O and CPU load overheads. Buying a new hardware and migrating the wordpress database is a possible solution, however for many small or middle size wordpress blogs en sites like mine this is not easy task. Getting a dedicated server or simply upgrading your home server hardware is expensive and time consuming process… In my efforts to maximize my hardware utilization and increase my blog decaying performance I've stumbled on the article Optimize WordPress performance with wp-config.php

According to the article there are 4 simple wp-config.php config directvies useful in decreasing a lot of queries to the MySQL server issued with each blog visitor.

define('WP_HOME','http://www.yourblog-or-siteurl.com');
define('WP_SITEURL','http://www.yourblog-or-siteurl.com');
define('TEMPLATEPATH', '/var/www/blog/wp-content/themes/default');
define('STYLESHEETPATH', '/var/www/blog/wp-content/themes/default');

1. WP_HOME and WP_SITEURL wp-config.php directvies

The WP_HOME and WP_SITEURL variables are used to hard-code the address of the wordpress blog or site url, so wordpress doesn't have to check everytime in the database on every user request to know it is own URL address.

2. TEMPLATEPATH and TEMPLATEPATH wp variables

This variables will surely improve performance to Wodpress blogs which doesn't implement caching. On wp install with enabled caching plugins like WordPress Super Cache, Hyper Cache or WordPress Db Cache is used, I don't know if this variables will have performance impact …

So far I have tested the vars on a couple of wordpress based installs with caching enabled and even on them it seems the pages load faster than before, but I cannot say this for sure as I did not check the site loading time in advance before hardcoding the vars.

Anyways even if the suggested variables couldn't make positive impact on performance, having the four variables in wp-config.php is a good practice for blogs or websites which are looking for extra clarity.
For multiple wordpress installations living on the same server, having defined the 4 vars in different wordpress seems like a good idea too.

How to enable AUTO fsck (ext3, ext4, reiserfs, LVM filesystems) checking on Linux boot through /etc/fstab

Tuesday, July 12th, 2011

How to auto FSCK manual fsck screenshot

Are you an administrator of servers and it happens a server is DOWN.
You request the Data Center to reboot, however suddenly the server fails to boot properly and you have to request for IPKVM or some web java interface to directly access the server physical terminal …

This is a very normal admin scenario and many people who have worked in the field of remote system administrators (like me), should have experienced that bad times multiple times.

Sadly enough only a insignifant number of administrators try to do their best to reduce this down times to resolve client stuff downtime but prefer spending time playing the ztype! game or watching some porn website 😉

Anyways there are plenty of things like Server Auto Reboot on Crash with software Watchdog etc., that we as sysadmins can do to reduce server downtimes and most of the manual human interactions on server boot time.

In that manner of thougts a very common thing when setting up a new Linux server that many server admins forget or don’t know is to enable all the server partition filesystems to be auto fscked during server boot time.

By not enabling the auto filesystem check options in Linux the server filesystems did not automatically scan and fix hard drive partitions for fs innode inconsistencies.
Even though the filesystems are tuned to automatically get checked on every 38 system reboots, still if some kind of filesystem errors are found that require a manual confirmation the boot process is interrupted and the admin ends up with a server which is not reachable remotely via ssh !

For the remote system administrator, this times are a terrible times of waitings, prayers and hopes that the server hardware is fine 😉 as well as being on hold to get a KVM to get into the server manually and enter the necessery input to fsck prompt.

Many of this bad times can be completely avoided with a very simple fix through /etc/fstab by enabling all server partitions containing any filesystem to be automatically checked and fixed in case if inconsistencies or errors are found by fsck.ext3, fsck.ext4, fsck.reiserfs etc. commands.

A very typical default /etc/fstab file you will find on many servers should look something like:

/dev/sda8 / ext3 errors=remount-ro 0 1
tmpfs /dev/shm tmpfs defaults 0 0
devpts /dev/pts devpts gid=5,mode=620 0 0
sysfs /sys sysfs defaults 0 0
proc /proc proc defaults 0 0
/dev/sda1 /home ext3 defaults 0 0

Notice the line:
/dev/sda1 /home ext3 defaults 0 0

The first column in the example contains the device name, the second one its mount point, third its filesystem type, fourth the mount options, fifth (a number) dump options, and sixth (another number) filesystem check options. Let’s take a closer look at this stuff.

The ones which are interesting to enable auto fsck checking and error resolving is provided usually by the last sixth variable (filesystem check option) which in the above example equals 0 .

When the filesystem check option equals 0 this means the auto fsck and repair for the respective filesystem is disabled.
Some time in the past the dump backup option (5th option in the example) was also used but as far as I can understand today it’s not that important in modern GNU/Linux distributions.

Now having the above sample crontab in order to enable the fsck file checking on Linux boot for /dev/sda1 , we will need to modify the above line’s filesystem check option be 2, e.g. the line would afterwards look like:

/dev/sda1 /home ext3 defaults 0 2

Setting the 2 as an option for filesystem check is necessery for every filesystem which is not mounted as a root filesystem /

In above example /etc/fstab you already see that auto filesystem fsck is enabled for root partition:

/dev/sda8 / ext3 errors=remount-ro 0 1
(notice the 1 in the end of the line)

Finally a modified version of the default sample /etc/fstab which will check the extra /dev/sda1 /home partition would look like so:

/dev/sda8 / ext3 errors=remount-ro 0 1
tmpfs /dev/shm tmpfs defaults 0 0
devpts /dev/pts devpts gid=5,mode=620 0 0
sysfs /sys sysfs defaults 0 0
proc /proc proc defaults 0 0
/dev/sda1 /home ext3 defaults 0 2

Making sure all Linux server partitions has the auto filesystem check option enabled is something absoultely necessery!
Enabling the auto fsck on servers always makes me sleep calmer 😉
Hope it helps your too. 🙂

How to solve qmail /usr/local/bin/tcpserver: libc.so.6: failed to map segment from shared object: Cannot allocate memory

Saturday, April 30th, 2011

If you’re building (compiling) a new qmail server on some Linux host and after properly installing the qmail binaries and daemontools, suddenly you notice in readproctitle service errors: or somewhere in in qmail logs for instance in/var/log/qmail/current the error:

/usr/local/bin/tcpserver: error while loading shared libraries:
libc.so.6: failed to map segment from shared object: Cannot allocate memory

then you have hit a bug caused by insufficient memory assigned for tcpserver in your /var/qmail/supervise/qmail-smtpd/run daemontools qmail-smtpd initialize script:

This kind of issue is quite common especially on hardware architectures that are 64 bit and on Linux installations that are amd65 (x86_64) e.g. run 64 bit version of Linux.

It relates to the 64 bit architecture different memory distribution and thus as I said to solve requires increase in memory softlimit specified in the run script an example good qmail-smtpd run script configuration which fixed the libc.so.6: failed to map segment from shared object: Cannot allocate memory I use currently is as follows:

#!/bin/shQMAILDUID=`id -u vpopmail`NOFILESGID=`id -g vpopmail`MAXSMTPD=`cat /var/qmail/control/concurrencyincoming`# softlimit changed from 8000000exec /usr/local/bin/softlimit -m 32000000 /usr/local/bin/tcpserver -v -H -R -l 0 -x /home/vpopmail/etc/tcp.smtp.cdb -c "$MAXSMTPD"
-u "$QMAILDUID" -g "$NOFILESGID" 0 smtp
/var/qmail/bin/qmail-smtpd
/home/vpopmail/bin/vchkpw /bin/true 2>&1

The default value which was for softlimit was:

exec /usr/local/bin/softlimit -m 8000000

A good softlimit raise up values which in most cases were solving the issue for me are:

exec /usr/local/bin/softlimit -m 3000000

or exec /usr/local/bin/softlimit -m 4000000

The above example run configuration fixed the issue on a amd64 debian 5.0 lenny install, the server hardware was:

CPU: Intel(R) Core(TM)2 Duo CPU @ 2.93GHz
System Memory: 4GB
HDD Disk space: 240GB

The softlimit configuration which I had to setup on another server with system parameters:

Intel(R) Core(TM) i7 CPU (8 CPUS) @ 2.80GHz
System Memory: 8GB
HDD Disk Space: 1.4Terabytes

is as follows:

#!/bin/sh
QMAILDUID=`id -u vpopmail`
NOFILESGID=`id -g vpopmail`
MAXSMTPD=`cat /var/qmail/control/concurrencyincoming`
exec /usr/bin/softlimit -m 64000000
/usr/local/bin/tcpserver -v -H -R -l 0
-x /home/vpopmail/etc/tcp.smtp.cdb -c "$MAXSMTPD"
-u "$QMAILDUID" -g "$NOFILESGID" 0 smtp
/var/qmail/bin/qmail-smtpd
/home/vpopmail/bin/vchkpw /bin/true 2>&1

If none of the two configurations pointed out in the post works, for you just try to manually set up the exec /usr/bin/softlimit -m to some high value.

To assure that the newly set value is not producing the same error you will have to, reload completely the daemontools proc monitor system.
To do so open /etc/inittab comment out the line:

SV:123456:respawn:/command/svscanboot
to
#SV:123456:respawn:/command/svscanboot

Save again /etc/inittab and issue te cmd:

linux:~# init q

Now again open /etc/inittab and uncomment the commented line:

#SV:123456:respawn:/command/svscanboot to
SV:123456:respawn:/command/svscanboot

Lastly reload the inittab script once again with command:

linux:~# init q

To check if the error has disappeared check the readproctitle process, like so:

linux:~# ps ax|grep -i readproctitle

The command output should produce something like:

3070 ? S 0:00 readproctitle service errors: .......................................

Hope that helps.