If you're a Linux server administrator running MySQL server, you need to troubleshoot performance and bottleneck issues with the SQL database every now and then. In this article, I will pinpoint few methods to debug basic issues with MySQL database servers.
1. Troubleshooting MySQL database queries with native SQL commands
a)One way to debug errors and get general statistics is by logging in with mysql cli and check the mysql server status:
# mysql -u root -p

mysql> SHOW STATUS;

+-----------------------------------+------------+

| Variable_name | Value |

+-----------------------------------+------------+

| Aborted_clients | 1132 |

| Aborted_connects | 58 |

| Binlog_cache_disk_use | 185 |

| Binlog_cache_use | 2542 |

| Bytes_received | 115 |

.....

.....

| Com_xa_start | 0 |

| Compression | OFF |

| Connections | 150000 |

| Created_tmp_disk_tables | 0 |

| Created_tmp_files | 221 |

| Created_tmp_tables | 1 |

| Delayed_errors | 0 |

| Delayed_insert_threads | 0 |

| Delayed_writes | 0 |

| Flush_commands | 1 |

.....

.....

| Handler_write | 132 |

| Innodb_page_size | 16384 |

| Innodb_pages_created | 6204 |

| Innodb_pages_read | 8859 |

| Innodb_pages_written | 21931 |

.....

.....

| Slave_running | OFF |

| Slow_launch_threads | 0 |

| Slow_queries | 0 |

| Sort_merge_passes | 0 |

| Sort_range | 0 |

| Sort_rows | 0 |

| Sort_scan | 0 |

| Table_locks_immediate | 4065218 |

| Table_locks_waited | 196 |

| Tc_log_max_pages_used | 0 |

| Tc_log_page_size | 0 |

| Tc_log_page_waits | 0 |

| Threads_cached | 51 |

| Threads_connected | 1 |

| Threads_created | 52 |

| Threads_running | 1 |

| Uptime | 334856 |

+-----------------------------------+------------+

225 rows in set (0.00 sec)
SHOW STATUS; command gives plenty of useful info, however it is not showing the exact list of queries currently processed by the SQL server. Therefore sometimes it is exactly a stucked (slow queries) execution, you need to debug in order to fix a lagging SQL. One way to track this slow queries is via enabling mysql slow-query.log. Anyways enabling the slow-query requires a MySQL server restart and some critical productive database servers are not so easy to restart and the SQL slow queries have to be tracked "on the fly" so to say.
Therefore, to check the exact (slow) queries processed by the SQL server (without restarting it), do
mysql> SHOW processlist;
+——+——+—————+——+———+——+————–+——————————————————————————————————+
| Id | User | Host | db | Command | Time | State | Info |
+——+——+—————+——+———+——+————–+——————————————————————————————————+
| 609 | root | localhost | blog | Sleep | 5 | | NULL |
| 1258 | root | localhost | NULL | Sleep | 85 | | NULL |
| 1308 | root | localhost | NULL | Query | 0 | NULL | show processlist |
| 1310 | blog | pcfreak:64033 | blog | Query | 0 | Sending data | SELECT comment_author, comment_author_url, comment_content, comment_post_ID, comment_ID, comment_aut |
+——+——+—————+——+———+——+————–+——————————————————————————————————+
4 rows in set (0.00 sec)
mysql>
SHOW processlist gives a good view on what is happening inside the SQL.
To get more complete information on SQL query threads use the full extra option:
mysql> SHOW full processlist;
This gives pretty full info on running threads, but unfortunately it is annoying to re-run the command again and again – constantly to press UP Arrow + Enter keys.
Hence it is useful to get the same command output, refresh periodically every few seconds. This is possible by running it through the watch command:
debian:~# watch "'show processlist' | mysql -u root -p'secret_password'"
watch will run SHOW processlist every 2 secs (this is default watch refresh time, for other timing use watch -n 1, watch -n 10 etc. etc.
The produced output will be similar to:
Every 2.0s: echo 'show processlist' | mysql -u root -p'secret_password' Thu May 10 17:24:19 2012
Id User Host db Command Time State Info

609 root localhost blog Sleep 3 NULL1258 root localhost NULL Sleep 649 NULL1542 blog pcfreak:64981 blog Query 0 Copying to tmp table \

SELECT p.ID, p.post_title, p.post_content,p.post_excerpt, p.pos

t_date, p.comment_count, count(t_r.o

1543 root localhost NULL Query 0 NULL show processlist
Though this "hack" is one of the possible ways to get some interactivity on what is happening inside SQL server databases and tables table. for administering hundred or thousand SQL servers running dozens of queries per second – monitor their behaviour few times aday using mytop or mtop is times easier.
Though, the names of the two tools are quite similar and I used to think both tools are one and the same, actually they're not but both are suitable for monitoring sql database execution in real time.
As a sys admin, I've used mytop and mtop, on almost each Linux server with MySQL server installed.
Both tools has helped me many times in debugging oddities with sql servers. Therefore my personal view is mytop and mtop should be along with the Linux sysadmin most useful command tools outfit, still I'm sure many administrators still haven't heard about this nice goodies.
1. Installing mytop on Debian, Ubuntu and other deb based GNU / Linux-es
mytop is available for easy install on Debian and across all debian / ubuntu and deb derivative distributions via apt.
Here is info obtained with apt-cache show
debian:~# apt-cache show mytop|grep -i description -A 3

Description: top like query monitor for MySQL

Mytop is a console-based tool for monitoring queries and the performance

of MySQL. It supports version 3.22.x, 3.23.x, 4.x and 5.x servers.

It's written in Perl and support connections using TCP/IP and UNIX sockets.
Installing the tool is done with the trivial:
debian:~# apt-get --yes install mytop

....
mtop used to be available for apt-get-ting in Debian Lenny and prior Debian releases but in Squeeze onwards, only mytop is included (probably due to some licensing incompitabilities with mtop??).
For those curious on how mtop / mytop works – both are perl scripts written to periodically connects to the SQL server and run commands similar to SHOW FULL PROCESSLIST;. Then, the output is parsed and displayed to the user.
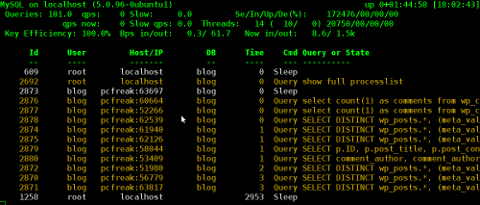
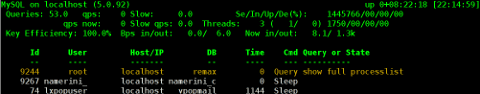
Here how mytop running, looks like:
2. Installing mytop on RHEL and CentOS
By default in RHEL and CentOS and probably other RedHat based Linux-es, there is neither mtop nor mytop available in package repositories. Hence installing the tools on those is only available from 3rd parties. As of time of writting an rpm builds for RHEL and CentOS, as well as (universal rpm distros) src.rpm package is available on http://pkgs.repoforge.org/mytop/. For the sake of preservation – if in future those RPMs disappear, I made a mirror of mytop rpm's here
Mytop rpm builds depend on a package perl(Term::ReadKey), my attempt to install it on CentOS 5.6, returned following err:
[root@cenots ~]# rpm -ivh mytop-1.4-2.el5.rf.noarch.rpm

warning: mytop-1.4-2.el5.rf.noarch.rpm: Header V3 DSA signature: NOKEY, key ID 6b8d79e6

error: Failed dependencies:

perl(Term::ReadKey) is needed by mytop-1.4-2.el5.rf.noarch
The perl(Term::ReadKey package is not available in CentOS 5.6 and (probably other centos releases default repositories so I had to google perl(Term::ReadKey) I found it on http://rpm.pbone.net/ package repository, the exact url to the rpm dependency as of time of writting this post is:
ftp://ftp.pbone.net/mirror/yum.trixbox.org/centos/5/old/perl-Term-ReadKey-2.30-2.rf.i386.rpm
Quickest, way to install it is:
[root@centos ~]# rpm -ivh ftp://ftp.pbone.net/mirror/yum.trixbox.org/centos/5/old/perl-Term-ReadKey-2.30-2.rf.i386.rpmRetrieving ftp://ftp.pbone.net/mirror/yum.trixbox.org/centos/5/old/perl-Term-ReadKey-2.30-2.rf.i386.rpmPreparing... ########################################### [100%]

1:perl-Term-ReadKey ########################################### [100%]
This time mytop, install went fine:
[root@centos ~]# rpm -ivh mytop-1.4-2.el5.rf.noarch.rpm

warning: mytop-1.4-2.el5.rf.noarch.rpm: Header V3 DSA signature: NOKEY, key ID 6b8d79e6

Preparing... ########################################### [100%]

1:mytop ########################################### [100%]
To use it further, it is the usual syntax:
mytop -u username -p 'secret_password' -d database
3. Installing mytop and mtop on FreeBSD and other BSDs
To debug the running SQL queries in a MySQL server running on FreeBSD, one could use both mytop and mtop – both are installable via ports:
a) To install mtop exec:
freebsd# cd /usr/ports/sysutils/mtop

freebsd# make install clean

....
b) To install mytop exec:
freebsd# cd /usr/ports/databases/mytop

freebsd# make install clean

....
I personally prefer to use mtop on FreeBSD, because once run it runs prompts the user to interactively type in the user/pass
freebsd# mtop
Then mtop prompts the user with "interactive" dialog screen to type in user and pass:

It is pretty annoying, same mtop like syntax don't show user/pass prompt:
freebsd# mytop

Cannot connect to MySQL server. Please check the:
* database you specified "test" (default is "test")

* username you specified "root" (default is "root")

* password you specified "" (default is "")

* hostname you specified "localhost" (default is "localhost")

* port you specified "3306" (default is 3306)

* socket you specified "" (default is "")

The options my be specified on the command-line or in a ~/.mytop

config file. See the manual (perldoc mytop) for details.

Here's the exact error from DBI. It might help you debug:

Unknown database 'test'
The correct syntax to run mytop instead is:
freebsd# mytop -u root -p 'secret_password' -d 'blog'
Or the longer more descriptive:
freebsd# mytop --user root --pass 'secret_password' --database 'blog'
By the way if you take a look at mytop's manual you will notice a tiny error in documentation, where the three options –user, –pass and –database are wrongly said to be used as -user, -pass, -database:
freebsd# mytop -user root -pass 'secret_password' -database 'blog'

Cannot connect to MySQL server. Please check the:
* database you specified "atabase" (default is "test")

* username you specified "ser" (default is "root")

* password you specified "ass" (default is "")

* hostname you specified "localhost" (default is "localhost")

* port you specified "3306" (default is 3306)

* socket you specified "" (default is "")a

...

Access denied for user 'ser'@'localhost' (using password: YES)
Actually it is interesting mytop, precededed historically mtop.
mtop was later written (probably based on mytop), to run on FreeBSD OS by a famous MySQL (IT) spec — Jeremy Zawodny .
Anyone who has to do frequent MySQL administration tasks, should already heard Zawodny's name.
For those who haven't, Jeremy used to be a head database administrators and developer in Yahoo! Inc. some few years ago.
His website contains plenty of interesting thoughts and writtings on MySQL server and database management