Posts Tagged ‘User’

Create Haproxy Loadbalancer Access Control Lists and forward incoming frontend traffics based on simple logic

Friday, February 16th, 2024

Create-haproxy-loadbalancer-access-control-list-and-forward-frontend-traffic-based-on-simple-logic-acls-logo

Haproxy Load Balancers could do pretty much to load balance traffic between application servers. The most straight forward way to use is to balance traffic for incoming Frontends towards a Backend configuration with predefined Application machines and ports to send the traffic, where one can be the leading one and others be set as backup or we can alternatively send the traffic towards a number of machines incoming to a Frontend port bind IP listener and number of backend machine.

Besides this the more interesting capabilities of Haproxy comes with using Access Control Lists (ACLs) to forward Incoming Frontend (FT) traffic towards specific backends and ports based on logic, power ACLs gives to Haproxy to do a sophisticated load balancing are enormous. 
In this post I'll give you a very simple example on how you can save some time, if you have already a present Frontend listening to a Range of TCP Ports and it happens you want to redirect some of the traffic towards a spefic predefined Backend.

This is not the best way to it as Access Control Lists will put some extra efforts on the server CPU, but as today machines are quite powerful, it doesn't really matter. By using a simple ACLs as given in below example, one can save much of a time of writting multiple frontends for a complete sequential port range, if lets say only two of the ports in the port range and distinguish and redirect traffic incoming to Haproxy frontend listener in the port range of 61000-61230 towards a certain Ports that are supposed to go to a Common Backends to a separate ones, lets say ports 61115 and 61215.

Here is a short description on the overall screnarios. We have an haproxy with 3 VIP (Virtual Private IPs) with a Single Frontend with 3 binded IPs and 3 Backends, there is a configured ACL rule to redirect traffic for certain ports, the overall Load Balancing config is like so:

Frontend (ft):

ft_PROD:
listen IPs:

192.168.0.77
192.168.0.83
192.168.0.78

On TCP port range: 61000-61299

Backends (bk): 

bk_PROD_ROUNDROBIN
bk_APP1
bk_APP2


Config Access Control Liststo seperate incoming haproxy traffic for CUSTOM_APP1 and CUSTOM_APP2


By default send all incoming FT traffic to: bk_PROD_ROUNDROBIN

With exception for frontend configured ports on:
APP1 port 61115 
APP2 port 61215

If custom APP1 send to bk:
RULE1
If custom APP2 send to bk:
RULE2

Config on frontends traffic send operation: 

bk_PROD_ROUNDROBIN (roundrobin) traffic send to App machines all in parallel
traffic routing mode (roundrobin)
Appl1
Appl2
Appl3
Appl4

bk_APP1 and bk_APP2

traffic routing mode: (balance source)
Appl1 default serving host

If configured check port 61888, 61887 is down, traffic will be resend to configured pre-configured backup hosts: 

Appl2
Appl3
Appl4


/etc/haproxy/haproxy.cfg that does what is described with ACL LB capabilities looks like so:

#———————————————————————
# Global settings
#———————————————————————
global
    log         127.0.0.1 local2

    chroot      /var/lib/haproxy
    pidfile     /var/run/haproxy.pid
    maxconn     4000
    user        haproxy
    group       haproxy
    daemon

    # turn on stats unix socket
    stats socket /var/lib/haproxy/stats

#———————————————————————
# common defaults that all the 'listen' and 'backend' sections will
# use if not designated in their block
#———————————————————————
defaults
    mode                    tcp
    log                     global
    option                  tcplog
    #option                  dontlognull
    #option http-server-close
    #option forwardfor       except 127.0.0.0/8
    option                  redispatch
    retries                 7
    #timeout http-request    10s
    timeout queue           10m
    timeout connect         30s
    timeout client          20m
    timeout server          10m
    #timeout http-keep-alive 10s
    timeout check           30s
    maxconn                 3000


#———————————————————————
# Synchronize server entries in sticky tables
#———————————————————————

peers hapeers
    peer haproxy1-fqdn.com 192.168.0.58:8388
    peer haproxy2-fqdn.com 192.168.0.79:8388


#———————————————————————
# HAProxy Monitoring Config
#———————————————————————
listen stats 192.168.0.77:8080                #Haproxy Monitoring run on port 8080
    mode http
    option httplog
    option http-server-close
    stats enable
    stats show-legends
    stats refresh 5s
    stats uri /stats                            #URL for HAProxy monitoring
    stats realm Haproxy\ Statistics
    stats auth hauser:secretpass4321         #User and Password for login to the monitoring dashboard
    stats admin if TRUE
    #default_backend bk_Prod1         #This is optionally for monitoring backend
#———————————————————————
# HAProxy Monitoring Config
#———————————————————————
#listen stats 192.168.0.83:8080                #Haproxy Monitoring run on port 8080
#    mode http
#    option httplog
#    option http-server-close
#    stats enable
#    stats show-legends
#    stats refresh 5s
#    stats uri /stats                            #URL for HAProxy monitoring
#    stats realm Haproxy\ Statistics
#    stats auth hauser:secretpass321          #User and Password for login to the monitoring dashboard
#    stats admin if TRUE
#    #default_backend bk_Prod1           #This is optionally for monitoring backend

#———————————————————————
# HAProxy Monitoring Config
#———————————————————————
# listen stats 192.168.0.78:8080                #Haproxy Monitoring run on port 8080
#    mode http
#    option httplog
#    option http-server-close
#    stats enable
#    stats show-legends
#    stats refresh 5s
#    stats uri /stats                            #URL for HAProxy monitoring
#    stats realm Haproxy\ Statistics
#    stats auth hauser:secretpass123          #User and Password for login to the monitoring dashboard
#    stats admin if TRUE
#    #default_backend bk_DKV_PROD_WLPFO          #This is optionally for monitoring backend


#———————————————————————
# frontend which proxys to the backends
#———————————————————————
frontend ft_PROD
    mode tcp
    bind 192.168.0.77:61000-61299
        bind 192.168.0.83:51000-51300
        bind 192.168.0.78:51000-62300
    option tcplog
        # (4) Peer Sync: a sticky session is a session maintained by persistence
        stick-table type ip size 1m peers hapeers expire 60m
# Commented for change CHG0292890
#   stick on src
    log-format %ci:%cp\ [%t]\ %ft\ %b/%s\ %Tw/%Tc/%Tt\ %B\ %ts\ %ac/%fc/%bc/%sc/%rc\ %sq/%bq
        acl RULE1 dst_port 61115
        acl RULE2 dst_port 61215
        use_backend APP1 if app1
        use_backend APP2 if app2
    default_backend bk_PROD_ROUNDROBIN


#———————————————————————
# round robin balancing between the various backends
#———————————————————————
backend bk_PROD_ROUNDROBIN
    mode tcp
    # (0) Load Balancing Method.
    balance roundrobin
    # (4) Peer Sync: a sticky session is a session maintained by persistence
    stick-table type ip size 1m peers hapeers expire 60m
    # (5) Server List
    # (5.1) Backend
    server appl1 10.33.0.50 check port 31232
    server appl2 10.33.0.51 check port 31232 
    server appl2 10.45.0.78 check port 31232 
    server appl3 10.45.0.79 check port 31232 

#———————————————————————
# source balancing for the GUI
#———————————————————————
backend bk_APP2
    mode tcp
    # (0) Load Balancing Method.
    balance source
    # (4) Peer Sync: a sticky session is a session maintained by persistence
    stick-table type ip size 1m peers hapeers expire 60m
        stick on src
    # (5) Server List
    # (5.1) Backend
    server appl1 10.33.0.50 check port 55232
    server appl2 10.32.0.51 check port 55232 backup
    server appl3 10.45.0.78 check port 55232 backup
    server appl4 10.45.0.79 check port 55232 backup

#———————————————————————
# source balancing for the OLW
#———————————————————————
backend bk_APP1
    mode tcp
    # (0) Load Balancing Method.
    balance source
    # (4) Peer Sync: a sticky session is a session maintained by persistence
    stick-table type ip size 1m peers hapeers expire 60m
        stick on src
    # (5) Server List
    # (5.1) Backend
    server appl1 10.33.0.50 check port 53119
    server appl2 10.32.0.51 check port 53119 backup
    server appl3 10.45.0.78 check port 53119 backup
    server appl4 10.45.0.79 check port 53119 backup


You can also check and download the haproxy.cfg here.
Enjjoy !

Check when Windows Active Directory user expires and set user password expire to Never

Thursday, January 9th, 2020

micorosoft-windows-10-logo-net-user-command-check-expiry-dates

If you're working for a company that is following high security / PCI Security Standards and you're using m$ Windows OS that belongs to the domain it is useful to know when your user is set to expiry
to know how many days are left until you'll be forced to change your Windows AD password.
In this short article I'll explain how to check Windows AD last password set date / date expiry date and how you can list expiry dates for other users, finally will explain how to set your expiry date to Never
to get rid of annoying change password every 90 days.


1. Query domain Username for Password set / Password Expires set dates

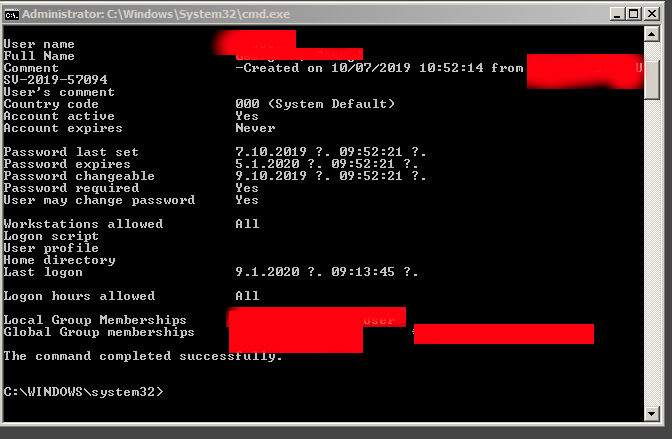
To know this info you need to know the Password expiration date for Active Directory user account, to know it just open Command Line Prompt cmd.exe

And run command:


NET USER Your-User-Name /domain


net-user-domain-command-check-AD-user-expiry

Note that, many companies does only connect you to AD for security reason only on a VPN connect with something like Cisco AnyConnect Secure Mobility Client whatever VPN connect tool is used to encrypt the traffic between you and the corporate DMZ-ed network

Below is basic NET USER command usage args:

Net User Command Options
 

Item          Explanation

net user    Execute the net user command alone to show a very simple list of every user account, active or not, on the computer you're currently using.

username    This is the name of the user account, up to 20 characters long, that you want to make changes to, add, or remove. Using username with no other option will show detailed information about the user in the Command Prompt window.

password    Use the password option to modify an existing password or assign one when creating a new username. The minimum characters required can be viewed using the net accounts command. A maximum of 127 characters is allowed1.
*    You also have the option of using * in place of a password to force the entering of a password in the Command Prompt window after executing the net user command.

/add    Use the /add option to add a new username on the system.
options    See Additional Net User Command Options below for a complete list of available options to be used at this point when executing net user.

/domain    This switch forces net user to execute on the current domain controller instead of the local computer.

/delete    The /delete switch removes the specified username from the system.

/help    Use this switch to display detailed information about the net user command. Using this option is the same as using the net help command with net user: net help user.
/?    The standard help command switch also works with the net user command but only displays the basic command syntax. Executing net user without options is equal to using the /? switch.


2. Listing all Active Directory users last set date / never expires and expiration dates


If you have the respective Active Directory rights and you have the Remote Server Administration Tools for Windows (RSAT Tools), you are able to do also other interesting stuff,


such as

– using PowerShell to list all user last set dates, to do so use Open Power Shell and issue:
 

get-aduser -filter * -properties passwordlastset, passwordneverexpires |ft Name, passwordlastset, Passwordneverexpires


get-aduser-properties-passwordlastset-passwordneverexpires1

This should show you info as password last set date and whether password expiration is set for account.

– Using PS to get only the password expirations for all AD existing users is with:


Get-ADUser -filter {Enabled -eq $True -and PasswordNeverExpires -eq $False} –Properties "DisplayName", "msDS-UserPasswordExpiryTimeComputed" |
Select-Object -Property "Displayname",@{Name="ExpiryDate";Expression={[datetime]::FromFileTime($_."msDS-UserPasswordExpiryTimeComputed")}}


If you need the output data to get stored in CSV file delimitered format you can add to above PS commands
 

| export-csv YOUR-OUTPUT-FILE.CSV


3. Setting a user password to never Expiry


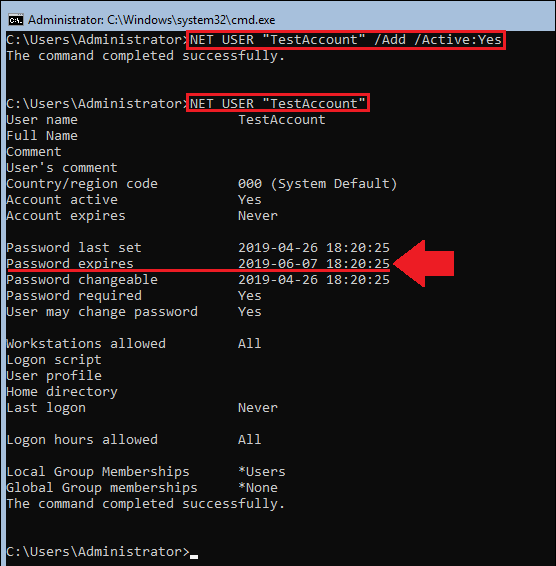
If the user was created with NET USER command by default it will have been created to have a password expiration. 
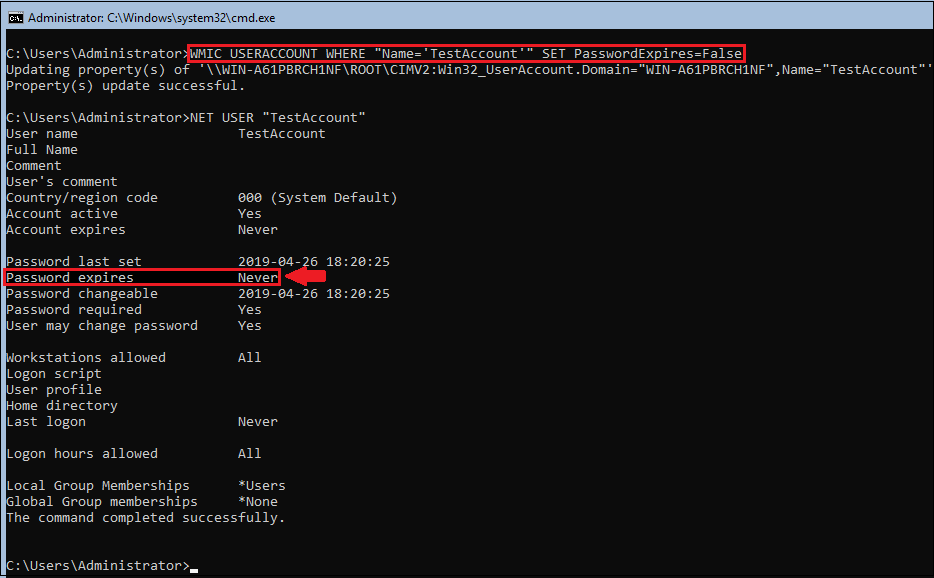
However if you need to create new users for yourself (assuming you have the rights), with passwords that never expire on lets say Windows Server 2016 – (if you don't care about security so much), use:
 

NET USER "Username" /Add /Active:Yes

WMIC USERACCOUNT WHERE "Name='Username' SET PasswordExpires=False


NET-USER-ADD_Active-yes-Microsoft-Windows-screenshot

NET-USER-set-password-policy-to-Never-expiry-MS-Windows

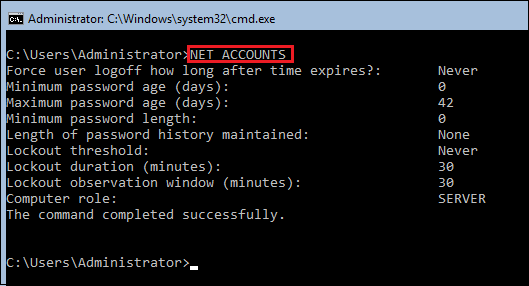
To view the general password policies, type following:
 

NET ACCOUNTS


NET-ACCOUNTS-view-default-Microsoft-Windows-password-policy


Create SFTP CHROOT Jail User for data transfer to better Linux shared web hosting server security

Monday, December 3rd, 2018

Adding user SFTP access to a Linux system is often required and therefore a must for multi users or web hosting environments it is an absolute requirement to have SFTP  user space separation ( isolation ) out of the basic Linux system environment this is done using a fake CHROOT Jail.

Purpose of this article is to show how to create SFTP Chroot JAIL in few easy configurations.

By isolating each user into his own space you will protect the users to not eventually steal or mistakenly leak information such as user credentials / passwords etc.

Besides that it is useful to restrict the User to his own File / Web Space to have granted only access to Secure FTP (SFTP) only and not SSH login access and togheter with the chroot jail environment to protect your server from being attempted to be hacked (rooted / exploited) through some (0day) zero-day kernel 1337 vulnerability.

1. Setup Chrooted file system and do the bind mount in /etc/fstab
 

# chown root:root /mnt/data/share
# chmod 755 /mnt/data/share
# mkdir -p /sftp/home
# mount -o bind /mnt/data/share /sftp/home

Next add to /etc/fstab (e.g. vim /etc/fstab) and add following line:
 

/mnt/data/share /sftp/home  none   bind   0   0


To mount it next:
 

# mount -a


/mnt/data/share is a mounted HDD in my case but could be any external attached storage


2. Create User and sftpgroup group and add your new SFTP Jailed user accounts to it

To achieve SFTP only CHROOT Jail environment you need some UNIX accounts new group created such as sftpgroup and use it to assign proper ownership / permissions to newly added SFTP restricted accounts.
 

# groupadd sftpgroup


Once the group exists, next step is to create the desired username / usernames with useradd command and assign it to sftpgroup:


# adduser sftp-account1 -s /sbin/nologin -d /sftp/home
# passwd sftp-account1


usermod -G sftpgroup sftp-account1


Above both commands could be also done in one line with adduser


# adduser sftp-account1 -g sftpgroup -s /sbin/nologin -d /sftp/home

Note the /sbin/nologin which is set to prevent SSH logins but still allow access via sftp / scp data transfer clients Once the user exists it is a good idea to prepare the jailed environment under a separate directory under root File system system lets say in /sftp/home/

3. Set proper permissions to User chrooted /home folder

# mkdir -p /sftp/home
# mkdir /sftp/home/sftp-account1
# chown root:root /sftp/
# chown sftp-account1:sftpgroup /sftp/home/sftp-account1

For each new created uesr (in this case sftp-account1) make sure the permissions are properly set to make the files readable only by the respective user.

# chmod 700 -R /sftp/home/sftp-account1

For every next created user don't forget to do the same 3. Modify SSHD configuration file to add Chroot match rules Edit /etc/ssh/sshd_config file and to the end of it add below configuration:

# vim /etc/ssh/sshd_config
Subsystem sftp internal-sftp     
Match Group sftpgroup   
ChrootDirectory /sftp/home   
ForceCommand internal-sftp   
X11Forwarding no   
AllowTcpForwarding no


Restart sshd to make the new settings take effect, to make sure you don't ed up with no access (if it is a remote server) run the sshd daemon on a secondary port like so:
 

# /usr/sbin/sshd -p 2208 &

Then restart sshd – if it is old Linux with Init V support

# /etc/init.d/sshd restart

– For systemd Linux systems

# systemctl restart sshd


4. Verify Username (sftp-account1) could login only via SFTP and his environment is chrooted


ssh sftp-account1@www.pc-freak.net

This service allows sftp connections only.
Connection to 83.228.93.76 closed.


sftp sftp-account1@www.pc-freak.net Connected to 83.228.93.76. sftp>


5. Closure

The quick summary of What we have achieved with below is:

restrict Linux users from having no /bin/shell access but still have Secure FTP copy in few steps to summarize them

a. create new user and group for SFTP chrooted restricted access only
b. set proper permissions to make folder accessible only by user itself
c. added necessery sshd config and restarted sshd to make it working d. tested configuration

This short guide was based on documentation on Arch Linux's wiki SFTP chroot you can check it here.

Monitoring MySQL server queries and debunning performance (slow query) issues with native MySQL commands and with mtop, mytop

Thursday, May 10th, 2012

If you're a Linux server administrator running MySQL server, you need to troubleshoot performance and bottleneck issues with the SQL database every now and then. In this article, I will pinpoint few methods to debug basic issues with MySQL database servers.

1. Troubleshooting MySQL database queries with native SQL commands

a)One way to debug errors and get general statistics is by logging in with mysql cli and check the mysql server status:

# mysql -u root -p
mysql> SHOW STATUS;
+-----------------------------------+------------+
| Variable_name | Value |
+-----------------------------------+------------+
| Aborted_clients | 1132 |
| Aborted_connects | 58 |
| Binlog_cache_disk_use | 185 |
| Binlog_cache_use | 2542 |
| Bytes_received | 115 |
.....
.....
| Com_xa_start | 0 |
| Compression | OFF |
| Connections | 150000 |
| Created_tmp_disk_tables | 0 |
| Created_tmp_files | 221 |
| Created_tmp_tables | 1 |
| Delayed_errors | 0 |
| Delayed_insert_threads | 0 |
| Delayed_writes | 0 |
| Flush_commands | 1 |
.....
.....
| Handler_write | 132 |
| Innodb_page_size | 16384 |
| Innodb_pages_created | 6204 |
| Innodb_pages_read | 8859 |
| Innodb_pages_written | 21931 |
.....
.....
| Slave_running | OFF |
| Slow_launch_threads | 0 |
| Slow_queries | 0 |
| Sort_merge_passes | 0 |
| Sort_range | 0 |
| Sort_rows | 0 |
| Sort_scan | 0 |
| Table_locks_immediate | 4065218 |
| Table_locks_waited | 196 |
| Tc_log_max_pages_used | 0 |
| Tc_log_page_size | 0 |
| Tc_log_page_waits | 0 |
| Threads_cached | 51 |
| Threads_connected | 1 |
| Threads_created | 52 |
| Threads_running | 1 |
| Uptime | 334856 |
+-----------------------------------+------------+
225 rows in set (0.00 sec)

SHOW STATUS; command gives plenty of useful info, however it is not showing the exact list of queries currently processed by the SQL server. Therefore sometimes it is exactly a stucked (slow queries) execution, you need to debug in order to fix a lagging SQL. One way to track this slow queries is via enabling mysql slow-query.log. Anyways enabling the slow-query requires a MySQL server restart and some critical productive database servers are not so easy to restart and the SQL slow queries have to be tracked "on the fly" so to say.
Therefore, to check the exact (slow) queries processed by the SQL server (without restarting it), do
 

mysql> SHOW processlist;
+——+——+—————+——+———+——+————–+——————————————————————————————————+
| Id | User | Host | db | Command | Time | State | Info |
+——+——+—————+——+———+——+————–+——————————————————————————————————+
| 609 | root | localhost | blog | Sleep | 5 | | NULL |
| 1258 | root | localhost | NULL | Sleep | 85 | | NULL |
| 1308 | root | localhost | NULL | Query | 0 | NULL | show processlist |
| 1310 | blog | pcfreak:64033 | blog | Query | 0 | Sending data | SELECT comment_author, comment_author_url, comment_content, comment_post_ID, comment_ID, comment_aut |
+——+——+—————+——+———+——+————–+——————————————————————————————————+
4 rows in set (0.00 sec)
mysql>

SHOW processlist gives a good view on what is happening inside the SQL.

To get more complete information on SQL query threads use the full extra option:

mysql> SHOW full processlist;

This gives pretty full info on running threads, but unfortunately it is annoying to re-run the command again and again – constantly to press UP Arrow + Enter keys.

Hence it is useful to get the same command output, refresh periodically every few seconds. This is possible by running it through the watch command:

debian:~# watch "'show processlist' | mysql -u root -p'secret_password'"

watch will run SHOW processlist every 2 secs (this is default watch refresh time, for other timing use watch -n 1, watch -n 10 etc. etc.

The produced output will be similar to:

Every 2.0s: echo 'show processlist' | mysql -u root -p'secret_password' Thu May 10 17:24:19 2012

Id User Host db Command Time State Info
609 root localhost blog Sleep 3 NULL1258 root localhost NULL Sleep 649 NULL1542 blog pcfreak:64981 blog Query 0 Copying to tmp table \
SELECT p.ID, p.post_title, p.post_content,p.post_excerpt, p.pos
t_date, p.comment_count, count(t_r.o
1543 root localhost NULL Query 0 NULL show processlist

Though this "hack" is one of the possible ways to get some interactivity on what is happening inside SQL server databases and tables table. for administering hundred or thousand SQL servers running dozens of queries per second – monitor their behaviour few times aday using mytop or mtop is times easier.

Though, the names of the two tools are quite similar and I used to think both tools are one and the same, actually they're not but both are suitable for monitoring sql database execution in real time.

As a sys admin, I've used mytop and mtop, on almost each Linux server with MySQL server installed.
Both tools has helped me many times in debugging oddities with sql servers. Therefore my personal view is mytop and mtop should be along with the Linux sysadmin most useful command tools outfit, still I'm sure many administrators still haven't heard about this nice goodies.

1. Installing mytop on Debian, Ubuntu and other deb based GNU / Linux-es

mytop is available for easy install on Debian and across all debian / ubuntu and deb derivative distributions via apt.

Here is info obtained with apt-cache show

debian:~# apt-cache show mytop|grep -i description -A 3
Description: top like query monitor for MySQL
Mytop is a console-based tool for monitoring queries and the performance
of MySQL. It supports version 3.22.x, 3.23.x, 4.x and 5.x servers.
It's written in Perl and support connections using TCP/IP and UNIX sockets.

Installing the tool is done with the trivial:

debian:~# apt-get --yes install mytop
....

mtop used to be available for apt-get-ting in Debian Lenny and prior Debian releases but in Squeeze onwards, only mytop is included (probably due to some licensing incompitabilities with mtop??).

For those curious on how mtop / mytop works – both are perl scripts written to periodically connects to the SQL server and run commands similar to SHOW FULL PROCESSLIST;. Then, the output is parsed and displayed to the user.

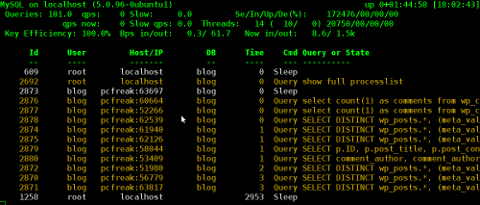
Here how mytop running, looks like:

MyTOP showing queries running on Ubuntu 8.04 Linux - Debugging interactively top like MySQL

2. Installing mytop on RHEL and CentOS

By default in RHEL and CentOS and probably other RedHat based Linux-es, there is neither mtop nor mytop available in package repositories. Hence installing the tools on those is only available from 3rd parties. As of time of writting an rpm builds for RHEL and CentOS, as well as (universal rpm distros) src.rpm package is available on http://pkgs.repoforge.org/mytop/. For the sake of preservation – if in future those RPMs disappear, I made a mirror of mytop rpm's here

Mytop rpm builds depend on a package perl(Term::ReadKey), my attempt to install it on CentOS 5.6, returned following err:

[root@cenots ~]# rpm -ivh mytop-1.4-2.el5.rf.noarch.rpm
warning: mytop-1.4-2.el5.rf.noarch.rpm: Header V3 DSA signature: NOKEY, key ID 6b8d79e6
error: Failed dependencies:
perl(Term::ReadKey) is needed by mytop-1.4-2.el5.rf.noarch

The perl(Term::ReadKey package is not available in CentOS 5.6 and (probably other centos releases default repositories so I had to google perl(Term::ReadKey) I found it on http://rpm.pbone.net/ package repository, the exact url to the rpm dependency as of time of writting this post is:

ftp://ftp.pbone.net/mirror/yum.trixbox.org/centos/5/old/perl-Term-ReadKey-2.30-2.rf.i386.rpm

Quickest, way to install it is:

[root@centos ~]# rpm -ivh ftp://ftp.pbone.net/mirror/yum.trixbox.org/centos/5/old/perl-Term-ReadKey-2.30-2.rf.i386.rpmRetrieving ftp://ftp.pbone.net/mirror/yum.trixbox.org/centos/5/old/perl-Term-ReadKey-2.30-2.rf.i386.rpmPreparing... ########################################### [100%]
1:perl-Term-ReadKey ########################################### [100%]

This time mytop, install went fine:

[root@centos ~]# rpm -ivh mytop-1.4-2.el5.rf.noarch.rpm
warning: mytop-1.4-2.el5.rf.noarch.rpm: Header V3 DSA signature: NOKEY, key ID 6b8d79e6
Preparing... ########################################### [100%]
1:mytop ########################################### [100%]

To use it further, it is the usual syntax:

mytop -u username -p 'secret_password' -d database

CentOS Linux MyTOP MySQL query benchmark screenshot - vpopmail query

3. Installing mytop and mtop on FreeBSD and other BSDs

To debug the running SQL queries in a MySQL server running on FreeBSD, one could use both mytop and mtop – both are installable via ports:

a) To install mtop exec:

freebsd# cd /usr/ports/sysutils/mtop
freebsd# make install clean
....

b) To install mytop exec:

freebsd# cd /usr/ports/databases/mytop
freebsd# make install clean
....

I personally prefer to use mtop on FreeBSD, because once run it runs prompts the user to interactively type in the user/pass

freebsd# mtop

Then mtop prompts the user with "interactive" dialog screen to type in user and pass:

Mtop interactive type in username and password screenshot on FreeBSD 7.2

It is pretty annoying, same mtop like syntax don't show user/pass prompt:

freebsd# mytop
Cannot connect to MySQL server. Please check the:

* database you specified "test" (default is "test")
* username you specified "root" (default is "root")
* password you specified "" (default is "")
* hostname you specified "localhost" (default is "localhost")
* port you specified "3306" (default is 3306)
* socket you specified "" (default is "")
The options my be specified on the command-line or in a ~/.mytop
config file. See the manual (perldoc mytop) for details.
Here's the exact error from DBI. It might help you debug:
Unknown database 'test'

The correct syntax to run mytop instead is:

freebsd# mytop -u root -p 'secret_password' -d 'blog'

Or the longer more descriptive:

freebsd# mytop --user root --pass 'secret_password' --database 'blog'

By the way if you take a look at mytop's manual you will notice a tiny error in documentation, where the three options –user, –pass and –database are wrongly said to be used as -user, -pass, -database:

freebsd# mytop -user root -pass 'secret_password' -database 'blog'
Cannot connect to MySQL server. Please check the:

* database you specified "atabase" (default is "test")
* username you specified "ser" (default is "root")
* password you specified "ass" (default is "")
* hostname you specified "localhost" (default is "localhost")
* port you specified "3306" (default is 3306)
* socket you specified "" (default is "")a
...
Access denied for user 'ser'@'localhost' (using password: YES)

Actually it is interesting mytop, precededed historically mtop.
mtop was later written (probably based on mytop), to run on FreeBSD OS by a famous MySQL (IT) spec — Jeremy Zawodny .
Anyone who has to do frequent MySQL administration tasks, should already heard Zawodny's name.
For those who haven't, Jeremy used to be a head database administrators and developer in Yahoo! Inc. some few years ago.
His website contains plenty of interesting thoughts and writtings on MySQL server and database management
 

How to add a new MySQL user to have INSERT,UPDATE,DELETE permissions to a Database

Tuesday, October 25th, 2011

I needed to add a newly created MySQL user with no access to any database with no special permissions (user is created from phpmyadmin) with some permissions to a specific database which is used for the operation of a website, here are the MySQL CLI client commands I issued to make it work:

# mysql -u root -p
mysql> GRANT ALL ON Sql_User_DB.* TO Sql_User@localhost;
mysql> FLUSH PRIVILEGES;

Where in the Example Sql_User_DB is my example database to which the user is granted access and my sample user is Sql_User .
Note that without FLUSH PRIVILEGES; new privileges might not be active. 

To test further if all is fine login with Sql_User and try to list database tables.

$ mysql -u Sql_User -p
password:
mysql> USE Sql_User_DB;
mysql> SHOW TABLES;
...

How to manually disable Windows Genuine Advantage on Windows XP SP2

Wednesday, May 25th, 2011

WGA Notification message popup message

I have a pirate version of Windows XP Pro 2 installer CD which does automatically turn on Windows Genuine Advantage

This is kind of annoying as the computer gets really slow and the hard disk drive activite gets intensive as well as an annoying popup message that the Windows XP copy is not genuine does appear periodically

In order to get rid of the message I had to do the following steps:

1. Get into Windows Safe Mode without Networking

As most of the people knows this is achieved by pressing F8 keyboard key right before the Windows bootup screen appears.

After in Safe mode it’s necessery to,

2. Run Windows Command Line (cmd.exe)

To do so follow, the menus:

Windows (Start Menu) -> Run -> cmd.exe

3. In the command prompt window issue the commands:

C:Documents and SettingsUser> cd WindowsSystem32
C:WindowsSystem32> taskkill -IM wgatray.exe
C:WindowsSystem32> del wgatray.exe
C:WindowsSystem32> move wgalogon.dll wgalogon.dll.old
C:WindowsSystem32> del wgalogon.dll.old

Something to mention is you have to be really quick, with deleting wgalogon.dll, cause wgatray.exe is scheduled to run every 1 / 2 seconds 🙂 It is a bit of situation of type “be quick or be dead” as Maiden used to sing 🙂
A Windows system restart and Hooray the Windows Genuine message is gone 🙂

How to check MASTER / SLAVE MySQL nodes status – Check MySQL Replication Status

Thursday, April 19th, 2012

I'm doing replication for one server. Its not the first time I do configure replication between two MySQL database nodes, however since I haven't done it for a few years, my "know how" has mostly vanished so I had some troubles in setting it up. Once I followed some steps to configure replication I had to check if the two MASTER / Slave MySQL db nodes communicate properly. Hence I decided to drop a short post on that just in case if someone has to do the same or if I myself forget how I did it so I can check later on:

1. Check if MASTER MySQL server node is configured properly

The standard way to check a MySQL master node status info is with:
 

mysql> show master status;
+——————+———-+———————————————————+——————+
| File | Position | Binlog_Do_DB | Binlog_Ignore_DB |
+——————+———-+———————————————————+——————+
| mysql-bin.000007 | 106 | database1,database2,database3 | |
+——————+———-+———————————————————+——————+
1 row in set (0.00 sec)

By putting \G some extra status info is provided:
 

mysql> show master status\G;
*************************** 1. row ***************************
File: mysql-bin.000007
Position: 106
Binlog_Do_DB: database1,database2,database3
Binlog_Ignore_DB:
1 row in set (0.00 sec)

ERROR:
No query specified

2. Check if Slave MySQL node is configured properly

To check status of the slave the cmd is:
 

mysql> show slave status;

The command returns an output like:
 

mysql> show slave status;+———————————-+————-+————-+————-+—————+——————+———————+————————-+—————+———————–+——————+——————-+——————————————————-+———————+——————–+————————+————————-+—————————–+————+————+————–+———————+—————–+—————–+—————-+—————+——————–+——————–+——————–+—————–+——————-+—————-+———————–+——————————-+—————+—————+—————-+—————-+| Slave_IO_State | Master_Host | Master_User | Master_Port | Connect_Retry | Master_Log_File | Read_Master_Log_Pos | Relay_Log_File | Relay_Log_Pos | Relay_Master_Log_File | Slave_IO_Running | Slave_SQL_Running | Replicate_Do_DB | Replicate_Ignore_DB | Replicate_Do_Table | Replicate_Ignore_Table | Replicate_Wild_Do_Table | Replicate_Wild_Ignore_Table | Last_Errno | Last_Error | Skip_Counter | Exec_Master_Log_Pos | Relay_Log_Space | Until_Condition | Until_Log_File | Until_Log_Pos | Master_SSL_Allowed | Master_SSL_CA_File | Master_SSL_CA_Path | Master_SSL_Cert | Master_SSL_Cipher | Master_SSL_Key | Seconds_Behind_Master | Master_SSL_Verify_Server_Cert | Last_IO_Errno | Last_IO_Error | Last_SQL_Errno | Last_SQL_Error |+———————————-+————-+————-+————-+—————+——————+———————+————————-+—————+———————–+——————+——————-+——————————————————-+———————+——————–+————————+————————-+—————————–+————+————+————–+———————+—————–+—————–+—————-+—————+——————–+——————–+——————–+—————–+——————-+—————-+———————–+——————————-+—————+—————+—————-+—————-+| Waiting for master to send event | HOST_NAME.COM | slave_user | 3306 | 10 | mysql-bin.000007 | 106 | mysqld-relay-bin.000002 | 251 | mysql-bin.000007 | Yes | Yes | database1,database2,database3 | | | | | | 0 | | 0 | 106 | 407 | None | | 0 | No | | | | | | 0 | No | 0 | | 0 | |+———————————-+————-+————-+————-+—————+——————+———————+————————-+—————+———————–+——————+——————-+——————————————————-+———————+——————–+————————+————————-+—————————–+————+————+————–+———————+—————–+—————–+—————-+—————+——————–+——————–+——————–+—————–+——————-+—————-+———————–+——————————-+—————+—————+—————-+—————-+

As you can see the output is not too readable, as there are too many columns and data to be displayed and this doesn't fit neither a text console nor a graphical terminal emulator.

To get more readable (more verbose) status for the SQL SLAVE, its better to use command:
 

mysql> show slave status\G;

Here is a sample returned output:
 

mysql> show slave status\G;*************************** 1. row *************************** Slave_IO_State: Waiting for master to send event Master_Host: HOST_NAME.COM Master_User: slave_user Master_Port: 3306 Connect_Retry: 10 Master_Log_File: mysql-bin.000007 Read_Master_Log_Pos: 106 Relay_Log_File: mysqld-relay-bin.000002 Relay_Log_Pos: 251 Relay_Master_Log_File: mysql-bin.000007 Slave_IO_Running: Yes Slave_SQL_Running: Yes Replicate_Do_DB: database1,database2,database3 Replicate_Ignore_DB: Replicate_Do_Table: Replicate_Ignore_Table: Replicate_Wild_Do_Table: Replicate_Wild_Ignore_Table: Last_Errno: 0 Last_Error: Skip_Counter: 0 Exec_Master_Log_Pos: 106 Relay_Log_Space: 407 Until_Condition: None Until_Log_File: Until_Log_Pos: 0 Master_SSL_Allowed: No Master_SSL_CA_File: Master_SSL_CA_Path: Master_SSL_Cert: Master_SSL_Cipher: Master_SSL_Key: Seconds_Behind_Master: 0Master_SSL_Verify_Server_Cert: No Last_IO_Errno: 0 Last_IO_Error: Last_SQL_Errno: 0 Last_SQL_Error: 1 row in set (0.00 sec)ERROR: No query specified

If show master status or shwo slave status commands didn't reveal replication issue, one needs to stare at the mysql log for more info.

Tiny PHP script to dump your browser set HTTP headers (useful in debugging)

Friday, March 30th, 2012

While browsing I stumbled upon a nice blog article

Dumping HTTP headers

The arcitle, points at few ways to DUMP the HTTP headers obtained from user browser.
As I'm not proficient with Ruby, Java and AOL Server what catched my attention is a tiny php for loop, which loops through all the HTTP_* browser set variables and prints them out. Here is the PHP script code:

<?php<br />
foreach($_SERVER as $h=>$v)<br />
if(ereg('HTTP_(.+)',$h,$hp))<br />
echo "<li>$h = $v</li>\n";<br />
header('Content-type: text/html');<br />
?>

The script is pretty easy to use, just place it in a directory on a WebServer capable of executing php and save it under a name like:
show_HTTP_headers.php

If you don't want to bother copy pasting above code, you can also download the dump_HTTP_headers.php script here , rename the dump_HTTP_headers.php.txt to dump_HTTP_headers.php and you're ready to go.

Follow to the respective url to exec the script. I've installed the script on my webserver, so if you are curious of the output the script will be returning check your own browser HTTP set values by clicking here.
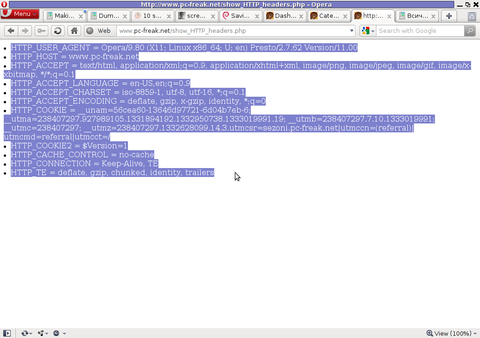
PHP will produce output like the one in the screenshot you see below, the shot is taken from my Opera browser:

Screenshot show HTTP headers.php script Opera Debian Linux

Another sample of the text output the script produce whilst invoked in my Epiphany GNOME browser is:

HTTP_HOST = www.pc-freak.net
HTTP_USER_AGENT = Mozilla/5.0 (X11; U; Linux x86_64; en-us) AppleWebKit/531.2+ (KHTML, like Gecko) Version/5.0 Safari/531.2+ Debian/squeeze (2.30.6-1) Epiphany/2.30.6
HTTP_ACCEPT = application/xml,application/xhtml+xml,text/html;q=0.9,text/plain;q=0.8,image/png,*/*;q=0.5
HTTP_ACCEPT_ENCODING = gzip
HTTP_ACCEPT_LANGUAGE = en-us, en;q=0.90
HTTP_COOKIE = __qca=P0-2141911651-1294433424320;
__utma_a2a=8614995036.1305562814.1274005888.1319809825.1320152237.2021;wooMeta=MzMxJjMyOCY1NTcmODU1MDMmMTMwODQyNDA1MDUyNCYxMzI4MjcwNjk0ODc0JiYxMDAmJjImJiYm; 3ec0a0ded7adebfeauth=22770a75911b9fb92360ec8b9cf586c9;
__unam=56cea60-12ed86f16c4-3ee02a99-3019;
__utma=238407297.1677217909.1260789806.1333014220.1333023753.1606;
__utmb=238407297.1.10.1333023754; __utmc=238407297;
__utmz=238407297.1332444980.1586.413.utmcsr=www.pc-freak.net|utmccn=(referral)|utmcmd=referral|utmcct=/blog/

You see the script returns, plenty of useful information for debugging purposes:
HTTP_HOST – Virtual Host Webserver name
HTTP_USER_AGENT – The browser exact type useragent returnedHTTP_ACCEPT – the type of MIME applications accepted by the WebServerHTTP_ACCEPT_LANGUAGE – The language types the browser has support for
HTTP_ACCEPT_ENCODING – This PHP variable is usually set to gzip or deflate by the browser if the browser has support for webserver returned content gzipping.
If HTTP_ACCEPT_ENCODING is there, then this means remote webserver is configured to return its HTML and static files in gzipped form.
HTTP_COOKIE – Information about browser cookies, this info can be used for XSS attacks etc. 🙂
HTTP_COOKIE also contains the referrar which in the above case is:
__utmz=238407297.1332444980.1586.413.utmcsr=www.pc-freak.net|utmccn=(referral)
The Cookie information HTTP var also contains information of the exact link referrar:
|utmcmd=referral|utmcct=/blog/

For the sake of comparison show_HTTP_headers.php script output from elinks text browser is like so:

* HTTP_HOST = www.pc-freak.net
* HTTP_USER_AGENT = Links (2.3pre1; Linux 2.6.32-5-amd64 x86_64; 143x42)
* HTTP_ACCEPT = */*
* HTTP_ACCEPT_ENCODING = gzip,deflate * HTTP_ACCEPT_CHARSET = us-ascii, ISO-8859-1, ISO-8859-2, ISO-8859-3, ISO-8859-4, ISO-8859-5, ISO-8859-6, ISO-8859-7, ISO-8859-8, ISO-8859-9, ISO-8859-10, ISO-8859-13, ISO-8859-14, ISO-8859-15, ISO-8859-16, windows-1250, windows-1251, windows-1252, windows-1256,
windows-1257, cp437, cp737, cp850, cp852, cp866, x-cp866-u, x-mac, x-mac-ce, x-kam-cs, koi8-r, koi8-u, koi8-ru, TCVN-5712, VISCII,utf-8 * HTTP_ACCEPT_LANGUAGE = en,*;q=0.1
* HTTP_CONNECTION = keep-alive
One good reason, why it is good to give this script a run is cause it can help you reveal problems with HTTP headers impoperly set cookies, language encoding problems, security holes etc. Also the script is a good example, for starters in learning PHP programming.


Check and Restart Apache if it is malfunctioning (not returning HTML content) shell script

Monday, March 19th, 2012

Check and Restart Apache Webserver on Malfunction, Apache feather logo

One of the company Debian Lenny 5.0 Webservers, where I'm working as sys admin sometimes stops to properly server HTTP requests.
Whenever this oddity happens, the Apache server seems to be running okay but it is not failing to return requested content

I can see the webserver listens on port 80 and establishing connections to remote hosts – the apache processes show normally as I can see in netstat …:

apache:~# netstat -enp 80
Active Internet connections (w/o servers)
Proto Recv-Q Send-Q Local Address Foreign Address State User Inode PID/Program name
tcp 0 0 xxx.xxx.xxx.xx:80 46.253.9.36:5665 SYN_RECV 0 0 -
tcp 0 0 xxx.xxx.xxx.xx:80 78.157.26.24:5933 SYN_RECV 0 0 -
...

Also the apache forked child processes show normally in process list:

apache:~# ps axuwwf|grep -i apache
root 46748 0.0 0.0 112300 872 pts/1 S+ 18:07 0:00 \_ grep -i apache
root 42530 0.0 0.1 217392 6636 ? Ss Mar14 0:39 /usr/sbin/apache2 -k start
www-data 42535 0.0 0.0 147876 1488 ? S Mar14 0:01 \_ /usr/sbin/apache2 -k start
root 28747 0.0 0.1 218180 4792 ? Sl Mar14 0:00 \_ /usr/sbin/apache2 -k start
www-data 31787 0.0 0.1 219156 5832 ? S Mar14 0:00 | \_ /usr/sbin/apache2 -k start

In spite of that, in any client browser to any of the Apache (Virtual hosts) websites, there is no HTML content returned…
This weird problem continues until the Apache webserver is retarted.
Once webserver is restarted everything is back to normal.
I use Apache Check Apache shell script set on few remote hosts to regularly check with nmap if port 80 (www) of my server is open and responding, anyways this script just checks if the open and reachable and thus using it was unable to detect Apache wasn't able to return back HTML content.
To work around the malfunctions I wrote tiny script – retart_apache_if_empty_content_is_returned.sh

The scripts idea is very simple;
A request is made a remote defined host with lynx text browser, then the output of lines is counted, if the output returned by lynx -dump http://someurl.com is less than the number returned whether normally invoked, then the script triggers an apache init script restart.

I've set the script to periodically run in a cron job, every 5 minutes each hour.
# check if apache returns empty content with lynx and if yes restart and log it
*/5 * * * * /usr/sbin/restart_apache_if_empty_content.sh >/dev/null 2>&1

This is not perfect as sometimes still, there will be few minutes downtime, but at least the downside will not be few hours until I am informed ssh to the server and restart Apache manually

A quick way to download and set from cron execution my script every 5 minutes use:

apache:~# cd /usr/sbin
apache:/usr/sbin# wget -q https://www.pc-freak.net/bscscr/restart_apache_if_empty_content.sh
apache:/usr/sbin# chmod +x restart_apache_if_empty_content.sh
apache:/usr/sbin# crontab -l > /tmp/file; echo '*/5 * * * *' /usr/sbin/restart_apache_if_empty_content.sh 2>&1 >/dev/null


The day, Today

Tuesday, May 20th, 2008

The day started a bit normal. I did my morning excercise, then I prayed. I spoke with Dzemil (A macedonian colleague of mine) and we set up a meeting for 12:30, I ate. I received few calls from the office with requests to do few little things. At 12:30 I met Dzemil at the College restaurant. We spend some time talking with him and another turkish colleague. Then we went to speak with Bozhidar Bozhkov about the applications for Holland, what is the procedure of transfering from the college here to Arnhem Business School etc. Laters I went home and did some work on the servers and red and did my fourth cisco test. I went to my cousin and after that went to Javor, we went out with Ina and Javor for a coffee to Kukla. Afterwards I went home and played with Dynamips. For all that wonder what the hack Dynamips is. Well Dynamics is a Cisco emulator just like VMWare is an OS emulator with the exception that Dynamics is builded to run only Cisco’s IOS. I found that nice Video tutorial Cisco Router Emulation Software Dynamips Video Tutorial, check it out here Here . Since I needed a Cisco IOS image and I’m not a Cisco customer I used torrents to download a collection of Cisco ISO’s and used one of the isos to make it work on my Windows Vista. I have problems running it because of lack of permissions, caused by the famous UAC ( User Access Control ). The solution for me was to use a privileged command prompt and start, both the Dynamips sever and my custom configured simple1.net which connected to the server and loaded the cisco image. There is also a very nice and extended tutorial on the topic of Dynamips it’s located Here . Alto today tested the previously installed Wireshark. Wireshark is a very nice substitute for iptraf for windows it has a nice and easy to use graphical interface, supports capturing and has lot of traffic analysis possibilities I strongly recommend it to anyone coming from a Linux/BSD background like me and searching for a nice Windows substitute for iptraf. Check out wireshark on the following URL . Now I’m going to change the topic and say a few words for my spiritual state. Today it was a hard day. I was tempted by the devil to think bad thoughts and did sinned for which I search forgiveness. Life it so hard I realize it more and more day by day. Very often old spirits which tormented me for a long time are trying to come back. I haven’t smoked today also and again thanks for that should fly to God who delived me from this terrible vice. As a conclusion I should say that for everything I should thanks to God and pray for him to forgive my unfaithfulness. END—–