As a WordPress blog owner and an sys admin that has to deal with servers running a lot of WordPress / Joomla / Droopal and other custom CMS installed on servers, performoing slow or big enough to put a significant load on servers and I love efficiency and hardware cost saving is essential for my daily job, I'm constantly trying to find new ways to optimize Customer Website (WordPress) and rest of sites in order to utilize better our servers and improve our clients sites speed (and hence satisfaction).
There is plenty of little things to do on servers but probably among the most crucial ones which we use nowadays that save us a lot of money is tmpfs, and earlier (ramfs) – previously known as shmfs).
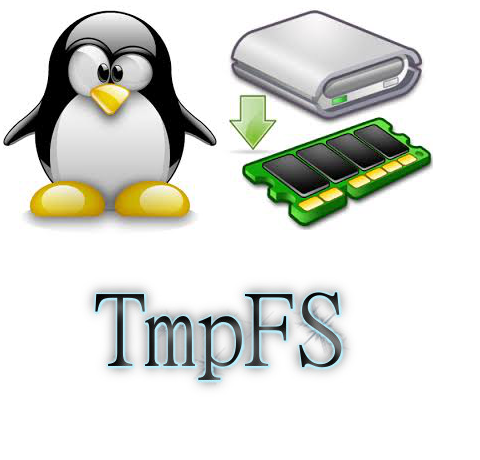
TMPFS is a (Temporary File Storage Facility) Linux kernel technology based on ramfs (used by Linux kernel initrd / initramfs on boot time in order to load and store the Linux kernel in memory, before system hard disk partition file systems are mounted) which is heavily used by virtually all modern popular Linux distributions.
Using ramfs (cramfs variation – Compressed ROM filesystem) has been used to store different system environment kernel and Desktop components of many Linux environment / applications and used by a lot of the Linux BootCD such as the most famous (Klaus Knopper's) KNOPPIX LiveCD and Trinity Rescue Kit Linux (TRK uses /dev/shm which btw can be seen on most modern Linux distros and is actually just another mounted tmpfs).
If you haven't tried Live Linux yet try it out as me and a lot of sysadmins out there use some kind of LiveLinux at least few times on yearly basis to Recover Unbootable Linux servers after some applied remote Updates as well as for Rescuing (Save) Data from Linux server failing to properly boot because of hard disk (bad blocks) failures. As I said earlier TMPFS is also used on almost any distribution for the /dev/ filesystem which is kept in memory.
You can see which tmpfs partitions is used on your Linux server with:
debian-server:~# mount |grep -i tmpfs
tmpfs on /lib/init/rw type tmpfs (rw,nosuid,mode=0755)
udev on /dev type tmpfs (rw,mode=0755)
tmpfs on /dev/shm type tmpfs (rw,nosuid,nodev)
Above is an output from a standard Debian Linux server. On CentOS 7 standard mounted tmpfs are as follows:
[root@centos ~]# mount |grep -i tmpfs
devtmpfs on /dev type devtmpfs (rw,nosuid,seclabel,size=1016332k,nr_inodes=254083,mode=755)
tmpfs on /dev/shm type tmpfs (rw,nosuid,nodev,seclabel)
tmpfs on /run type tmpfs (rw,nosuid,nodev,seclabel,mode=755)
tmpfs on /sys/fs/cgroup type tmpfs (rw,nosuid,nodev,noexec,seclabel,mode=755)
[root@centos ~]# df -h|grep -i tmpfs
devtmpfs 993M 0 993M 0% /dev
tmpfs 1002M 92K 1002M 1% /dev/shm
tmpfs 1002M 8.8M 993M 1% /run
tmpfs 1002M 0 1002M 0% /sys/fs/cgroup
The /run tmpfs mounted directory is also to be seen also on latest Ubuntus and Fedoras and is actually the good old /var/run ( where applications keep there pids and some small app related files) stored in tmpfs filesystem stored in memory.
If you're wondering what is /dev/shm and why it appears mounted on every single Linux Server / Desktop you've ever used this is a special filesystem shared memory which various running programs (processes) can use to transfer data quick and efficient between each other to preven the slow disk swapping. People using Linux for the rest 15 years should remember /dev/shm has been a target of a lot of kernel exploits as historically it had a lot of security issues.
While writting this article I've just checked about KNOPPIX developed amd just for info as of time of writting this distro has already 1000+ programs on CD version and 2600+ packages / application on DVD version.
Nowadays Knoppix is mostly used mostly as USB Live Flash drive as a lot of people are dropping CD / DVD use (many servers doesn't have a CD / DVD Drive) and for USB Live Flash Linux distros tmpfs is also key technology used as this gives the end user an amazing fast experience (Desktop applications run much fasten on Live USBs when tmpfs is used than when the slow 7200 RPM HDDs are used).
Loading big parts of the distribution within RAM (with tmpfs from Linux Kernel 2.4+ onwards) is also heavily used by a lot of Cluster vendors in most of Clustered (Cloud) Linux based environemnts, cause TMPFS gives often speeds up improvements to x30 times and decreases greatly I/O HDD. FreeBSD users will be happy to know that TMPFS is already ported and could be used on from FreeBSD 7.0+ onward.
In this small article I will give you example use on how I use tmpfs to speed up our WordPress Websites which use WP Caching plugins such as W3 Total Cache and WP Super Cache
and Hyper Cache / WP Super Cache disk caching and MySQL server as a Database backend. Below example is wordpress specific but since it can be easily applied to Joomla, Drupal or any other CMS out there that uses mySQL server to make a lot of CPU expensive memory hungry (LEFT JOIN) queries which end up using a slow 7200 RPM hard disk.
1. Preparing tmpfs partitions for WordPress File Cache directory
If you want to give tmpfs a test drive, I recommend you try to create / mount a 20 Megabyte partition. To create a tmpfs partition you don't need to use a tool like mkfs.ext3 / mkfs.ext4 as TMPFS is in reality a virtual filesystem that is mapped in the server system physical RAM (volatile memory). TMPFS is very nice because if you run out of free RAM system starts a combination of RAM use + some Hard disk SWAP
The great thing about TMPFS is it never uses all of the available RAM and SWAP, which would not halt your server if TMPFS partition gets filled, but instead you will start getting the usual "Insufficient Disk Space", just like with a physical HDD parititon. RAMFS cares much less about server compared to TMPFS, because if RAMFS is historically older.
ramfs file systems cannot be limited in size like a disk base file system which is limited by it’s capacity, thus ramfs will continue using memory storage until the system runs out of RAM and likely crashes or becomes unresponsive. This is a problem if the application writing to the file system cannot be limited in total size, so in my opinion you better stay away from RAMFS except you have a good idea what you're doing. Another disadvantage of RAMFS compared to TMPFS is you cannot see the size of the file system in df and it can only be estimated by looking at the cached entry in free.
Note that before proceeding to use TMPFS or RAMFS you should know besides having advantages, there are certain serious disadvantage that if the server using tmpfs (in RAM) to store files crashes the customer might loose his data, therefore using RAM filesystems on Production servers is best to be used just for caching folders which are regularly synchronized with (rsync) to some folder to assure no data will be lost on server reboot or crash.
Memory of fast storage areas are ideally suited for applications which need repetitively small data areas for caching or using as temporary space such as Jira (Issue and Proejct Tracking Software) Indexing As the data is lost when the machine reboots the tmpfs stored data must not be data of high importance as even scheduling backups cannot guarantee that all the data will be replicated in the even of a system crash.
To test mounting a tmpfs virtual (memory stored) filesystem issue:
mount -t tmpfs tmpfs -o size=256m /mnt/tmpfs
If you want to test mount a ramfs instead:
mount -t ramfs -o size=256m ramfs /mnt/ramfs
debian-server:~# mount |grep -i -E "ramfs|tmpfs"
tmpfs on /lib/init/rw type tmpfs (rw,nosuid,mode=0755)
udev on /dev type tmpfs (rw,mode=0755)
tmpfs on /dev/shm type tmpfs (rw,nosuid,nodev)
tmpfs on /mnt/tmpfs type tmpfs (rw,size=256m)
ramfs on /mnt/ramfs type tmpfs (rw,size=256m)
Once mounted tmpfs can be used in the same way as any ext4 / reiserfs filesystem. In the same way to make mounts permanent, its necessery to add a line to /etc/fstab
To illustrate better a tmpfs use case on my blog running WordPress with W3TotalCache (W3TC) plugin cache folder in /var/www/blog/wp-content/w3tc to get advantage of tmpfs to store w3tc files.
a) Stop Apache
On Debian
debian-server:~# /etc/init.d/apache stop
On CentOS
[root@centos ~]# /etc/init.d/httpd stop
b) Move w3tc dir to w3tc-bak
debian-server:~# cd /var/www/blog/wp-content/
debian-server:~# mv w3tc w3tc-bak
c) Create w3tc directory
debian-server:/var/www/blog/wp-content# mkdir w3tc
debian-server:/var/www/blog/wp-content# chown -R www-data:www-data w3tc
d) Add tmpfs record to /etc/fstab
My W3TC Cache didn't grow bigger than 2Gigabytes so I create a 2Giga directory for it by adding following in /etc/fstab
debian-server:~# vim /etc/fstab
tmpfs /var/www/blog/wp-content/w3tc tmpfs defaults,size=2g,noexec,nosuid,uid=33,gid=33,mode=1755 0 0
You might also want to add the nr_inodes (option) to tmpfs while mounting. nr_inodes is the maximum inode for instance. Default is half the number of your physical RAM pages, (on a machine with highmem) the number of lowmem RAM page, some common option that should work is nr_inodes=5k, if you're unsure what this option does you can safely skip it 🙂
e) Mount new added tmpfs folder
Then to mount the newly added filesystem issue:
mount -a
Or if you're on a CentOS / RHEL server use httpd Apache user instead and whenever you have docroot and wordpress installed.
[root@centos ~]# chown -R apache:apache: w3tc
If you're using Apache SuPHP use whatever the UID / GID is proper.
On CentOS you will need to set proper UID and GID (UserID / GroupID), to find out which ones to to use check in /etc/passwd:
[root@centos ~]# grep -i apache /etc/passwd
apache:x:48:48:Apache:/var/www:/sbin/nologin
f) Move old w3tc cache from w3tc-bak to w3tc
debian-server:/var/www/blog/wp-content# mv w3tc-bak/* w3tc/
g) Start again Apache
On Debian:
debian-server:~# /etc/init.d/apache2 start
On CentOS:
[root@centos~]# /etc/init.d/httpd start
h) Keeping w3tc cache site folder synced
As I said earlier the biggest problem with caching (the reason why many hosting providers) and site admins refuse to use it is they might loose some data, to prevent data loss or at least mitigate the data loss to few minutes intervals it is a good idea to synchronize tmpfs kept folders somewhere to disk with rsync.
To achieve that use a cronjob like this:
debian-server:~# crontab -u root -e
*/5 * * * * /usr/bin/ionice -c3 -n7 /usr/bin/nice -n 19 /usr/bin/rsync -ah –stats –delete /var/www/blog/wp-content/w3tc/ /backups/tmpfs/cache/ 1>/dev/null
Note that you will need to have the /backups/tmpfs/cache folder existing, create it with:
debian-server:~# mkdir -p /backups/tmpfs/cache
You will also need to add a rsync synchronization from backupped folder to tmpfs (in case if the server gets accidently rebooted because it hanged or power outage), place in
/etc/rc.local
ionice -c3 -n7 nice -n 19 rsync -ahv –stats –delete /backups/tmpfs/cache/ /var/www/blog/wp-content/w3tc/ 1>/dev/null
(somewhere before exit 0) line
0 05 * * * /usr/bin/ionice -c3 -n7 /bin/nice -n 19 /usr/bin/rsync -ah –stats –delete /var/www/blog/wp-content/w3tc/ /backups/tmpfs/cache/ 1>/dev/null
2. Preparing tmpfs partitions for MySQL server temp File Cache directory
Its common that MySQL servers had to serve a lot of long and heavy SQL JOIN Queries mostly by related posts WP plugins such as (Zemanta Related Posts) and Contextual Related posts though MySQLs are well optimized to work as much as efficient using mysql tuner (tuning primer) still often SQL servers get a lot of temp tables created to disk (about 25% to 30%) of all SQL queries use somehow HDD to serve queries and as this is very slow and there is file lock created the overall MySQL performance becomes sluggish at times to fix (resolve) that without playing with SQL code to optimize the slow queries the best way I found is by using TMPFS as MySQL temp folder.
To do so I create a TMPFS usually the size of 256 MB because this is usually enough for us, but other hosting companies might want to add bigger virtual temp disk:
a) Add tmpfs new dir to /etc/fstab
In /etc/fstab add below record with vim editor:
debian-server:~# vim /etc/fstab
tmpfs /var/mysqltmp tmpfs rw,gid=111,uid=108,size=256M,nr_inodes=10k,mode=0700 0 0
Note that the uid / and gid 105 and 114 are taken again from /etc/passwd
On Debian
debian-server:~# grep -i mysql /etc/passwd
mysql:x:108:111:MySQL Server,,,:/var/lib/mysql:/bin/false
On CentOS
[root@centos ~]# grep -i mysql /etc/passwd
mysql:x:27:27:MySQL Server:/var/lib/mysql:/bin/bash
b) Create folder /var/mysqltmp or whenever you want to place the tmpfs memory kept SQL folder
debian-server:~# mkdir /var/mysqltmp
debian-server:~# chown mysql:mysql /var/mysqltmp
debian-server:~# mount|grep -i tmpfs
tmpfs on /lib/init/rw type tmpfs (rw,nosuid,mode=0755)
udev on /dev type tmpfs (rw,mode=0755)
tmpfs on /dev/shm type tmpfs (rw,nosuid,nodev)
tmpfs on /var/www/blog/wp-content/w3tc type tmpfs (rw,noexec,nosuid,size=2g,uid=33,gid=33,mode=1755)
tmpfs on /var/mysqltmp type tmpfs (rw,gid=108,uid=111,size=256M,nr_inodes=10k,mode=0700)
c) Add new path to tmpfs created folder in my.cnf
Then edit /etc/mysql/my.cnf
debian-server:~# vim /etc/mysql/my.cnf
[mysqld]
#
# * Basic Settings
#
user = mysql
pid-file = /var/run/mysqld/mysqld.pid
socket = /var/run/mysqld/mysqld.sock
port = 3306
basedir = /usr
datadir = /var/lib/mysql
tmpdir = /var/mysqltmp
On CentOS edit and change tmpdir in same way within /etc/my.cnf
d) Finally Restart Apache and MySQL to make mysql start using new set tmpfs memory kept folder
On Debian:
debian-server:~# /etc/init.d/apache2 stop; /etc/init.d/mysql restart; /etc/init.d/apache2 start
On CentOS:
[root@centos ~]# /etc/init.d/httpd stop; /etc/init.d/mysqld restart; /etc/initd/httpd start
Now monitor your server and check your pagespeed increase for me such an optimization usually improves site performance so site becomes +50% faster, to see the difference you can test your website before applying tmpfs caching for site and after that by using Google PageInsight (PageSpeed) Online Test. Though this example is for MySQL and WordPress you can easily adopt the same for Joomla if you have Joomla Caching enabled to some folder, same goes for any other CMS such as Drupal that can take use of Disk Caching. Actually its a small secret of many Hosting providers that allow clients to create sites via CPanel and Kloxo this tmpfs optimizations are already used for sites and by this the provider is able to offer better website service on lower prices. VPS hosting providers also use heavy caching. A lot of people are using TMPFS also to accelerate Sites that have enabled Google Pagespeed as Cacher and accelerator, as PageSpeed module puts a heavy HDD I/O load that can easily stone the server. Many admins also choose to use TMPFS for /tmp, /var/run, and /var/lock directories as this leads often to significant overall server services operations improvement.
Once you have tmpfs enabled, It is a good idea to periodically monitor your SWAP used space with (df -h), because if you allocate bigger tmpfs partitions than your physical memory and tmpfs's full size starts to be used your machine will start swapping heavily and this could have a very negative performance affect.
debian-server:~# df -h|grep -i tmpfs
tmpfs 3,9G 0 3,9G 0% /lib/init/rw
tmpfs 3,9G 0 3,9G 0% /dev/shm
tmpfs 2,0G 1,4G 712M 66% /var/www/blog/wp-content/w3tc
tmpfs 256M 0 256M 0% /mnt/tmpfs
tmpfs 256M 236K 256M 1% /var/mysqltmp
The applications of tmpfs to accelerate services is up to your imagination, so I will be glad to hear from other admins on any interesting other application or problems faced while using TMPFS.
Enjoy! 🙂
![]()
