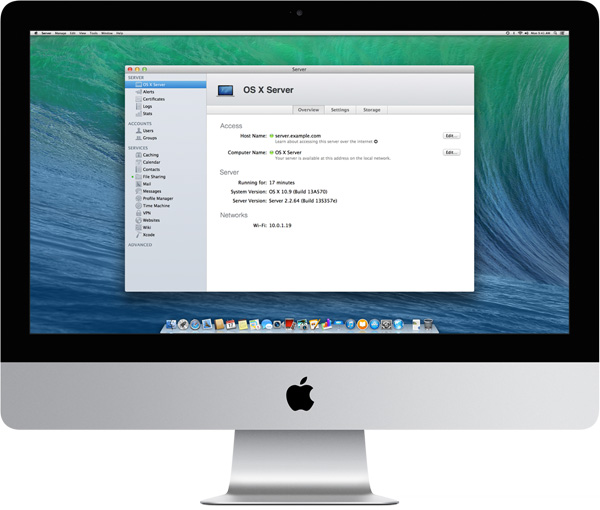
You might be stunned to find out Mac OS X has a server variant called Mac OS X server. For the usual admin having to administer a Mac OS X based server is something rarely to do, however it might happen some day, and besides that nowadays Mac OS X has about 10% percentage share of PC desktop and laptops used on the Internet (data collected from w3cschools log files). Thus cause it is among popular OSes, it very possible sooner or later as a sysadmin you will have to troubleshoot issues on at least Mac OS X notebook. Mac has plenty of instruments to debug OS issues as it is UNIX (BSD) based.
Mac OS X has already a GUI tool called Activity Monitor (existing in Mac OS 10.3 onwards) in earlier verions, there was tool called Process Viewer and CPU Monitor.
To start Activity Monitor open Finder and launch it via:
Applications -> Utilities -> Activity Monitor
As a Linux guy, I like to use command line and there Mac OS X is equipped with a good arsenal of tools to check CPU load and Memory. Mac OS X comes with sar – (system activity reporter), top (process monitor) and vm_stat (virtual memory statistics) command – these ones are equivalent of Linux's sar (from sysstats package), top and Linux vmstat (report virtual memory statistics).
1. Check out Mac OS X HDD Input / Output statistics
$ sar -d -f ~/output.sar
20:43:18 device r+w/s blks/s
New Disk: [disk0] IODeviceTree:/PCI0@0/RP06@1C,5/SSD0@0/PRT0@0/PMP@0/@0:0
New Disk: [disk1] IOService:/IOResources/IOHDIXController/IOHDIXHDDriveOutKernel@1/IODiskImageBlockStorageDeviceOutKernel/IOBlockStorageDriver/Apple UDIF, только для чтения, сжатый (zlib)
New Disk: [disk2] IOService:/IOResources/IOHDIXController/IOHDIXHDDriveOutKernel@3/IODiskImageBlockStorageDeviceOutKernel/IOBlockStorageDriver/Apple UDIF, только для чтения, сжатый (bzip2)
New Disk: [disk3] IOService:/IOResources/IOHDIXController/IOHDIXHDDriveOutKernel@4/IODiskImageBlockStorageDeviceOutKernel/IOBlockStorageDriver/Apple UDIF, только для чтения, сжатый (bzip2)
New Disk: [disk4] IOService:/IOResources/IOHDIXController/IOHDIXHDDriveOutKernel@6/IODiskImageBlockStorageDeviceOutKernel/IOBlockStorageDriver/Apple UDIF, только для чтения, сжатый (zlib)
20:43:28 disk0 7 312
20:43:28 disk1 0 0
20:43:28 disk2 0 0
20:43:28 disk3 0 0
20:43:28 disk4 0 0
20:43:38 disk0 12 251
20:43:38 disk1 0
…
2. Checking Mac OS X CPU Load from terminal
To check Load from Mac OS command line use:
$ sar -o ~/output.sar 10 10
That gathers 10 sets of metrics at 10 second intervals. You can then extract useful information from the output file (even while it's still running), this will get you cpu load on Mac OS system spitting stats every 10 seconds.
21:22:33 %usr %nice %sys %idle
21:22:43 7 0 2 90
21:22:53 8 0 3 89
21:23:03 11 0 4 85
21:23:13 9 0 3 88
21:23:23 9 0 3 88
21:23:33 7 0 3 90
21:23:43 10 0 3 87
21:23:53 10 0 4 85
21:24:03 10 0 5 85
21:24:13 8 0 3 88
Average: 8 0 3 87
3. Checking Free memory on Mac OS X
Use this obscure one liner to free -m Linux memory command like output from Mac terminal
$
vm_stat | perl -ne '/page size of (d+)/ and $size=$1; /Pagess+([^:]+)[^d]+(d+)/ and printf("%-16s % 16.2f Min", "$1:", $2 * $size / 1048576);'
free: 43.38 Mi
active: 1762.00 Mi
inactive: 1676.91 Mi
speculative: 3.29 Mi
wired down: 609.38 Mi
copy-on-write: 29431.01 Mi
zero filled: 4687689.80 Mi
reactivated: 30288.86 Mi
To show inactive memory in Gigabytes every 10 seconds
$ vm_stat 10 | awk 'NR>2 {gsub("K","000");print ($1+$4)/256000}'
1.70532
1.70455
1.70389
1.6904
It is also possible to get memory statistics on Mac PC running top in non-interactive mode and grepping it from output:
$ top -l 1 | head -n 10 | grep PhysMem | sed 's/, /n /g'
PhysMem: 599M wired, 1735M active, 1712M inactive, 4046M used, 47M free.
4. Quick command to get Kernel / how many CPUs, available memory and load avarage on Mac OS X
From y. 2003 onwards of Mac OS have hostinfo – (host information) command, providing admin with quick way to get System Info on Mac OS
$ hostinfo
Mach kernel version:
Darwin Kernel Version 12.5.0: Sun Sep 29 13:33:47 PDT 2013; root:xnu-2050.48.12~1/RELEASE_X86_64
Kernel configured for up to 4 processors.
2 processors are physically available.
4 processors are logically available.
Processor type: i486 (Intel 80486)
Processors active: 0 1 2 3
Primary memory available: 4.00 gigabytes
Default processor set: 98 tasks, 621 threads, 4 processors
Load average: 1.63, Mach factor: 2.54
If you need more verbose information on system hardware and resources, check out system_profiler. As the manual describes it, system_profiler(reports system hardware and software configuration.) cmd:
$ system_profiler
Here is a link to output file generated by system_prifler
More helpful Articles

Tags: command, cpu load, information, liner, Linux, Quick, size, sysadmin, system hardware, virtual memory


Mozilla/5.0 (Macintosh; Intel Mac OS X 10.13; rv:61.0) Gecko/20100101 Firefox/61.0
Old post, but have you found a way to get sar back under high sierra?
View CommentView Comment