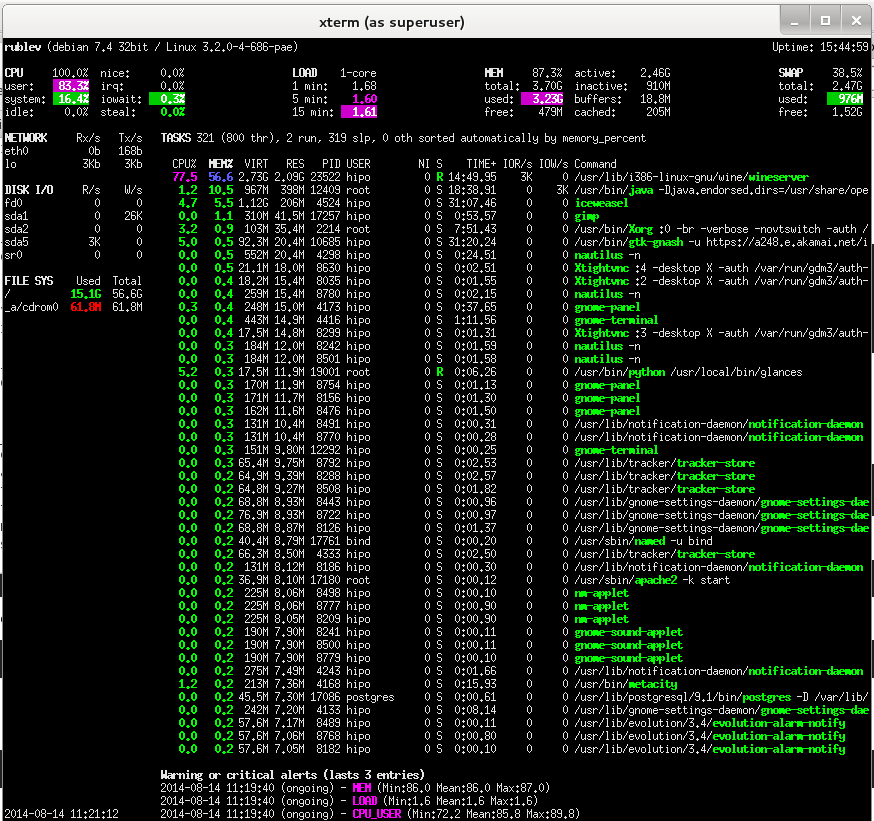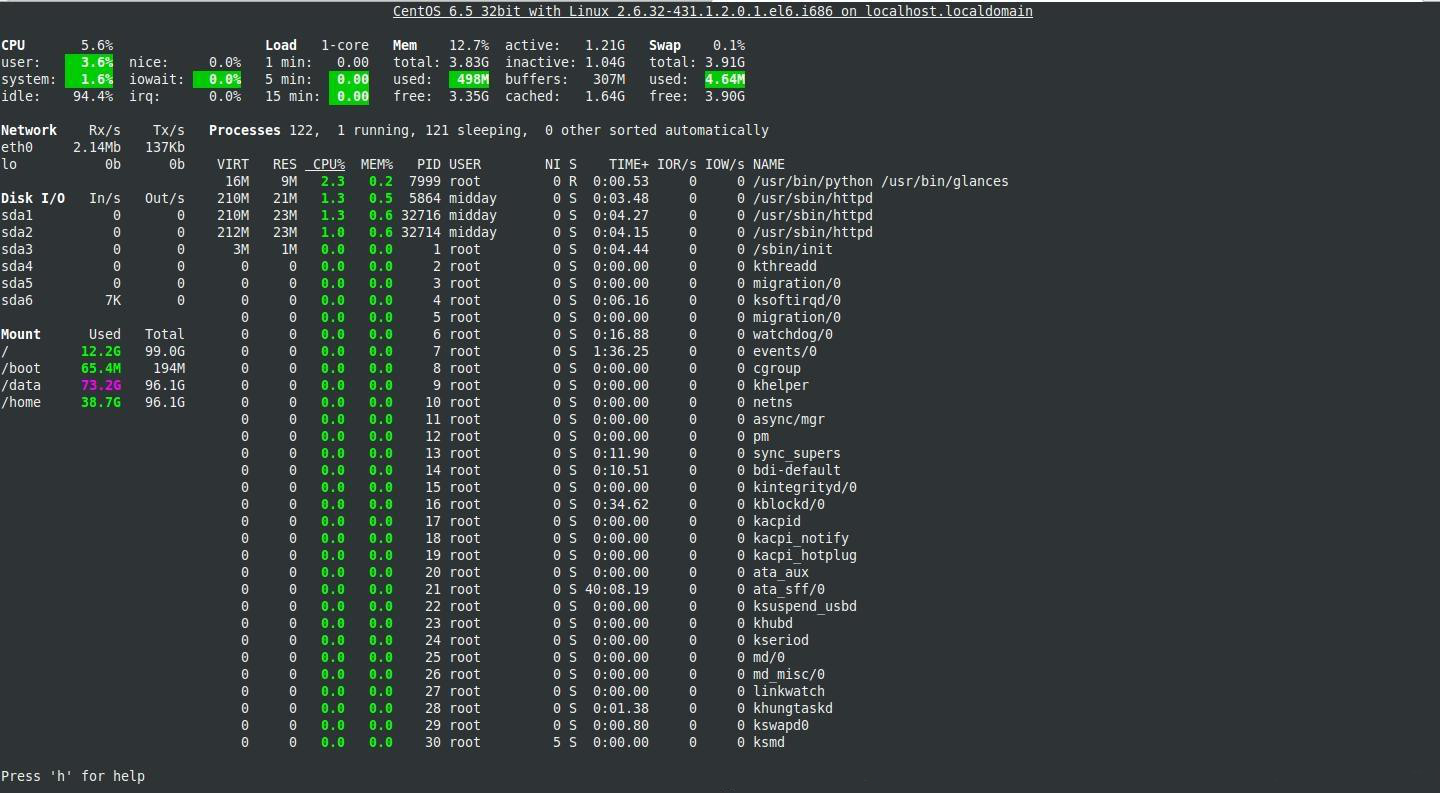
If you're Linux / UNIX / BSD system administrator you already have experience with basic admin's system monitoring:
- CPU load
- OS Name/Kernel version
- System load avarage and Uptime
- Disk and Network Input/Output I/O operations by interface
- Process statistics / Top loading processes etc.
- Memory / SWAP usage and free memory
- Mounted partitions
Such info is provided by command line tools such as:
top, df, free, sensors, ifconfig, iotop, hddtemp, mount, nfsstat, nfsiostat, dstat, uptime, nethogs iptraf
etc.
There are plenty of others advanced tools also Web based server monitoring visualization tools, such as Monit, Icanga, PHPSysInfo, Cacti which provide you statistics on computer hardware and network utilization
So far so good, if you already are used to convenience of web *NIX based monitoring but you don't want to put load on the servers with such and you're lazy to write custom scripts that show most important monitoring information – necessery for daily system administration monitoring and prevention from downtimes and tracking bottlenecks you will be glad to hear about Glances
Glances is a free (LGPL) cross-platform curses-based monitoring tool which aims to present a maximum of information in a minimum of space, ideally to fit in a classical 80×24 terminal or higher to have additionnal information. Glances can adapt dynamically the displayed information depending on the terminal size. It can also work in a client/server mode for remote monitoring.
1. Installing Glances curses-based monitoring tool on Debian 7 / Ubuntu 13+ / Mint Linux
We have to install python-pip (python package installer tool) to later install Glances
apt-get install –yes 'python-dev' 'python-jinja2' 'python-psutil'
'python-setuptools' 'hddtemp' 'python-pip' 'lm-sensors'
Before proceeding to install Glances to make Thermal sensors working (if supported by hardware) run:
sensors-detect
Glances is written in Python and uses psutil library to obtain monitoring statistic values, thus it is necessery to install few more Python libraries:
pip install 'batinfo' 'pysensors'
If you're about to use pip – Python package installer tool, behind a proxy server use instead:
pip install –proxy=http://your-proxy-host.com:8080 'batinfo' 'pysensors'
Then install Glances script itself again using pip
pip install 'Glances'
Downloading/unpacking Glances
Downloading Glances-2.0.1.tar.gz (3.3Mb): 3.3Mb downloaded
Running setup.py egg_info for package Glances
Downloading/unpacking psutil>=2.0.0 (from Glances)
Downloading psutil-2.1.1.tar.gz (216Kb): 216Kb downloaded
Running setup.py egg_info for package psutil
…
Successfully installed Glances psutil
Then run glances from terminal
glances -t 3
-t 3 option tells glances to refresh collected statistics every 3 seconds

2. Installing Glances monitoring console tool on CentOS / RHEL / Fedora / Scientific Linux
Installing glances on CentOS 7 / Fedora and rest of RPM based distributions can be done by adding external RPM repositories, cause glances is not available in default yum repositories.
To enable Extra-packages repositories:
rpm -ivh http://dl.fedoraproject.org/pub/epel/6/x86_64/epel-release-6-8.noarch.rpm
Then update yum to include new repository's packages into package list and install python-pip and python-devel rpms
yum update
yum install python-pip python-devel

There is also FreeBSD port to install Glances on FreeBSD:
cd /usr/sysutils/py-glances
make install
Enjoy 🙂 !
More helpful Articles

Tags: command line tools, information, Monitoring Disk, package, rpm, servers, system administration, terminal, update, www, yum


