Posts Tagged ‘Activate’

How to enable HaProxy logging to a separate log /var/log/haproxy.log / prevent HAProxy duplicate messages to appear in /var/log/messages

Wednesday, February 19th, 2020

haproxy-logging-basics-how-to-log-to-separate-file-prevent-duplicate-messages-haproxy-haproxy-weblogo-squares
haproxy  logging can be managed in different form the most straight forward way is to directly use /dev/log either you can configure it to use some log management service as syslog or rsyslogd for that.

If you don't use rsyslog yet to install it: 

# apt install -y rsyslog

Then to activate logging via rsyslogd we can should add either to /etc/rsyslogd.conf or create a separte file and include it via /etc/rsyslogd.conf with following content:
 

Enable haproxy logging from rsyslogd


Log haproxy messages to separate log file you can use some of the usual syslog local0 to local7 locally used descriptors inside the conf (be aware that if you try to use some wrong value like local8, local9 as a logging facility you will get with empty haproxy.log, even though the permissions of /var/log/haproxy.log are readable and owned by haproxy user.

When logging to a local Syslog service, writing to a UNIX socket can be faster than targeting the TCP loopback address. Generally, on Linux systems, a UNIX socket listening for Syslog messages is available at /dev/log because this is where the syslog() function of the GNU C library is sending messages by default. To address UNIX socket in haproxy.cfg use:

log /dev/log local2 


If you want to log into separate log each of multiple running haproxy instances with different haproxy*.cfg add to /etc/rsyslog.conf lines like:

local2.* -/var/log/haproxylog2.log
local3.* -/var/log/haproxylog3.log


One important note to make here is since rsyslogd is used for haproxy logging you need to have enabled in rsyslogd imudp and have a UDP port listener on the machine.

E.g. somewhere in rsyslog.conf or via rsyslog include file from /etc/rsyslog.d/*.conf needs to have defined following lines:

$ModLoad imudp
$UDPServerRun 514


I prefer to use external /etc/rsyslog.d/20-haproxy.conf include file that is loaded and enabled rsyslogd via /etc/rsyslog.conf:

# vim /etc/rsyslog.d/20-haproxy.conf

$ModLoad imudp
$UDPServerRun 514​
local2.* -/var/log/haproxy2.log


It is also possible to produce different haproxy log output based on the severiy to differentiate between important and less important messages, to do so you'll need to rsyslog.conf something like:
 

# Creating separate log files based on the severity
local0.* /var/log/haproxy-traffic.log
local0.notice /var/log/haproxy-admin.log


Prevent Haproxy duplicate messages to appear in /var/log/messages

If you use local2 and some default rsyslog configuration then you will end up with the messages coming from haproxy towards local2 facility producing doubled simultaneous records to both your pre-defined /var/log/haproxy.log and /var/log/messages on Proxy servers that receive few thousands of simultanous connections per second.
This is a problem since doubling the log will produce too much data and on systems with smaller /var/ partition you will quickly run out of space + this haproxy requests logging to /var/log/messages makes the file quite unreadable for normal system events which are so important to track clearly what is happening on the server daily.

To prevent the haproxy duplicate messages you need to define somewhere in rsyslogd usually /etc/rsyslog.conf local2.none near line of facilities configured to log to file:

*.info;mail.none;authpriv.none;cron.none;local2.none     /var/log/messages

This configuration should work but is more rarely used as most people prefer to have haproxy log being written not directly to /dev/log which is used by other services such as syslogd / rsyslogd.

To use /dev/log to output logs from haproxy configuration in global section use config like:
 

global
        log /dev/log local2 debug
        chroot /var/lib/haproxy
        stats socket /run/haproxy/admin.sock mode 660 level admin
        stats timeout 30s
        user haproxy
        group haproxy
        daemon

The log global directive basically says, use the log line that was set in the global section for whole config till end of file. Putting a log global directive into the defaults section is equivalent to putting it into all of the subsequent proxy sections.

Using global logging rules is the most common HAProxy setup, but you can put them directly into a frontend section instead. It can be useful to have a different logging configuration as a one-off. For example, you might want to point to a different target Syslog server, use a different logging facility, or capture different severity levels depending on the use case of the backend application. 

Insetad of using /dev/log interface that is on many distributions heavily used by systemd to store / manage and distribute logs,  many haproxy server sysadmins nowdays prefer to use rsyslogd as a default logging facility that will manage haproxy logs.
Admins prefer to use some kind of mediator service to manage log writting such as rsyslogd or syslog, the reason behind might vary but perhaps most important reason is  by using rsyslogd it is possible to write logs simultaneously locally on disk and also forward logs  to a remote Logging server  running rsyslogd service.

Logging is defined in /etc/haproxy/haproxy.cfg or the respective configuration through global section but could be also configured to do a separate logging based on each of the defined Frontend Backends or default section. 
A sample exceprt from this section looks something like:

#———————————————————————
# Global settings
#———————————————————————
global
    log         127.0.0.1 local2

    chroot      /var/lib/haproxy
    pidfile     /var/run/haproxy.pid
    maxconn     4000
    user        haproxy
    group       haproxy
    daemon

    # turn on stats unix socket
    stats socket /var/lib/haproxy/stats

#———————————————————————
defaults
    mode                    tcp
    log                     global
    option                  tcplog
    #option                  dontlognull
    #option http-server-close
    #option forwardfor       except 127.0.0.0/8
    option                  redispatch
    retries                 7
    #timeout http-request    10s
    timeout queue           10m
    timeout connect         30s
    timeout client          20m
    timeout server          10m
    #timeout http-keep-alive 10s
    timeout check           30s
    maxconn                 3000


# HAProxy Monitoring Config
#———————————————————————
listen stats 192.168.0.5:8080                #Haproxy Monitoring run on port 8080
    mode http
    option httplog
    option http-server-close
    stats enable
    stats show-legends
    stats refresh 5s
    stats uri /stats                            #URL for HAProxy monitoring
    stats realm Haproxy\ Statistics
    stats auth hproxyauser:Password___          #User and Password for login to the monitoring dashboard


#———————————————————————
# frontend which proxys to the backends
#———————————————————————
frontend ft_DKV_PROD_WLPFO
    mode tcp
    bind 192.168.233.5:30000-31050
    option tcplog
    log-format %ci:%cp\ [%t]\ %ft\ %b/%s\ %Tw/%Tc/%Tt\ %B\ %ts\ %ac/%fc/%bc/%sc/%rc\ %sq/%bq
    default_backend Default_Bakend_Name


#———————————————————————
# round robin balancing between the various backends
#———————————————————————
backend bk_DKV_PROD_WLPFO
    mode tcp
    # (0) Load Balancing Method.
    balance source
    # (4) Peer Sync: a sticky session is a session maintained by persistence
    stick-table type ip size 1m peers hapeers expire 60m
    stick on src
    # (5) Server List
    # (5.1) Backend
    server Backend_Server1 10.10.10.1 check port 18088
    server Backend_Server2 10.10.10.2 check port 18088 backup


The log directive in above config instructs HAProxy to send logs to the Syslog server listening at 127.0.0.1:514. Messages are sent with facility local2, which is one of the standard, user-defined Syslog facilities. It’s also the facility that our rsyslog configuration is expecting. You can add more than one log statement to send output to multiple Syslog servers.

Once rsyslog and haproxy logging is configured as a minumum you need to restart rsyslog (assuming that haproxy config is already properly loaded):

# systemctl restart rsyslogd.service

To make sure rsyslog reloaded successfully:

systemctl status rsyslogd.service


Restarting HAproxy

If the rsyslogd logging to 127.0.0.1 port 514 was recently added a HAProxy restart should also be run, you can do it with:
 

# /usr/sbin/haproxy -f /etc/haproxy/haproxy.cfg -D -p /var/run/haproxy.pid -sf $(cat /var/run/haproxy.pid)


Or to restart use systemctl script (if haproxy is not used in a cluster with corosync / heartbeat).

# systemctl restart haproxy.service

You can control how much information is logged by adding a Syslog level by

    log         127.0.0.1 local2 info


The accepted values are the standard syslog security level severity:

Value Severity Keyword Deprecated keywords Description Condition
0 Emergency emerg panic System is unusable A panic condition.
1 Alert alert   Action must be taken immediately A condition that should be corrected immediately, such as a corrupted system database.
2 Critical crit   Critical conditions Hard device errors.
3 Error err error Error conditions  
4 Warning warning warn Warning conditions  
5 Notice notice   Normal but significant conditions Conditions that are not error conditions, but that may require special handling.
6 Informational info   Informational messages  
7 Debug debug   Debug-level messages Messages that contain information normally of use only when debugging a program.


Logging only errors / timeouts / retries and errors is done with option:

Note that if the rsyslog is configured to listen on different port for some weird reason you should not forget to set the proper listen port, e.g.:
 

  log         127.0.0.1:514 local2 info

option dontlog-normal

in defaults or frontend section.

You most likely want to enable this only during certain times, such as when performing benchmarking tests.

(or log-format-sd for structured-data syslog) directive in your defaults or frontend
 

Haproxy Logging shortly explained


The type of logging you’ll see is determined by the proxy mode that you set within HAProxy. HAProxy can operate either as a Layer 4 (TCP) proxy or as Layer 7 (HTTP) proxy. TCP mode is the default. In this mode, a full-duplex connection is established between clients and servers, and no layer 7 examination will be performed. When in TCP mode, which is set by adding mode tcp, you should also add option tcplog. With this option, the log format defaults to a structure that provides useful information like Layer 4 connection details, timers, byte count and so on.

Below is example of configured logging with some explanations:

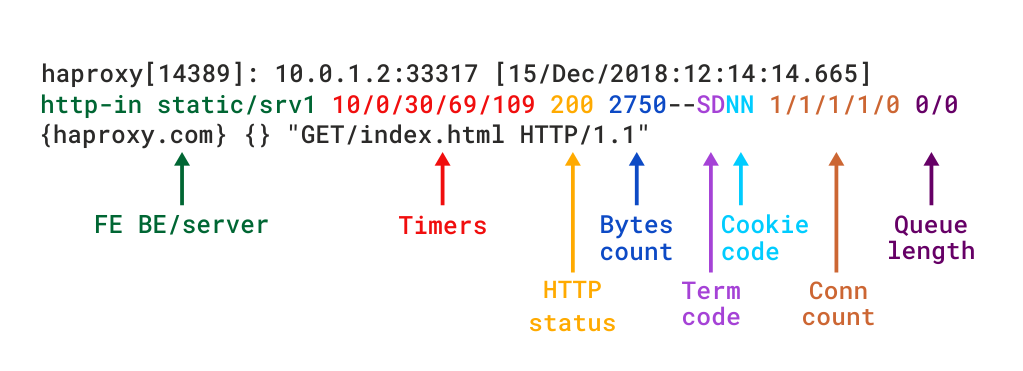
Log-format "%ci:%cp [%t] %ft %b/%s %Tw/%Tc/%Tt %B %ts %ac/%fc/%bc/%sc/%rc %sq/%bq"

haproxy-logged-fields-explained
Example of Log-Format configuration as shown above outputted of haproxy config:

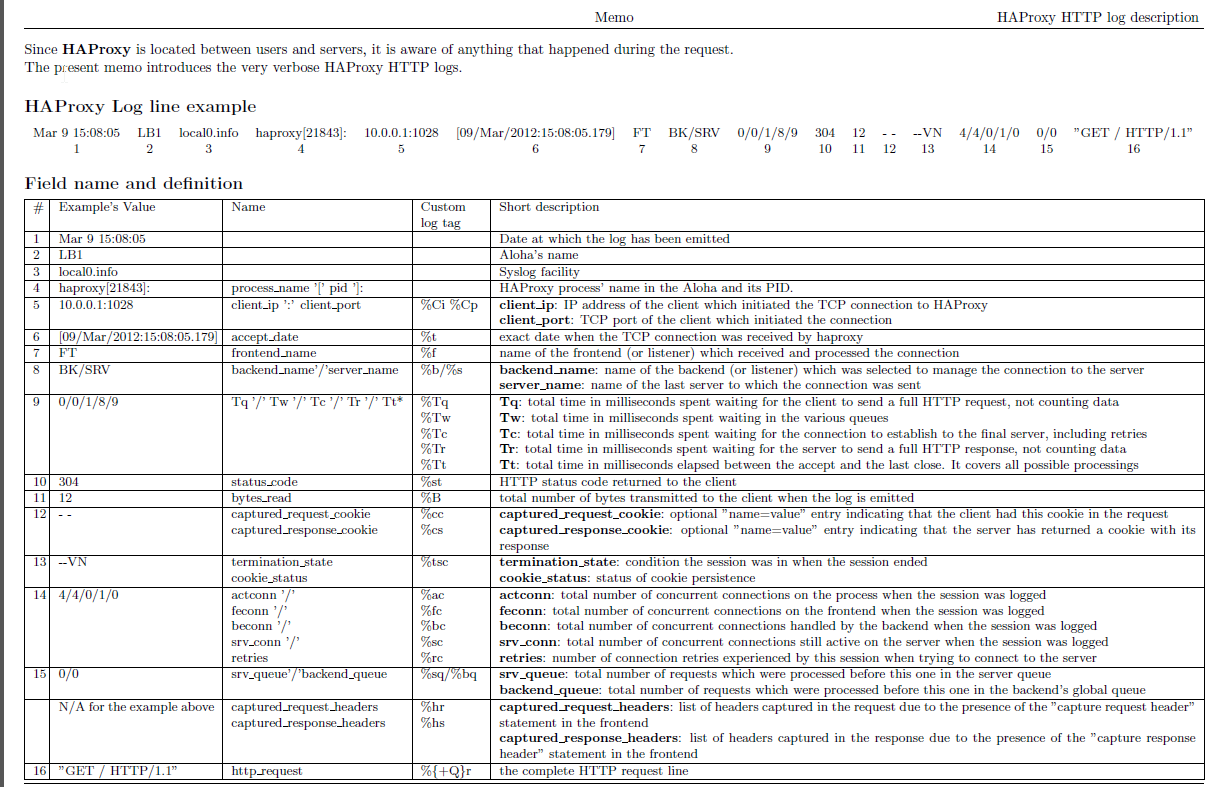
Log-format "%ci:%cp [%tr] %ft %b/%s %TR/%Tw/%Tc/%Tr/%Ta %ST %B %CC %CS %tsc %ac/%fc/%bc/%sc/%rc %sq/%bq %hr %hs %{+Q}r"

haproxy_http_log_format-explained1

To understand meaning of this abbreviations you'll have to closely read  haproxy-log-format.txt. More in depth info is to be found in HTTP Log format documentation


haproxy_logging-explained

Logging HTTP request headers

HTTP request header can be logged via:
 

 http-request capture

frontend website
    bind :80
    http-request capture req.hdr(Host) len 10
    http-request capture req.hdr(User-Agent) len 100
    default_backend webservers


The log will show headers between curly braces and separated by pipe symbols. Here you can see the Host and User-Agent headers for a request:

192.168.150.1:57190 [20/Dec/2018:22:20:00.899] website~ webservers/server1 0/0/1/0/1 200 462 – – —- 1/1/0/0/0 0/0 {mywebsite.com|Mozilla/5.0 (X11; Linux x86_64) AppleWebKit/537.36 (KHTML, like Gecko) Ubuntu Chromium/71.0.3578.80 } "GET / HTTP/1.1"


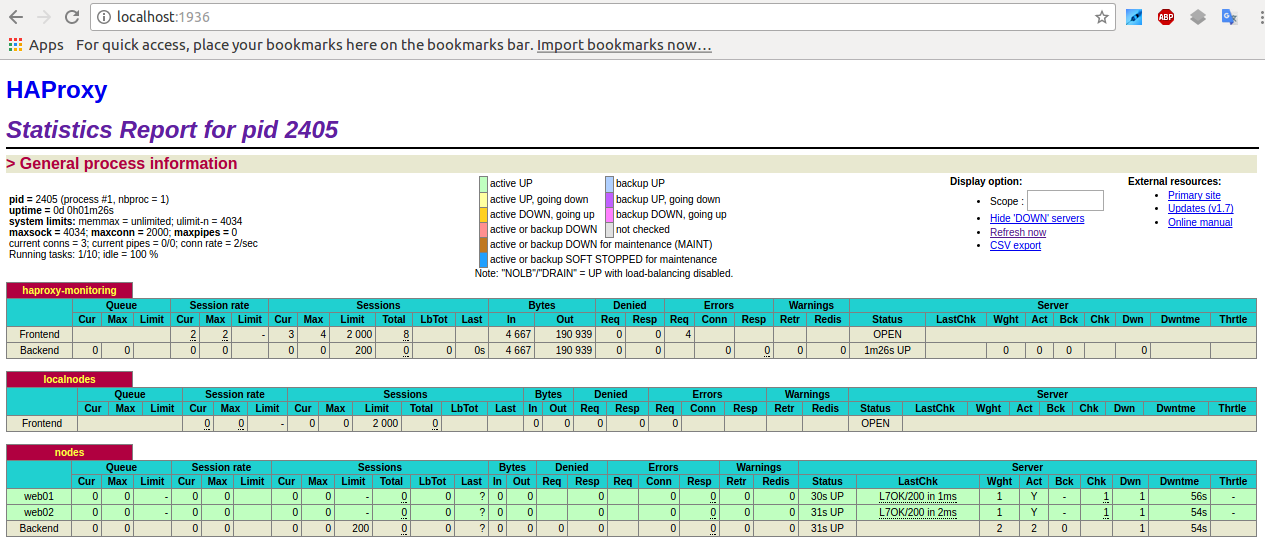
Haproxy Stats Monitoring Web interface


Haproxy is having a simplistic stats interface which if enabled produces some general useful information like in above screenshot, through which
you can get a very basic in browser statistics and track potential issues with the proxied traffic for all configured backends / frontends incoming outgoing
network packets configured nodes
 experienced downtimes etc.

haproxy-statistics-report-picture

The basic configuration to make the stats interface accessible would be like pointed in above config for example to enable network listener on address
 

https://192.168.0.5:8080/stats


with hproxyuser / password config would be:

# HAProxy Monitoring Config
#———————————————————————
listen stats 192.168.0.5:8080                #Haproxy Monitoring run on port 8080
    mode http
    option httplog
    option http-server-close
    stats enable
    stats show-legends
    stats refresh 5s
    stats uri /stats                            #URL for HAProxy monitoring
    stats realm Haproxy\ Statistics
    stats auth hproxyauser:Password___          #User and Password for login to the monitoring dashboard


Sessions states and disconnect errors on new application setup

Both TCP and HTTP logs include a termination state code that tells you the way in which the TCP or HTTP session ended. It’s a two-character code. The first character reports the first event that caused the session to terminate, while the second reports the TCP or HTTP session state when it was closed.

Here are some essential termination codes to track in for in the log:
 

Here are some termination code examples most commonly to see on TCP connection establishment errors:

Two-character code    Meaning
—    Normal termination on both sides.
cD    The client did not send nor acknowledge any data and eventually timeout client expired.
SC    The server explicitly refused the TCP connection.
PC    The proxy refused to establish a connection to the server because the process’ socket limit was reached while attempting to connect.


To get all non-properly exited codes the easiest way is to just grep for anything that is different from a termination code –, like that:

tail -f /var/log/haproxy.log | grep -v ' — '


This should output in real time every TCP connection that is exiting improperly.

There’s a wide variety of reasons a connection may have been closed. Detailed information about all possible termination codes can be found in the HAProxy documentation.
To get better understanding a very useful reading to haproxy Debug errors with  is in haproxy-logging.txt in that small file are collected all the cryptic error messages codes you might find in your logs when you're first time configuring the Haproxy frontend / backend and the backend application behind.

Another useful analyze tool which can be used to analyze Layer 7 HTTP traffic is halog for more on it just google around.

Speeding up Apache through apache2-mpm-worker and php5-cgi on Debian / How to improve Apache performance and decrease server memory consumption

Friday, March 18th, 2011

speeding up apache through apache2-mpm-worker and php5-cgi on Debian Linux / how to improve apache performance and decrease server responce time
By default most Apache running Linux servers on the Internet are configured to use with the mpm prefork apache module
Historically prefork apache module is the predecessor of the worker module therefore it's believed to be a way more tested and reliable, if you need a critical reliable webserver configuration.

However from my experience by so far with the Apache MPM Worker I can boldly say that many of the rumors concerning the unreliabity of apache2-mpm-worker are just myths.

The old way Apache handles connections e.g. the mod prefork is the well known way that high amount of the daemons on Linux and BSD are still realying on.
When prefork is a used by Apache, every new TCP/IP connection arriving at your Linux server on the Apache configured port let's say on port 80 is being served by Apache in a way that the Apache process (mother process) parent does fork a new Apache parent copy in order to serve the new request.
Thus by using the prefork Apache needs to fork new process (if it doesn't have already an empty forked one waiting for connections) and serve the HTTP request of the new client, after the request of the client is completed the newly forked Apache usually dies (even though it again depends on the way the Apache server is configured via the Apache configuration – apache2.conf / httpd.conf etc.).

Now you can imagine how slow and memory consuming it is that all the time the parent Apache process spawns new processes, kills old ones etc. in order to fulfill the client requests.

Now just to compare the Apace mpm prefork does not use the old forking way, but relies on a few Apache processes which handles all the requests without constantly being destroyed and recreated like with the prefork module.
This saves operations and system resources, threaded programming has already been proven to be more efficient way to handle tasks and is heavily adopted in GUI programming for instance in Microsoft Windows, Mac OS X, Linux Gnome, KDE etc.

There is plenty of information and statistical data which compares Apache running with prefork and respectively worker modules online.
As the goal of this article is not to went in depths with this kind of information I would not say more on it but let you explore online a bit more about them in case if you're interested.

The purpose of this article is to explain in short how to substitute the Apache2-MPM-Prefork and how your server performance could benefit out of the use of Apache2-MPM-Worker.
On Debian the default Apache process serving module in Apache 1.3x,Apache 2.0x and 2.2x is prefork thus the installation of apache2-mpm-worker is not "a standard way" to install Apache

Deciding to swith from the default Debian apache-mpm-prefork to apache-mpm-worker is quite a serious and responsible decision and in some cases might cause troubles, if you have decided to follow my article be sure to consider all the possible negative consequences of switching to the apache worker !

Now after having said a bunch of info which might be not necessary with the experienced system admin I'll continue on with the steps to install the apache2-mpm-worker.

1. Install the apache2-mpm-worker

debian:~# apt-get install apache2-mpm-worker php5-cgi
Reading state information... Done
The following packages were automatically installed and are no longer required:
The following packages will be REMOVED apache2-mpm-prefork libapache2-mod-php5
The following NEW packages will be installed apache2-mpm-worker
0 upgraded, 1 newly installed, 2 to remove and 46 not upgraded.
Need to get 0B/259kB of archives.After this operation, 6193kB disk space will be freed.

As you can notice in below's text confirmation which will appear you will have to remove the apache2-mpm-prefork and the apache2-mpm-worker modules before you can proceed to install the apache2-mpm-prefork.

You might ask yourself if I remove my installed libphp how would I be able to use my Apache with my PHP based websites? And why does the apt package manager requires the libapache2-mod-php5 to get removed.
The explanation is simple apache2-mpm-worker is not thread safe, in other words scripts which does use the php fork(); function would not work correctly with the Apache worker module and will probably be leading to PHP and Apache crashes.
Therefore in order to install the apache mod worker it's necessary that no libapache2-mod-php5 is existent on the system.
In order to have a PHP installed on the server again you will have to use the php5-cgi deb package, this is the reason in the above apt-get command I'm also requesting apt to install the php5-cgi package next to apache2-mpm-worker.

2. Enable the cgi and cgid apache modules

debian:~# a2enmod cgi
debian:~# a2enmod cgid

3. Activate the mod_actions apache modules

debian:~# cd /etc/apache2/mods-enabled
debian:~# ln -sf ../mods-available/actions.load
debian:~# ln -sf ../mods-available/actions.conf

4. Add configuration options in order to enable mod worker to use the newly installed php5-cgi

Edit /etc/apache2/mods-available/actions.conf vim, mcedit or nano (e.g. your editor of choice and add inside:

&ltIfModule mod_actions.c>
Action application/x-httpd-php /cgi-bin/php5
</IfModule>

After completing all the above instructions, you might also need to edit your /etc/apache2/apache2.conf to tune up, how your Apache mpm worker will serve client requests.
Configuring the <IfModule mpm_worker_module> in apache2.conf is necessary to optimize your newly installed mpm_worker module for performance.

5. Configure the mod_worker_module in apache2.conf One example configuration for the mod worker is:

<IfModule mpm_worker_module>
StartServers 2
MaxClients 150
MinSpareThreads 25
MaxSpareThreads 75
ThreadsPerChild 25
MaxRequestsPerChild 0
</IfModule>

Consider the fact that this configuration is just a sample and it's in no means configured for serving Apache requests for high load Apache servers and you need to further play with the values to have a good results on your server.

6. Check that all is fine with your Apache configurations and no syntax errors are encountered

debian:~# /usr/sbin/apache2ctl -t
Syntax OK

If you get something different from Syntax OK track the error and fix it before you're ready to restart the Apache server.

7. Now restart the Apache server

debian:~# /etc/init.d/apache2 restart

All should run fine and hopefully your PHP scripts should be interpreted just fine through the php5-cgi instead of the libapache2-mod-php5.
Using the /usr/bin/php5-cgi will increase with some percentage your server CPU load but on other hand will drasticly decrease the Webserver memory consumption.
That's quite logical because the libapache2-mod-hp5 is loaded once during apache server whether a new instance of /usr/bin/php5-cgi is invoked during each of Apache requests via the mod worker.

There is one serious security flow coming with php5-cgi, DoS against a server processing scripts through php5-cgi is much easier to be achieved.
An example for a denial attack which could affect a website running with mod worker and php5-cgi, could be simulated from a simple user with a web browser which holds up the f5 or ctrl + r browser page refresh buttons.
In that case whenever php5-cgi is used the CPU load would rise drastic, one possible solution to this denial of service issues is by installing and using libapache2-mod-evasive like so:

8. Install libapache2-mod-evasive

debian:~# apt-get install libapache2-mod-evasive
The Apache mod evasive module is a nice apache module to minimize HTTP DoS and brute force attacks.
Now with mod worker through the php5-cgi, your apache should start serving requests more efficiently than before.
For some performance reasons some might even want to try out the fastcgi with the worker to boost the Apache performance but as I have never tried that I can't say how reliable a a mod worker with a fastcgi would be.

N.B. ! If you have some specific php configurations within /etc/php5/apache2/php.ini you will have to set them also in /etc/php5/cgi/php.ini before you proceed with the above instructions to install Apache otherwise your PHP scripts might not work as expected.

Mod worker is also capable to work with the standard mod php5 Apache module, but if you decide to go this route you will have to recompile your PHP lib manually from source as in Debian this option is not possible with the default php library.
This installation worked fine on Debian Lenny but suppose the same installation should work fine on Debian Squeeze as well as Debian testing/unstable.
Feedback on the afore-described mod worker installation is very welcome!

How to activate (enable) telnet client on Windows XP and Windows 7

Thursday, November 22nd, 2012

1. Enable / Disable Telnet Client command on Windows XP

By default telnet is enabled on Windows XP. However on some messed up Windows installations, cause of viruses or some custom users changes the PATH variable set for command prompt to C:\WINDOWS\system32\
is missing and therefore typing in telnet in cmd.exe fails to find the command. Thus it is good idea before trying to enable telnet with dism command to try running in Command Prompt

C:\WINDOWS\system32\telnet.exe,

 If the command is not found  by giving it full path, then you can read down the article how to enable it.
Launch command prompt cmd.exe and type:

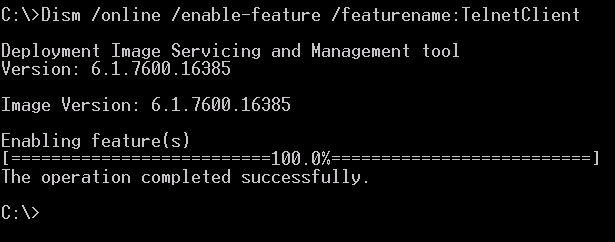
dism /online /Enable-Feature /FeatureName:TelnetClient

dism command enable disable telnet client command on windows 7 and windows 2008 servers Launching again:

dism /online /Enable-Feature /FeatureName:TelnetClient

Disables telnet, whether it is enabled on system, on some systems XP admins might want to do this for increasing system security 

2. Enabling Telnet client using XP Graphical interface

Start (button) -> Control Panel -> Add / Remove Programs-> (Click on Turn Windows features on and Off )

3. Turn on Windows Telnet Client on Win 7  using Graphical Environment

Probably out of security, concerns within Microsoft took a wise decision to make Telnet Client disabled by default on Windows 7. Thus just trying to run it via cmd.exe users one gets 'telnet is not recognized as internal or external command, operable program or batch file'

Telnet not recognized as internal or external command message on Windows 7

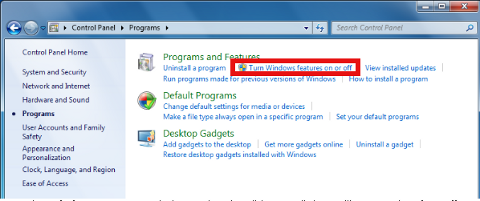
Start (button) -> Control Panel -> Program and Features -> (Click on Turn Windows features on and Off )

turning on-telnet client control panel turn windows features on and off screenshot

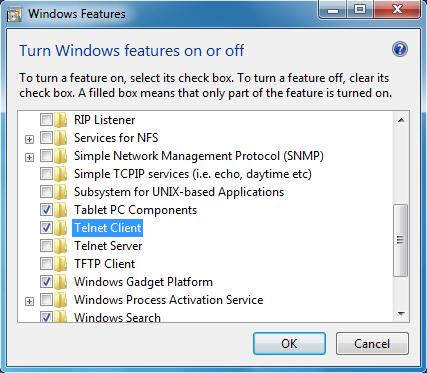
You will get a dialog listing a number of things you can turn on you need to set tick on
Telnet Client

windows 7 windows features on and off enable telnet tickset

 Then a pop-up User Account Control will require you to enter administrator user password (if not already logged in as administrator).

Please wait while Windows makes changes to features, installing telnet client post dialog window

Further on launch cmd.exe and type telnet

Start (menu) -> Start Search -> cmd.exe
or pressing Windows Button + R and type in cmd.exe and type telnet

4. Turn on ( Install ) Win 7 Telnet Client from command line:

Launch command prompt (cmd.exe) and type in:

C:\Windows> pkgmgr /iu:"TelnetClient"

Installing using pkgmgr /ui: "TelnetClient" should be able to install telnet also on Windows 2008, Windows 2008 R2 Servers and Windows Vista

Happy telnet-ing 🙂

How to add multi language support to wordpress with qTranslate

Monday, October 3rd, 2011

QTRanslate WordPress Language Translate Screenshot 1

Lately, I have to deal with some wordpress based installs in big part of my working time. One of the wordpress sites needed to have added a multi language support.

My first research in Google pointed me to WPML Multilingual CMS The WordPress Multilingual Plugin
WPML Multilingual CMS looks nice and easy to use but unfortunately its paid, the company couldn’t afford to pay for the plugin so I looked forward online for a free alternative and stumbled upon QTranslate

QTranslate is free and very easy to install. Its installed the wordpress classic way and the installation went smoothly, e.g.:

1. Download and unzip QTranslate

# cd /var/www/blog/wp-content/plugins
/var/www/blog/wp-content/plugins# wget http://downloads.wordpress.org/plugin/qtranslate.2.5.24.zip
...
/var/www/blog/wp-content/plugins# unzip qtranslate.2.5.24.zip
...

Just for fun and in case the plugin disappears in future, a mirror of Qtranslate 2.5.24 is found here

2. Enable QTranslate from wordpress admin

Plugins -> Inactive -> qTranslate (Activate)

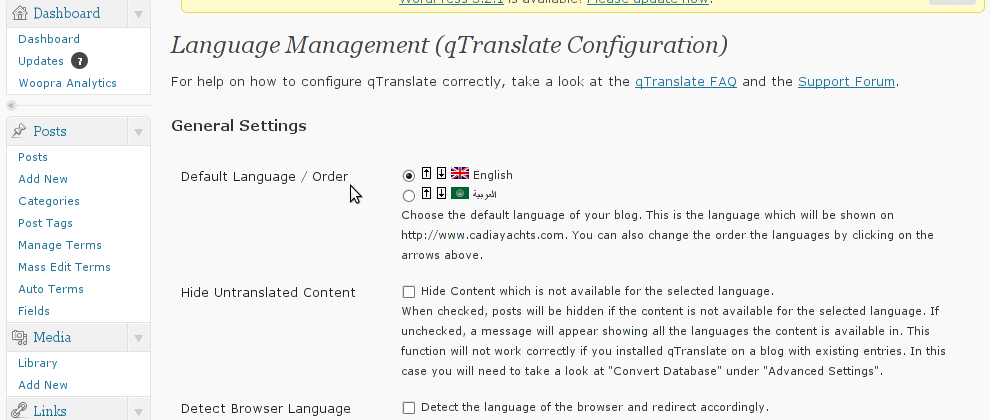
After activating the plugin, there is a Settings button from which qTranslate‘s various plugin parameteres can be tuned.

qTranslate WordPress translate screenshot 2

In my case my site had to support both English and Arabic, so from the settings I added support for Arabic translation to the wordpress install.

Adding Arabic is done in the following way:

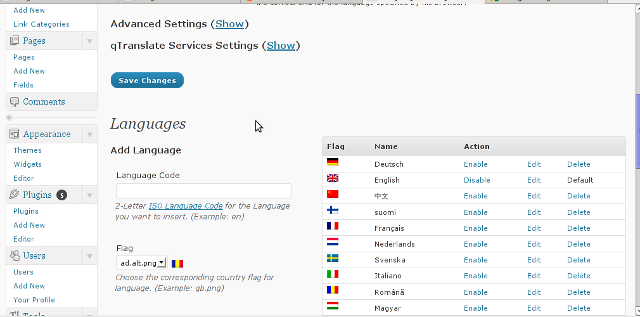
a. From the Language Management (qTranslate Configuration) from the Languages menu and the Languages (Add Languages) I had to choose a language code (in my case a language code of ar – for Arabic). Next I had to choose the Arabic flag from the follow up flag list.

In next text box Name , again I had to fill Arabic, for Locale en_US.UTF-8
The following Date Format and Time Format text boxes are optional so I left them blank.
To complete the process of adding the Arabic as a new language wordpress should support I pressed the Add Language button and the Arabic got added as a second language.

Afterwards the Arabic was added as second language, on the bottom of the left wordpress menu pane a button allowing a switch between English, Arabic appeared (see below screenshot):

MultiLingual WordPress with qTranslate

Finally to make Arabic appear as a second language of choice on the website I added it as a Widget in the Widgets menu from the AWidgets menu:

Appearance -> Widgets

In widgets I added qTranslate Language Chooser to the Sidebar without putting any kind of Title for qtranslate widget .
I found it most helpful to choose the Text and Image as an option on how to display the Language switching in the wp.