Posts Tagged ‘alert’

DNS Monitoring: Check and Alert if DNS nameserver resolver of Linux machine is not properly resolving shell script. Monitor if /etc/resolv.conf DNS runs Okay

Thursday, March 14th, 2024

linux-monitor-check-dns-is-resolving-fine

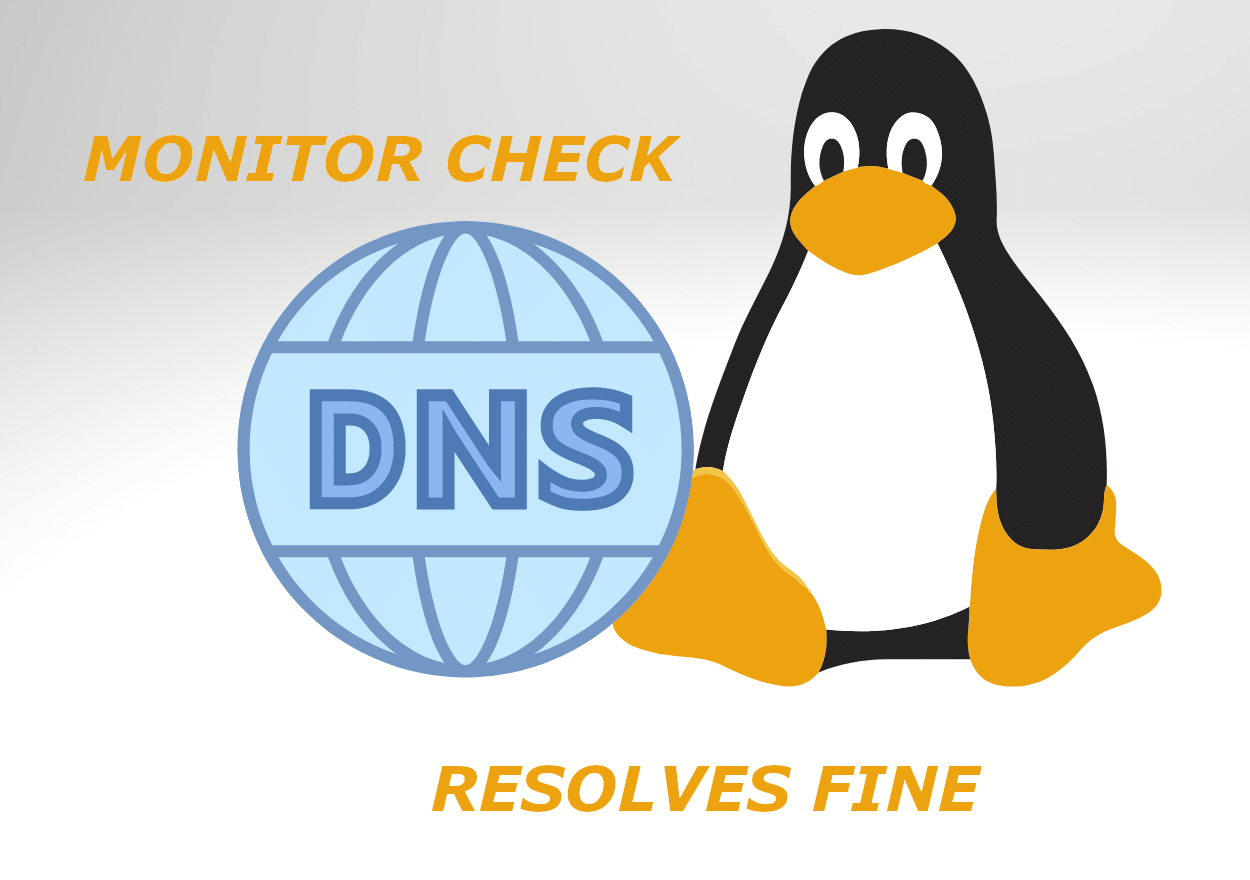
If you happen to have issues occasionally with DNS resolvers and you want to keep up an eye on it and alert if DNS is not properly resolving Domains, because sometimes you seem to have issues due to network disconnects, disturbances (modifications), whatever and you want to have another mean to see whether a DNS was reachable or unreachable for a time, here is a little bash shell script that does the "trick".

Script work mechacnism is pretty straight forward as you can see we check what are the configured nameservers if they properly resolve and if they're properly resolving we write to log everything is okay, otherwise we write to the log DNS is not properly resolvable and send an ALERT email to preconfigured Email address.

Below is the check_dns_resolver.sh script:


#!/bin/bash
# Simple script to Monitor DNS set resolvers hosts for availability and trigger alarm  via preset email if any of the nameservers on the host cannot resolve
# Use a configured RESOLVE_HOST to try to resolve it via available configured nameservers in /etc/resolv.conf
# if machines are not reachable send notification email to a preconfigured email
# script returns OK 1 if working correctly or 0 if there is issue with resolving $RESOLVE_HOST on $SELF_HOSTNAME and mail on $ALERT_EMAIL
# output of script is to be kept inside DNS_status.log

ALERT_EMAIL='your.email.address@email-fqdn.com';
log=/var/log/dns_status.log;
TIMEOUT=3; DNS=($(grep -R nameserver /etc/resolv.conf | cut -d ' ' -f2));  

SELF_HOSTNAME=$(hostname –fqdn);
RESOLVE_HOST=$(hostname –fqdn);

for i in ${DNS[@]}; do dns_status=$(timeout $TIMEOUT nslookup $RESOLVE_HOST  $i); 

if [[ “$?” == ‘0’ ]]; then echo "$(date "+%y.%m.%d %T") $RESOLVE_HOST $i on host $SELF_HOST OK 1" | tee -a $log; 
else 
echo "$(date "+%y.%m.%d %T")$RESOLVE_HOST $i on host $SELF_HOST NOT_OK 0" | tee -a $log; 

echo "$(date "+%y.%m.%d %T") $RESOLVE_HOST $i DNS on host $SELF_HOST resolve ERROR" | mail -s "$RESOLVE_HOST /etc/resolv.conf $i DNS on host $SELF_HOST resolve ERROR";

fi

 done

Download check_dns_resolver.sh here set the script to run via a cron job every lets say 5 minutes, for example you can set a cronjob like this:
 

# crontab -u root -e
*/5 * * * *  check_dns_resolver.sh 2>&1 >/dev/null


Then Voila, check the log /var/log/dns_status.log if you happen to run inside a service downtime and check its output with the rest of infrastructure componets, network switch equipment, other connected services etc, that should keep you in-line to proof during eventual RCA (Root Cause Analysis) if complete high availability system gets down to proof your managed Linux servers was not the reason for the occuring service unavailability.

A simplified variant of the check_dns_resolver.sh can be easily integrated to do Monitoring with Zabbix userparameter script and DNS Check Template containing few Triggers, Items and Action if I have time some time in the future perhaps, I'll blog a short article on how to configure such DNS zabbix monitoring, the script zabbix variant of the DNS monitor script is like this:

[root@linux-server bin]# cat check_dns_resolver.sh 
#!/bin/bash
TIMEOUT=3; DNS=($(grep -R nameserver /etc/resolv.conf | cut -d ' ' -f2));  for i in ${DNS[@]}; do dns_status=$(timeout $TIMEOUT nslookup $(hostname –fqdn) $i); if [[ “$?” == ‘0’ ]]; then echo "$i OK 1"; else echo "$i NOT OK 0"; fi; done

[root@linux-server bin]#


Hope this article, will help someone to improve his Unix server Infrastucture monitoring.

Enjoy and Cheers !

Monitoring chronyd time service is synchronized, get additional time server values with Zabbix userparameter script

Monday, March 21st, 2022

monitoring-chronyc-time-server-synchronization-zabbix-logo

If you''re running a server infrastructure and your main monitoring system is Zabbix. Then a vital check you might want to setup is to monitor the server time synchronization to a central server. In newer Linux OS-es ntpd time server is started to be used lesser and many modern Linux distributions used in the corporate realm are starting to recommend using chrony as a time synchronization client / server.

In this article, I'll show you how you can quickly setup monitoring of chronyd process and monitoring whether the time is successfully synchronizing with remote Chronyd time server. This will be done with a tiny one liner shell script setup as userparameter It is relatively easy then to setup an Action Alert


1. Create userparameter script to send parsed chronyd time synchronization to Zabbix Server

chronyc tracking provides plenty of useful data which can give many details about info such as offset, skew, root delay, stratum, update interval.

[root@server: ~]# chronyc tracking
Reference ID    : 0A32EF0B (fkf-intp01.intcs.meshcore.net)
Stratum         : 3
Ref time (UTC)  : Fri Mar 18 12:42:31 2022
System time     : 0.000032544 seconds fast of NTP time
Last offset     : +0.000031102 seconds
RMS offset      : 0.000039914 seconds
Frequency       : 3.037 ppm slow
Residual freq   : +0.000 ppm
Skew            : 0.023 ppm
Root delay      : 0.017352410 seconds
Root dispersion : 0.004285847 seconds
Update interval : 1041.6 seconds
Leap status     : Normal

[root@server zabbix_agentd.d]# cat userparameter_chrony.conf 
UserParameter=chrony.json,chronyc -c tracking | sed -e s/'^'/'{"chrony":[“‘/g -e s/’$’/'”]}'/g -e s/','/'","'/g
[root@server zabbix_agentd.d]#

The -c option passed to chronyc is printing the chronyc tracking command ouput data in comma-separated values ( CSV ) format.

2. Create Necessery Item key to get chronyd processes and catch the userparameter data


  • First lets create a an Item key to calculate the chronyd daemon proc.num
    proc.num – simply returns the number of processes in the process list just like a simple
    pgrep servicename command does.


monitroing-chronyc_zabbix_item_report_to-zabbix

Second lets create the Item for the userparameter script, the chrony.json key should be the same as the key given in the userparameter script.

obtain-chronyc-statistic-variables-from-remote-chronyd-to-zabbix-windows

Create Chrony Zabbix Triggers 
 

Expression 

{server-host:proc.num[chronyd].last()}<1


will be triggered if the process of chronyd on the server is less than 1


chronyc_monitoring_process-is-not-running-screenshot

Next configure

{server-host:chrony[Leap status].iregexp[Not synchronised) ]=1


to trigger Alert Chronyd is Not synchronized if the Expression check occurs.

chronyd-is-not-synchronized-trigger-iregexp

Reload the zabbix-agent on the server
 

To make zabbix-agent locally installed on the machine read the userparameter into memory  (in my case this is zabbix-agent-4.0.28-1.el8.x86_64) installed on Redhat 8.3 (Ootpa), you have to restart it.

[root@server: ~]# systemctl restart zabbix-agent
[root@server: ~]# systemctl status zabbix-agent

● zabbix-agent.service – Zabbix Agent
   Loaded: loaded (/usr/lib/systemd/system/zabbix-agent.service; enabled; vendor preset: disabled)
   Active: active (running) since Thu 2021-12-16 16:41:02 CET; 3 months 0 days ago
 Main PID: 862165 (zabbix_agentd)
    Tasks: 6 (limit: 23662)
   Memory: 20.6M
   CGroup: /system.slice/zabbix-agent.service
           ├─862165 /usr/sbin/zabbix_agentd -c /etc/zabbix/zabbix_agentd.conf
           ├─862166 /usr/sbin/zabbix_agentd: collector [idle 1 sec]
           ├─862167 /usr/sbin/zabbix_agentd: listener #1 [waiting for connection]
           ├─862168 /usr/sbin/zabbix_agentd: listener #2 [waiting for connection]
           ├─862169 /usr/sbin/zabbix_agentd: listener #3 [waiting for connection]
           └─862170 /usr/sbin/zabbix_agentd: active checks #1 [idle 1 sec]

Warning: Journal has been rotated since unit was started. Log output is incomplete or unavailable.


In a short while you should be seeing in the chrony.json key History data fed by the userparameter Script.

In Zabbix Latest data, you will see plenty of interesting time synchronization data get reported such as Skew, Stratum, Root Delay, Update Interval, Frequency etc.

chronyd-zabbix-reported-time-synchronization-offset-leap-residual-freq-root-delay-screenshot

To have an email Alerting further, go and setup a new Zabbix Action based on the Trigger with your likings and you're done. 
The tracked machine will be in zabbix to make sure your OS clock is not afar from the time server. Repeat the same steps if you need to track chronyd is up running and synchronized on few machines, or if you have to make it for dozens setup a Zabbix template.