Posts Tagged ‘command line tools’

Windows: command to show CPU info, PC Motherboard serial number and BIOS details

Wednesday, March 2nd, 2016

windows-command-to-show-motherboard-bios-and-cpu-serials-and-specific-info-with-wmic

Getting CPU information, RAM info and other various hardware specifics on Windows from the GUI interface is pretty trivial from Computer -> Properties
even more specifics could be obtained using third party Windows software such as CPU-Z

Perhaps there are plenty of many other ones to get and log info about hardware on PC or notebook system, but for Windwos sysadmins especially ones who are too much in love with command prompt way of behaving and ones who needs to automatizate server deployment processes with BATCH (.BAT)  scripts getting quickly info about hardware on freshly installed remote host Win server with no any additional hardware info tools, you'll be happy to know there are command line tools you can use to get extra hardware information on Windows PC / server:

The most popular tool available to present you with some basic hardware info is of course systeminfo


C:\> systeminfo

Host Name:                 REMHOST
OS Name:                   Microsoft Windows Server 2012 R2 Standard
OS Version:                6.3.9600 N/A Build 9600
OS Manufacturer:           Microsoft Corporation
OS Configuration:          Member Server
OS Build Type:             Multiprocessor Free
Registered Owner:          Registrar
Registered Organization:   Registrar
Product ID:                00XXX-X0000-00000-XX235
Original Install Date:     17/02/2016, 11:38:39
System Boot Time:          18/02/2016, 14:16:48
System Manufacturer:       VMware, Inc.
System Model:              VMware Virtual Platform
System Type:               x64-based PC
Processor(s):              1 Processor(s) Installed.
                           [01]: Intel64 Family 6 Model 45 Stepping 7 GenuineInt
el ~2600 Mhz
BIOS Version:              Phoenix Technologies LTD 6.00, 11/06/2014
Windows Directory:         C:\Windows
System Directory:          C:\Windows\system32
Boot Device:               \Device\HarddiskVolume1
System Locale:             de;German (Germany)
Input Locale:              de;German (Germany)
Time Zone:                 (UTC+01:00) Amsterdam, Berlin, Bern, Rome, Stockholm,
 Vienna
Total Physical Memory:     4,095 MB
Available Physical Memory: 2,395 MB
Virtual Memory: Max Size:  10,239 MB
Virtual Memory: Available: 8,681 MB
Virtual Memory: In Use:    1,558 MB
Page File Location(s):     C:\pagefile.sys
Domain:                    dom1.domain.com
Logon Server:              \\DOM
Hotfix(s):                 148 Hotfix(s) Installed.
                           [01]: KB2894852
                           [02]: KB2894856
                           [03]: KB2918614
                           [04]: KB2919355
…..


Now though systeminfo's hardware details and installed Windows KBXXXXX OS Hotfix patches are getting lists the command does not provide you with info about  system’s BIOS, thus to get this info you'll have to use also wmic (Windows Management Instrumentation Command).


So What Is WMIC?

WMIC extends WMI for operation from several command-line interfaces and through batch scripts. Before WMIC, you used WMI-based applications (such as SMS), the WMI Scripting API, or tools such as CIM Studio to manage WMI-enabled computers. Without a firm grasp on a programming language such as C++ or a scripting language such as VBScript and a basic understanding of the WMI namespace, do-it-yourself systems management with WMI was difficult. WMIC changes this situation by giving you a powerful, user-friendly interface to the WMI namespace.

WMIC is more intuitive than WMI, in large part because of aliases. Aliases take simple commands that you enter at the command line, then act upon the WMI namespace in a predefined way, such as constructing a complex WMI Query Language (WQL) command from a simple WMIC alias Get command. Thus, aliases act as friendly syntax intermediaries between you and the namespace. For example, when you run a simple WMIC command such as

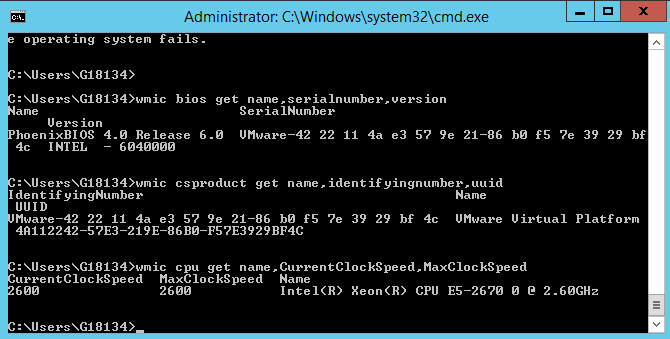
Here is how to wmic to get PC Motherboard serial numbers, CPU and BIOS details:


C:\> wmic bios get name,serialnumber,version


Above will print  name if your BIOS, current version and it’s serial number if there is any.

If you need to get more info about the specific Motherboard installed on host:


C:\> wmic csproduct get name,identifyingnumber,uuid


This command will show motherboard modification and it’s UUID

If you want to quickly get what is Windows running hardware CPU clock speed
 

C:\> wmic cpu get name,CurrentClockSpeed,MaxClockSpeed


Also if you have turbo boost CPUs above command will help you find what’s the Max Clock Speed your system is capable of for the current hardware configuration.

If you do have dynamic clock speed running, then add this line, will refresh and monitor the Clock speed every 1 second.
 

C:\> wmic cpu get name,CurrentClockSpeed,MaxClockSpeed /every:1

Actually wmic is a great tool

Monitoring Disk use, CPU Load, Memory use and Network in one console ncurses interface – Glance

Thursday, August 14th, 2014

monitoring-disk-use-memory-cpu-load-and-network-in-one-common-interfaces-with-glances-Linux-BSD-UNIX
If you're Linux / UNIX / BSD system administrator you already have experience with basic admin's system monitoring:

  •     CPU load
  •     OS Name/Kernel version
  •     System load avarage and Uptime
  •     Disk and Network Input/Output I/O operations by interface
  •     Process statistics / Top loading processes etc.
  •     Memory / SWAP usage and free memory
  •     Mounted partitions


Such info is provided by command line tools such as:

top, df, free, sensors, ifconfig, iotop, hddtemp, mount, nfsstat, nfsiostat, dstat, uptime, nethogs iptraf

etc.

There are plenty of others advanced tools also Web based server monitoring visualization  tools, such as Monit, Icanga, PHPSysInfo, Cacti which provide you statistics on computer hardware and network utilization

So far so good, if you already are used to convenience of web *NIX based monitoring but you don't want to put load on the servers with such and you're lazy to write custom scripts that show most important monitoring information – necessery for daily system administration monitoring and prevention from downtimes and tracking bottlenecks you will be glad to hear about Glances
 

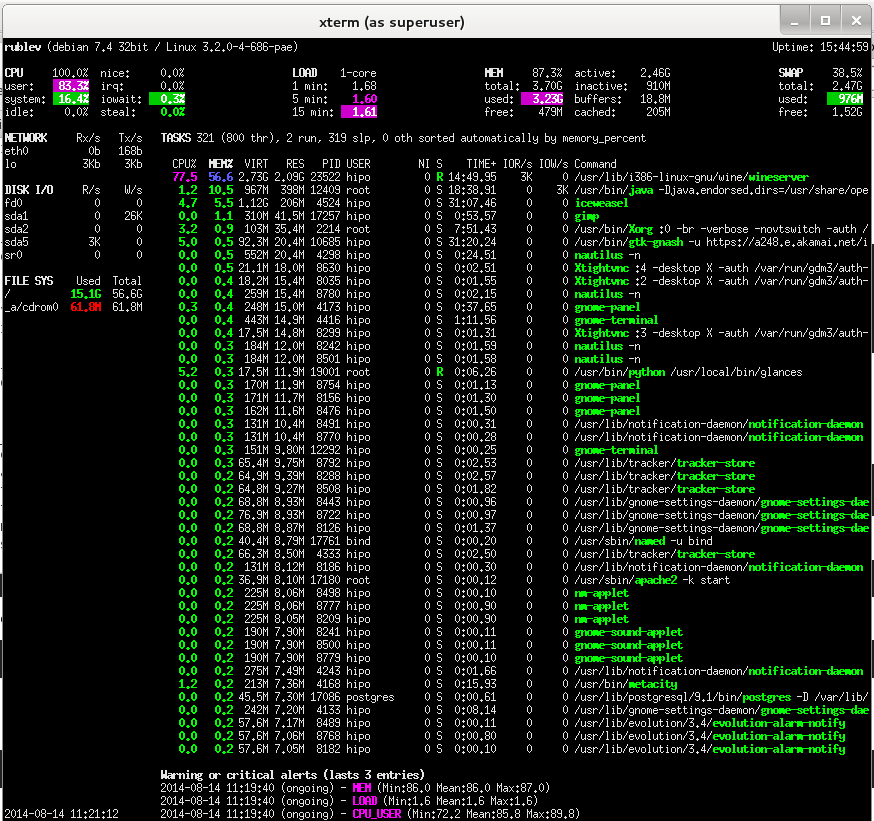
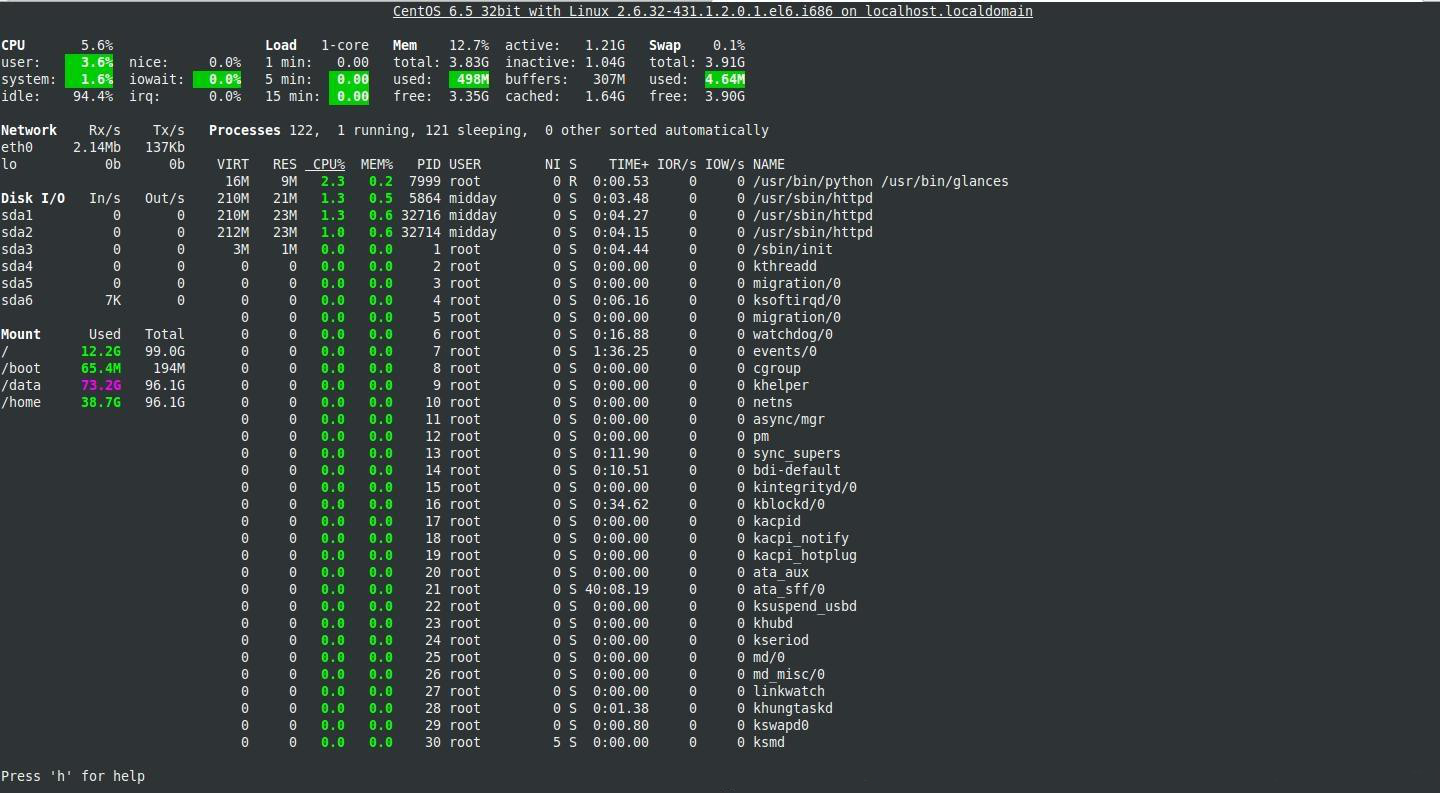
Glances is a free (LGPL) cross-platform curses-based monitoring tool which aims to present a maximum of information in a minimum of space, ideally to fit in a classical 80×24 terminal or higher to have additionnal information. Glances can adapt dynamically the displayed information depending on the terminal size. It can also work in a client/server mode for remote monitoring.


1. Installing Glances curses-based monitoring tool on Debian 7 / Ubuntu 13+ / Mint  Linux

We have to install python-pip (python package installer tool) to later install Glances

apt-get install –yes 'python-dev' 'python-jinja2' 'python-psutil'
                        'python-setuptools' 'hddtemp' 'python-pip' 'lm-sensors'


Before proceeding to install Glances to make Thermal sensors working (if supported by hardware) run:


 sensors-detect

Glances is written in Python and uses psutil library to obtain monitoring statistic values, thus it is necessery to install few more Python libraries:

pip install 'batinfo' 'pysensors'

If you're about to use pip – Python package installer tool, behind a proxy server use instead:
 

pip install –proxy=http://your-proxy-host.com:8080 'batinfo' 'pysensors'

Then install Glances script itself again using pip
 

pip install 'Glances'

Downloading/unpacking Glances
  Downloading Glances-2.0.1.tar.gz (3.3Mb): 3.3Mb downloaded
  Running setup.py egg_info for package Glances
    
Downloading/unpacking psutil>=2.0.0 (from Glances)
  Downloading psutil-2.1.1.tar.gz (216Kb): 216Kb downloaded
  Running setup.py egg_info for package psutil

Successfully installed Glances psutil


Then run glances from terminal
 

glances -t 3

-t 3 option tells glances to refresh collected statistics every 3 seconds

glances-console-monitoring-tool-every-systemad-ministrator-should-know-and-use-show-memory-disk-cpu-mount-point-statistics-in-common-shared-screen-linux-freebsd-unix


2. Installing Glances monitoring console tool on CentOS / RHEL / Fedora / Scientific Linux

Installing glances on CentOS 7 / Fedora and rest of RPM based distributions can be done by adding external RPM repositories, cause glances is not available in default yum repositories.

To enable Extra-packages repositories:
 

rpm -ivh http://dl.fedoraproject.org/pub/epel/6/x86_64/epel-release-6-8.noarch.rpm


Then update yum to include new repository's packages into package list and install python-pip and python-devel rpms
 

yum update
yum install python-pip python-devel


Glances-console-server-stateScreenhot-on-CentOS-Linux-monitoring-in-ncurses-Linux-BSD

There is also FreeBSD port to install Glances on FreeBSD:
 

cd /usr/sysutils/py-glances
make install


Enjoy 🙂 !


xkill for Windows – Kill hanged programs with one click like in UNIX

Thursday, September 18th, 2014

Windows Xkill by Solo Dev logo kill easily hanged, crashed windows programs - Linux xkill for Windows alternative

I’ve used Linux as I’ve used it over the last 10 years and thus I’m so used to xkill that I consider it as a normal tool every modern operating system should have.

Since I’m forced to work on a Windows platform over the last 1 year, every now and then I have crashing / hanged apps Window which sometimes is hard to kill using Task Manager or command line tools like tasklist, taskkill or pstools – Windows Sysinternal tools cause you don’t know the exact process name of the Windows crashed application.

Thanksfully a good hearted guy SuprVillain made Windows Xkill program. Windows Xkill is portable app, so you don’t need to install it but simply download and run it.

windows-7-system-tray-xkill-screenshot-xkill-for-windows

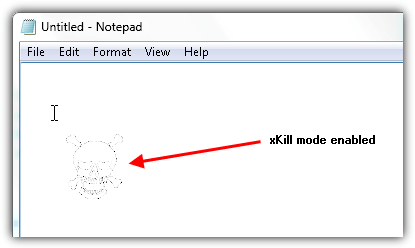
Win-Xkill runs in system tray and has “kill mode” of operation, when Kill mode it is running Windowns Xkill operates exactly like UNIX’s xkill. The mouse pointer turns into Skull and Cross Bones, you point at a Window app you wanted to kill and it gets terminated.
Windows Xkill kill mode enabled killing a windows notepad app
Win Xkill kill mode, can be invoked using also a key press Control+Alt+Backspace as well as there is an option to leave xkill running in the background background, but disabling the tiny skull icon in systray from its interface.
Enjoy 🙂

Optimize WordPress Pictures with EWWW Image Optimizer, Async JS and CSS and Autoptimize for better Search Engine Ranking

Tuesday, December 9th, 2014


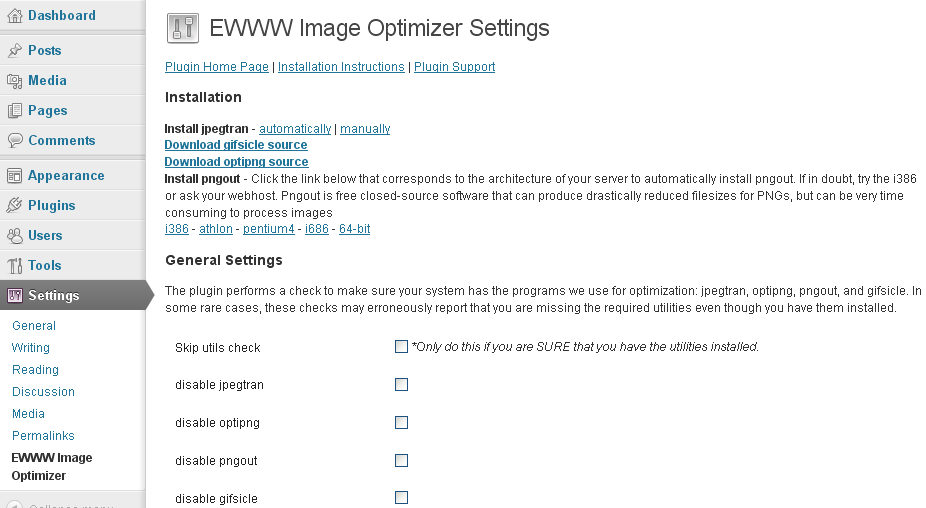
wordpress-ewww-image-optimizer_settings_screenshot-plugin-seo-for-images-wp_3

While optimizing picture performance with console tools optipng, jpegoptin, jpegtran, pngcrush (could save you a lot of server space and make pictures downloads faster (and hence increase your website responsiveness and SEO – check out), still for Blogs and WebSites based on WordPress its not worthy to loose time with console acrobatics but simply use EWWW Image Optimizer to Optimize all old or new uploaded Images.

To work EWWW Image Optimizer needs jpegtran, optipng, pngout and gifsicle to be installed on the Linux / BSD server. EWWW Image Optimizer can load the command line tools also from a Cloud, if a cloud service is running on the server. Once installed the plugin does scan all the imported WordPress Media files and can be run to optimize picture files on present blog psot / pages.

EWWW Image Opitimizer plugin does a good job in reducing file size on  NextGEN, GRAND FlAGallery galleries.

wordpress-ewww-image-optimizer_settings_screenshot-plugin-seo-for-images-wp

Here is how EWWW Image Optimizer works taken from plugin's website:
How are JPGs optimized?

Lossless optimization is done with the command jpegtran -copy all -optimize -progressive -outfile optimized-file original-file. Optionally, the -copy switch gets the 'none' parameter if you choose to strip metadata from your JPGs on the options page. Lossy optimization is done using the outstanding JPEGmini utility.
It is better if the server has not the jpegtran, pngout, gifsicle utilities installed as the plugin provides an uptodate static compiled Linux binaries.

How are PNGs optimized?

There are three parts (and all are optional). First, using the command pngquant original-file, then using the commands pngout-static -s2 original-file and optipng -o2 original-file. You can adjust the optimization levels for both tools on the settings page. Optipng is an automated derivative of pngcrush, which is another widely used png optimization utility.

How are GIFs optimized?

Using the command gifsicle -b -O3 –careful original file. This is particularly useful for animated GIFs, and can also streamline your color palette. That said, if your GIF is not animated, you should strongly consider converting it to a PNG. PNG files are almost always smaller, they just don't do animations. The following command would do this for you on a Linux system with imagemagickconvert somefile.gif somefile.png

wordpress-ewww-image-optimizer_settings_screenshot-plugin-seo-for-images-wp

Some othe plugins that could strenghten your WordPress Search Engine Optimization ranking worthy to check are:
 

  • Async JS and CSS
     

Most importantly plugin solves "Render-blocking JavaScript and CSS" warning shown during site audit with  Google Developers PageSpeed InsightBy the way Google PageSpeed Insight is a precious tool so I recommend you check if you already haven't, Google's suggestions could often double or triple daily site visitors 

What Async JS and CSS does is:

Converts render-blocking CSS and JS files into NON-render-blocking, improving performance of web page

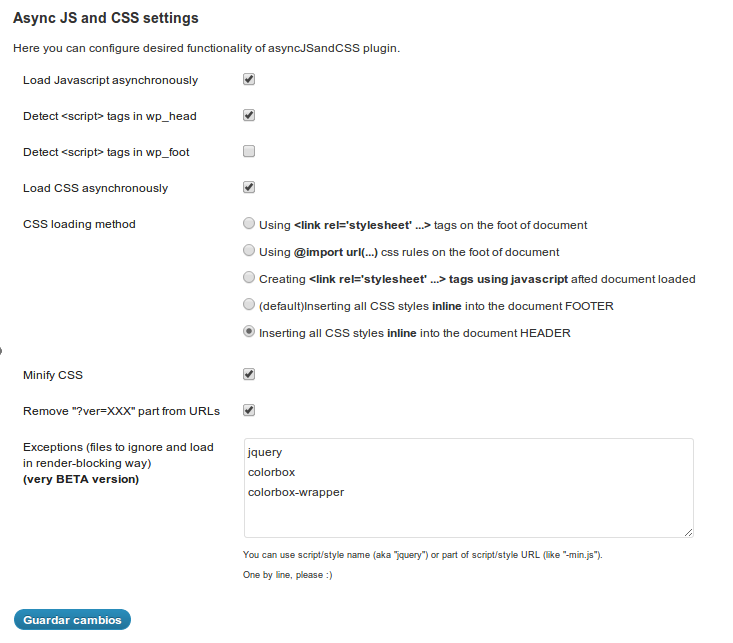
async_js_and_css_wordpress-plugin_configuration_menu

The plugin makes ALL scripts loaded by other plugins to be loaded in asynchronous. All CSS files will be inserted inline into the document code or moved from the document beginning to the end, just before closing BODY tag (or just where you placed wp_foot() function). There are various methods to do that via plugin configuration page.
 

  • Autoptimize


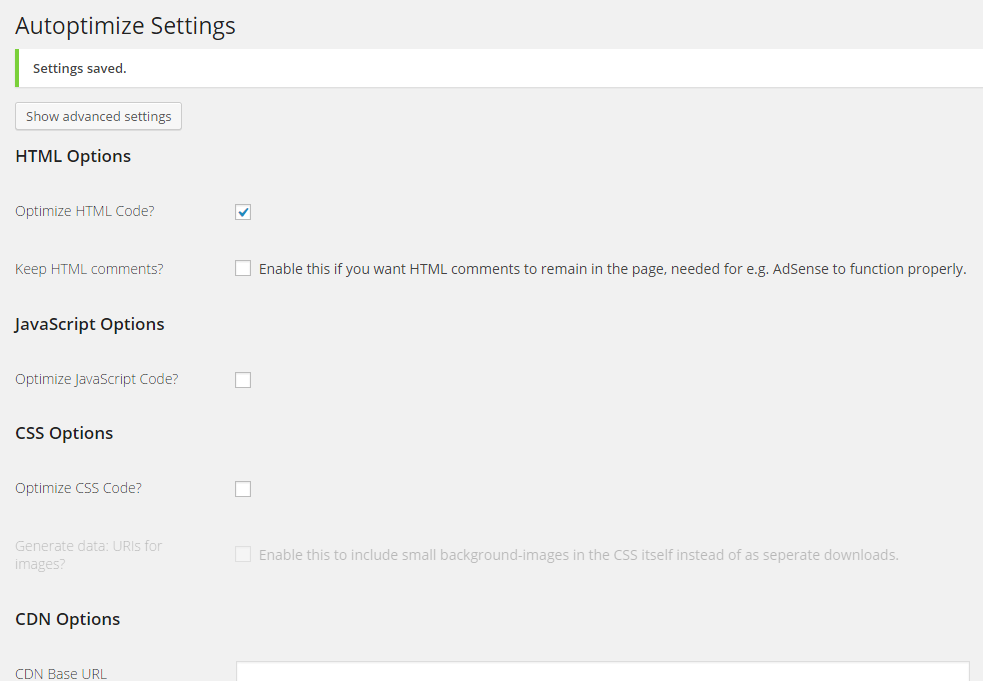
    Wordpress-Autoptimize-screenshot-a-plugin-to-minify-wordpress-html-js-and-css-scripts

Autoptimize speeds up your website and helps you save bandwidth by aggregating and minimizing JS, CSS and HTML.

What does the plugin do to help speed up site?

It concatenates all scripts and styles, minifies and compresses them, adds expires headers, caches them, and moves styles to the page head, and scripts to the footer. It also minifies the HTML code itself, making your page really lightweight. Autoptimize is very much like WP Mnify (CSS / JS) minifaction WP plugin. The only difference and reason why you might want to use WP Mnify is it does HTML minification – something that WP Minify does not. Both plugins play nice together the only thing to be careful is not to configure CSS / JS minification in both Autoptimize and WP Minifyas this might slower instead of fasten the WP site.

A great bunch of other useful WP plugins to make a WordPress Blog friendly to Search Engines is here.

How to set up Path to .exe GNUWin32 binary files in Windows XP / Vista / 2003 / 2008 (Setting PATH to executables on Windows)

Tuesday, August 23rd, 2011

I’ve been working on a servers running Windows 2003 and Windows 2008 these days.
As I wanted to be more flexible on what I can do from the command line I decided to install GNUwin (provides port of GNU tools), most of which are common part of any Linux distribution).
Having most of the command line flexibility on a Windows server is a great thing, so I would strongly recommend GNUWin to any Windows server adminsitrator out there.

Actually it’s a wonderful thing that most of the popular Linux tools can easily be installed and used on Windows for more check GnuWin32 on sourceforge

One of the reasons I installed Gnuwin was my intention to use the good old Linux tail command to keep an eye interactive on the IIS server access log files, which by the way for IIS webserver are stored by default in C:WindowsSystem32LogFilesW3SVC1*.log

I’ve managed to install the GNUWin following the install instructions, not with too much difficulties. The install takes a bit of time, cause many packs containing different parts of the GNUWin has to be fetched.

To install I downloaded the GNUWin installer available from GNUWin32’s website and instructed to extracted the files into C:Program FilesGnuwin
Then I followed the install instructions suggestions, e.g.:

C:> cd c:Program FilesGnuWin
C:Program FilesGnuWin> download.bat
...
C:Program FilesGnuWin> install c:gnuwin32
...

After the installation was succesfully completed on the two Windows machines, both of which by the way are running 64 bit Windows, it was necessery to add the newly installed GNU .exe files to my regular cmd.exe PATH variable in order to be able to access the sed, tail and the rest of the gnuwin32 command line tools.

In order to add C:GnuWin32bin directory to the windows defined Command line Path , I had to do the following:

a. Select (Properties) for My Computer

Start (button) -> My Computer (choose properties)

b. Select the My Computer Advanced (tab)

Then, from the My Computer pane press on Advanced tab

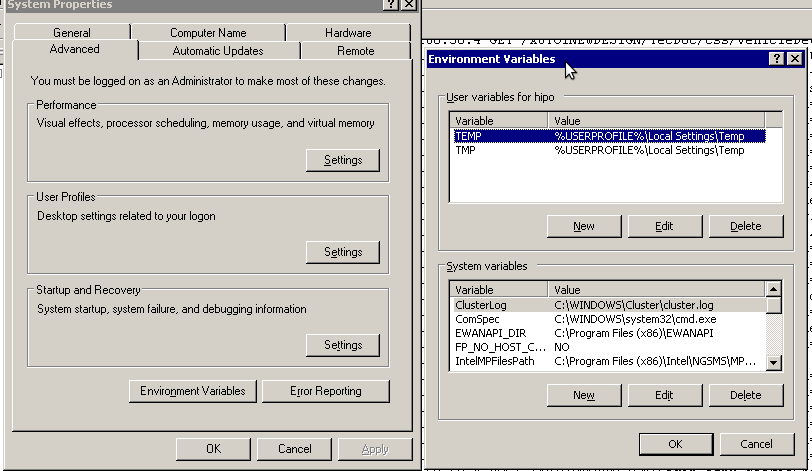
c. Next press on Environment Variables

Windows environment variables screenshot

You see in above’s screenshot the Environment Variables config dialog, to add the new path location in System Variables sectiom, between the list I had to add the c:GNUwin32bin path locatiion. To find I pressed on Edit button scrolled down to find the Variable and hence added at the end of the long list defined paths.
After adding in GNUwin, the Windows path looks like this:

C:Program Files (x86)EWANAPI;C:WINDOWSsystem32;C:WINDOWS;C:WINDOWSSystem32Wbem;C:Program Files (x86)IntelNGSMSMPFiles;C:Program Files (x86)Microsoft SQL Server100ToolsBinn;C:Program FilesMicrosoft SQL Server100ToolsBinn;C:Program FilesMicrosoft SQL Server100DTSBinn;C:Program Files (x86)Microsoft SQL Server100ToolsBinnVSShellCommon7IDE;C:Program Files (x86)Microsoft Visual Studio 9.0Common7IDEPrivateAssemblies;C:Program Files (x86)Microsoft SQL Server100DTSBinn;C:WINDOWSsystem32WindowsPowerShellv1.0;C:gnuwin32bin

Further on, I launched the tail command to intercatively take an eye on who is accessing the IIS webserver.
Sadly this worked not, trying to use tail with the IIS ex10116.log log;

C:WindowsSystem32LogfilesW3SVC1> tail -f ex10116.log

Spit an error tail: ex10116.log: Bad file descriptor

Since I couldn’t use tail -f I looked for alternative and a quick search led me to Tail 4 Win32 . Lest the name suggests it is supposed to work on 32 bit arch Windows the version on tailforwin32’s website is working perfectly fine on 64 bit Windows as well.
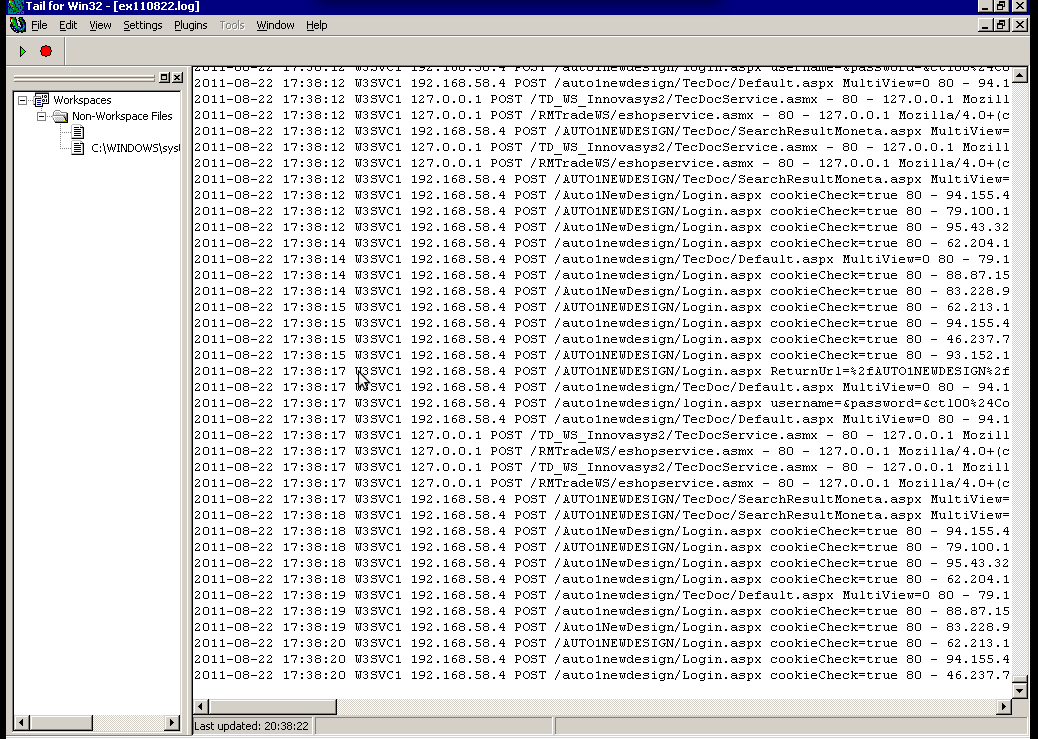
What it does is to simulate a normal tail -f command inside a very simplistic window interface. You see it in action with opened IIS log on below’s screenshot:

GUI Tail for Windows screenshot

Finally my goal is achieved and I can take an eye interactively on IIS logs. End of the article, hope it wasn’t too boring 😉