Posts Tagged ‘create’

Create Bootable Windows installer USB from a MAC PC, MacBook host or Linux Desktop computer

Thursday, February 8th, 2024

Creating Windows bootable installer with Windows Media Creation tool is easy, but sometimes if you're a geek like me you don't have a Windows personal PC at home and your Work PC is so paranoidly restricted by its administrator through paranoid Domain Controller Policies, that you can only copy from a USB drive towards the Win PC but you cannot write to the USB. 

1. Preparing Linux installer USB via Mac's Boot Camp Assistant

If you're lucky you might have a MAC Book Air or some kind of other mac PC, if that is the case you can burn the Windows Installer iso, with the Native Mac tool called BootCamp Assistant, by simply downloading the Win Boot ISO, launching the app and burning it:

Finder > Applications > Utilities and open Boot Camp Assistant.

create-windows-10-bootable-installer-usb-mac-screenshot.png

2. Preparing Bootable Windows installer on Linux host machine

On DEBIAN / UBUNTU and other Deb based Linuxes

# apt install gddrescue 

On CENTOS / FEDORA :

# dnf install ddrescue

To install the Windows Image to the right USB drive, first find it out with fdisk and list it:

# fdisk -l
 

Disk /dev/sdb: 14.41 GiB, 15472047104 bytes, 30218842 sectors
Disk model: DataTraveler 3.0
Units: sectors of 1 * 512 = 512 bytes
Sector size (logical/physical): 512 bytes / 512 bytes
I/O size (minimum/optimal): 512 bytes / 512 bytes
Disklabel type: dos
Disk identifier: 0xc23dc587

Device     Boot    Start      End  Sectors  Size Id Type
/dev/sdb1           8192 30216793 30208602 14.4G  7 HPFS/NTFS/exFAT
/dev/sdb2       30216794 30218841     2048    1M  e W95 FAT16 (LBA)

Then Use ddrescue to create the bootable MS windows Installer USB disk.

# ddrescue windows10.iso /dev/sd1 –force -D

3. Using GUI Linux tool WoeUSB-ng to prepare Microsoft Windows start up USB drive

If you're a lazy Linux user and you plan to prepare up to date Windows image files regularly, perhaps the WoeUSB-ng Graphical tool will suit you better, to use it you will have to install a bunch of python libraries.
 

On Ubuntu Linux:

# apt install git p7zip-full python3-pip python3-wxgtk4.0 grub2-common grub-pc-bin
# pip3 install WoeUSB-ng

On Fedora Linux:

dnf install git p7zip p7zip-plugins python3-pip python3-wxpython4
# sudo pip3 install WoeUSB-ng

Launch the WoeUSB-ng program :


$ python3 /usr/local/bin/woeusbgui


Download, the latest Version of Windows Installer .ISO IMAGE file, plug in your USB flash disk and let the program burn the ISO and create the GRUB boot loader, that will make WIndows installer bootable on your PC.

WoeUSB-ng-python-burn-windows-installer.-tool-screenshot

With WoeUSB-ng you have to be patient, it will take some time to prepare and copy the Windows installer content and will take about 15 to 20 minutes from my experience to finalize the GRUB records required, that will make the new burnt ISO bootable.


Then just plug it in to your Desktop PC or laptop, virtual machine, whatever where you would like to install the Windows from its latest installation Source image and Go on with doing the necessery evil to have Microsoft Spy on you permanently.

P.S. I just learned, from colleagues from Kvant Serviz (a famous hardware second hand, shop and repair shop here in Bulgaria, that nowadays Windows has evolved to the points, they can and they actually do overwrite the PC BIOS / UEFI as part of updates without any asking the end user !!!
At first I disbelived that, but after a short investigation online it turned out this is true, 
there are discussions online from people complaining, that WIndows updates has ovewritten their current BIOS settings and people complaining BIOS versions are ovewritten.

Enjoy your new personal Spy OS ! 🙂

How to configure multiple haproxies and frontends to log in separate log files via rsyslog

Monday, September 5th, 2022

log-multiple-haproxy-servers-to-separate-files-log-haproxy-froentend-to-separate-file-haproxy-rsyslog-Logging-diagram
In my last article How to create multiple haproxy instance separate processes for different configuration listeners,  I've shortly explained how to create a multiple instances of haproxies by cloning the systemd default haproxy.service and the haproxy.cfg to haproxyX.cfg.
But what if you need also to configure a separate logging for both haproxy.service and haproxy-customname.service instances how this can be achieved?

The simplest way is to use some system local handler staring from local0 to local6, As local 1,2,3 are usually used by system services a good local handler to start off would be at least 4.
Lets say we already have the 2 running haproxies, e.g.:

[root@haproxy2:/usr/lib/systemd/system ]# ps -ef|grep -i hapro|grep -v grep
root      128464       1  0 Aug11 ?        00:01:19 /usr/sbin/haproxy -Ws -f /etc/haproxy/haproxy.cfg -p /run/haproxy.pid -S /run/haproxy-master.sock
haproxy   128466  128464  0 Aug11 ?        00:49:29 /usr/sbin/haproxy -Ws -f /etc/haproxy/haproxy.cfg -p /run/haproxy.pid -S /run/haproxy-master.sock

root      346637       1  0 13:15 ?        00:00:00 /usr/sbin/haproxy-customname-wrapper -Ws -f /etc/haproxy/haproxy_customname_prod.cfg -p /run/haproxy_customname_prod.pid -S /run/haproxy-customname-master.sock
haproxy   346639  346637  0 13:15 ?        00:00:00 /usr/sbin/haproxy-customname-wrapper -Ws -f /etc/haproxy/haproxy_customname_prod.cfg -p /run/haproxy_customname_prod.pid -S /run/haproxy-customname-master.sock


1. Configure local messaging handlers to work via /dev/log inside both haproxy instance config files
 

To congigure the separte logging we need to have in /etc/haproxy/haproxy.cfg and in /etc/haproxy/haproxy_customname_prod.cfg the respective handlers.

To log in separate files you should already configured in /etc/haproxy/haproxy.cfg something like:


global
        stats socket /var/run/haproxy/haproxy.sock mode 0600 level admin #Creates Unix-Like socket to fetch stats
        log /dev/log    local0
        log /dev/log    local1 notice

#       nbproc 1
#       nbthread 2
#       cpu-map auto:1/1-2 0-1
        nbproc          1
        nbthread 2
        cpu-map         1 0
        cpu-map         2 1
        chroot /var/lib/haproxy
        user haproxy
        group haproxy
        daemon
        maxconn 99999

defaults
        log     global
        mode    tcp


        timeout connect 5000
        timeout connect 30s
        timeout server 10s

    timeout queue 5s
    timeout tunnel 2m
    timeout client-fin 1s
    timeout server-fin 1s

    option forwardfor
        maxconn 3000
    retries                 15

frontend http-in
        mode tcp

        option tcplog
        log global


        option logasap
        option forwardfor
        bind 0.0.0.0:80

default_backend webservers_http
backend webservers_http
    fullconn 20000
        balance source
stick match src
    stick-table type ip size 200k expire 30m

        server server-1 192.168.1.50:80 check send-proxy weight 255 backup
        server server-2 192.168.1.54:80 check send-proxy weight 254
        server server-3 192.168.0.219:80 check send-proxy weight 252 backup
        server server-4 192.168.0.210:80 check send-proxy weight 253 backup
        server server-5 192.168.0.5:80 maxconn 3000 check send-proxy weight 251 backup

For the second /etc/haproxy/haproxy_customname_prod.cfg the logging configuration should be similar to:
 

global
        stats socket /var/run/haproxy/haproxycustname.sock mode 0600 level admin #Creates Unix-Like socket to fetch stats
        log /dev/log    local5
        log /dev/log    local5 notice

#       nbproc 1
#       nbthread 2
#       cpu-map auto:1/1-2 0-1
        nbproc          1
        nbthread 2
        cpu-map         1 0
        cpu-map         2 1
        chroot /var/lib/haproxy
        user haproxy
        group haproxy
        daemon
        maxconn 99999

defaults
        log     global
        mode    tcp


2. Configure separate haproxy Frontend logging via local5 inside haproxy.cfg
 

As a minimum you need a configuration for frontend like:


frontend http-in
        mode tcp

        option tcplog
        log /dev/log    local5 debug
…..
….

..
.

Of course the mode tcp in my case is conditional you might be using mode http etc. 


3. Optionally but (preferrably) make local5 / local6 handlers to work via rsyslogs UDP imudp protocol


In this example /dev/log is straightly read by haproxy instead of sending the messages first to rsyslog, this is a good thing in case if you have doubts that rsyslog might stop working and respectively you might end up with no logging, however if you prefer to use instead rsyslog which most of people usually do you will have instead for /etc/haproxy/haproxy.cfg to use config:

global
    log          127.0.0.1 local6 debug

defaults
        log     global
        mode    tcp

And for /etc/haproxy_customname_prod.cfg config like:

global
    log          127.0.0.1 local5 debug

defaults
        log     global
        mode    tcp

If you're about to send the haproxy logs directly via rsyslog, it should have enabled in /etc/rsyslog.conf the imudp module if you're not going to use directly /dev/log

# provides UDP syslog reception
module(load="imudp")
input(type="imudp" port="514")


4. Prepare first and second log file and custom frontend output file and set right permissions
 

Assumably you already have /var/log/haproxy.log and this will be the initial haproxy log if you don't want to change it, normally it is installed on haproxy package install time on Linux and should have some permissions like following:

root@haproxy2:/etc/rsyslog.d# ls -al /var/log/haproxy.log
-rw-r–r– 1 haproxy haproxy 6681522  1 сеп 16:05 /var/log/haproxy.log


To create the second config with exact permissions like haproxy.log run:

root@haproxy2:/etc/rsyslog.d# touch /var/log/haproxy_customname.log
root@haproxy2:/etc/rsyslog.d# chown haproxy:haproxy /var/log/haproxy_customname.log

Create the haproxy_custom_frontend.log file that will only log output of exact frontend or match string from the logs
 

root@haproxy2:/etc/rsyslog.d# touch  /var/log/haproxy_custom_frontend.log
root@haproxy2:/etc/rsyslog.d# chown haproxy:haproxy  /var/log/haproxy_custom_frontend.log


5. Create the rsyslog config for haproxy.service to log via local6 to /var/log/haproxy.log
 

root@haproxy2:/etc/rsyslog.d# cat 49-haproxy.conf
# Create an additional socket in haproxy's chroot in order to allow logging via
# /dev/log to chroot'ed HAProxy processes
$AddUnixListenSocket /var/lib/haproxy/dev/log

# Send HAProxy messages to a dedicated logfile
:programname, startswith, "haproxy" {
  /var/log/haproxy.log
  stop
}


Above configs will make anything returned with string haproxy (e.g. proccess /usr/sbin/haproxy) to /dev/log to be written inside /var/log/haproxy.log and trigger a stop (by the way the the stop command works exactly as the tilda '~' discard one, except in some newer versions of haproxy the ~ is no now obsolete and you need to use stop instead (bear in mind that ~ even though obsolete proved to be working for me whether stop not ! but come on this is no strange this is linux mess), for example if you run latest debian Linux 11 as of September 2022 haproxy with package 2.2.9-2+deb11u3.
 

6. Create configuration for rsyslog to log from single Frontend outputting local2 to /var/log/haproxy_customname.log
 

root@haproxy2:/etc/rsyslog.d# cat 48-haproxy.conf
# Create an additional socket in haproxy's chroot in order to allow logging via
# /dev/log to chroot'ed HAProxy processes
$AddUnixListenSocket /var/lib/haproxy/dev/log

# Send HAProxy messages to a dedicated logfile
#:programname, startswith, "haproxy" {
#  /var/log/haproxy.log
#  stop
#}
# GGE/DPA 2022/08/02: HAProxy logs to local2, save the messages
local5.*                                                /var/log/haproxy_customname.log


You might also explicitly define the binary that will providing the logs inside the 48-haproxy.conf as we have a separate /usr/sbin/haproxy-customname-wrapper in that way you can log the output from the haproxy instance only based
on its binary command and you can omit writting to local5 to log via it something else 🙂

root@haproxy2:/etc/rsyslog.d# cat 48-haproxy.conf
# Create an additional socket in haproxy's chroot in order to allow logging via
# /dev/log to chroot'ed HAProxy processes
$AddUnixListenSocket /var/lib/haproxy/dev/log

# Send HAProxy messages to a dedicated logfile
#:programname, startswith, "haproxy" {
#  /var/log/haproxy.log
#  stop
#}
# GGE/DPA 2022/08/02: HAProxy logs to local2, save the messages

:programname, startswith, "haproxy-customname-wrapper " {
 
/var/log/haproxy_customname.log
  stop
}


7. Create the log file to log the custom frontend of your preference e.g. /var/log/haproxy_custom_frontend.log under local5 /prepare rsyslog config for
 

root@haproxy2:/etc/rsyslog.d# cat 47-haproxy-custom-frontend.conf
$ModLoad imudp
$UDPServerAddress 127.0.0.1
$UDPServerRun 514
#2022/02/02: HAProxy logs to local6, save the messages
local4.*                                                /var/log/haproxy_custom_frontend.log
:msg, contains, "https-in" ~

The 'https-in' is my frontend inside /etc/haproxy/haproxy.cfg it returns the name of it every time in /var/log/haproxy.log therefore I will log the frontend to local5 and to prevent double logging inside /var/log/haproxy.log of connections incoming towards the same frontend inside /var/log/haproxy.log, I have the tilda symbol '~' which instructs rsyslog to discard any message coming to rsyslog with "https-in" string in, immediately after the same frontend as configured inside /etc/haproxy/haproxy.cfg will output the frontend operations inside local5.


!!! Note that for rsyslog it is very important to have the right order of configurations, the configuration order is being considered based on the file numbering. !!!
 

Hence notice that my filter file number 47_* preceeds the other 2 configured rsyslog configs.
 

root@haproxy2:/etc/rsyslog.d# ls -1
47-haproxy-custom-frontend.conf
48-haproxy.conf
49-haproxy.conf

This will make 47-haproxy-custom-frontend.conf to be read and processed first 48-haproxy.conf processed second and 49-haproxy.conf processed third.


8. Reload rsyslog and haproxy and test


root@haproxy2: ~# systemctl restart rsyslog
root@haproxy2: ~# systemctl restart haproxy
root@haproxy2: ~# systemctl status rsyslog

● rsyslog.service – System Logging Service
     Loaded: loaded (/lib/systemd/system/rsyslog.service; enabled; vendor preset: enabled)
     Active: active (running) since Thu 2022-09-01 17:34:51 EEST; 1s ago
TriggeredBy: ● syslog.socket
       Docs: man:rsyslogd(8)
             man:rsyslog.conf(5)
             https://www.rsyslog.com/doc/
   Main PID: 372726 (rsyslogd)
      Tasks: 6 (limit: 4654)
     Memory: 980.0K
        CPU: 8ms
     CGroup: /system.slice/rsyslog.service
             └─372726 /usr/sbin/rsyslogd -n -iNONE

сеп 01 17:34:51 haproxy2 systemd[1]: Stopped System Logging Service.
сеп 01 17:34:51 haproxy2 rsyslogd[372726]: warning: ~ action is deprecated, consider using the 'stop' statement instead [v8.210>
сеп 01 17:34:51 haproxy2 systemd[1]: Starting System Logging Service…
сеп 01 17:34:51 haproxy2 rsyslogd[372726]: [198B blob data]
сеп 01 17:34:51 haproxy2 systemd[1]: Started System Logging Service.
сеп 01 17:34:51 haproxy2 rsyslogd[372726]: [198B blob data]
сеп 01 17:34:51 haproxy2 rsyslogd[372726]: imuxsock: Acquired UNIX socket '/run/systemd/journal/syslog' (fd 3) from systemd.  [>
сеп 01 17:34:51 haproxy2 rsyslogd[372726]: [origin software="rsyslogd" swVersion="8.2102.0" x-pid="372726" x-info="https://www.

Do some testing with some tool like curl / wget / lynx / elinks etc. on each of the configured haproxy listeners and frontends and check whether everything ends up in the correct log files.
That's all folks enjoy ! 🙂
 

Monitoring chronyd time service is synchronized, get additional time server values with Zabbix userparameter script

Monday, March 21st, 2022

monitoring-chronyc-time-server-synchronization-zabbix-logo

If you''re running a server infrastructure and your main monitoring system is Zabbix. Then a vital check you might want to setup is to monitor the server time synchronization to a central server. In newer Linux OS-es ntpd time server is started to be used lesser and many modern Linux distributions used in the corporate realm are starting to recommend using chrony as a time synchronization client / server.

In this article, I'll show you how you can quickly setup monitoring of chronyd process and monitoring whether the time is successfully synchronizing with remote Chronyd time server. This will be done with a tiny one liner shell script setup as userparameter It is relatively easy then to setup an Action Alert


1. Create userparameter script to send parsed chronyd time synchronization to Zabbix Server

chronyc tracking provides plenty of useful data which can give many details about info such as offset, skew, root delay, stratum, update interval.

[root@server: ~]# chronyc tracking
Reference ID    : 0A32EF0B (fkf-intp01.intcs.meshcore.net)
Stratum         : 3
Ref time (UTC)  : Fri Mar 18 12:42:31 2022
System time     : 0.000032544 seconds fast of NTP time
Last offset     : +0.000031102 seconds
RMS offset      : 0.000039914 seconds
Frequency       : 3.037 ppm slow
Residual freq   : +0.000 ppm
Skew            : 0.023 ppm
Root delay      : 0.017352410 seconds
Root dispersion : 0.004285847 seconds
Update interval : 1041.6 seconds
Leap status     : Normal

[root@server zabbix_agentd.d]# cat userparameter_chrony.conf 
UserParameter=chrony.json,chronyc -c tracking | sed -e s/'^'/'{"chrony":[“‘/g -e s/’$’/'”]}'/g -e s/','/'","'/g
[root@server zabbix_agentd.d]#

The -c option passed to chronyc is printing the chronyc tracking command ouput data in comma-separated values ( CSV ) format.

2. Create Necessery Item key to get chronyd processes and catch the userparameter data


  • First lets create a an Item key to calculate the chronyd daemon proc.num
    proc.num – simply returns the number of processes in the process list just like a simple
    pgrep servicename command does.


monitroing-chronyc_zabbix_item_report_to-zabbix

Second lets create the Item for the userparameter script, the chrony.json key should be the same as the key given in the userparameter script.

obtain-chronyc-statistic-variables-from-remote-chronyd-to-zabbix-windows

Create Chrony Zabbix Triggers 
 

Expression 

{server-host:proc.num[chronyd].last()}<1


will be triggered if the process of chronyd on the server is less than 1


chronyc_monitoring_process-is-not-running-screenshot

Next configure

{server-host:chrony[Leap status].iregexp[Not synchronised) ]=1


to trigger Alert Chronyd is Not synchronized if the Expression check occurs.

chronyd-is-not-synchronized-trigger-iregexp

Reload the zabbix-agent on the server
 

To make zabbix-agent locally installed on the machine read the userparameter into memory  (in my case this is zabbix-agent-4.0.28-1.el8.x86_64) installed on Redhat 8.3 (Ootpa), you have to restart it.

[root@server: ~]# systemctl restart zabbix-agent
[root@server: ~]# systemctl status zabbix-agent

● zabbix-agent.service – Zabbix Agent
   Loaded: loaded (/usr/lib/systemd/system/zabbix-agent.service; enabled; vendor preset: disabled)
   Active: active (running) since Thu 2021-12-16 16:41:02 CET; 3 months 0 days ago
 Main PID: 862165 (zabbix_agentd)
    Tasks: 6 (limit: 23662)
   Memory: 20.6M
   CGroup: /system.slice/zabbix-agent.service
           ├─862165 /usr/sbin/zabbix_agentd -c /etc/zabbix/zabbix_agentd.conf
           ├─862166 /usr/sbin/zabbix_agentd: collector [idle 1 sec]
           ├─862167 /usr/sbin/zabbix_agentd: listener #1 [waiting for connection]
           ├─862168 /usr/sbin/zabbix_agentd: listener #2 [waiting for connection]
           ├─862169 /usr/sbin/zabbix_agentd: listener #3 [waiting for connection]
           └─862170 /usr/sbin/zabbix_agentd: active checks #1 [idle 1 sec]

Warning: Journal has been rotated since unit was started. Log output is incomplete or unavailable.


In a short while you should be seeing in the chrony.json key History data fed by the userparameter Script.

In Zabbix Latest data, you will see plenty of interesting time synchronization data get reported such as Skew, Stratum, Root Delay, Update Interval, Frequency etc.

chronyd-zabbix-reported-time-synchronization-offset-leap-residual-freq-root-delay-screenshot

To have an email Alerting further, go and setup a new Zabbix Action based on the Trigger with your likings and you're done. 
The tracked machine will be in zabbix to make sure your OS clock is not afar from the time server. Repeat the same steps if you need to track chronyd is up running and synchronized on few machines, or if you have to make it for dozens setup a Zabbix template.

Set proxy only for apt, apt-get, aptitude package manager on Debian / Ubuntu Linux

Wednesday, December 22nd, 2021

debian-package-manager-run-via-a-proxy


Intro

Main console package install apt-get / apt and / aptitude did not use the HTTP Proxy environment variables by default as there is no default proxy set on Debian / Ubuntu / Mint and other deb based distros after OS Install. Under some circunstances for DMZ placed or firewall secured servers, direct access to internet address or even Package repository is only allowed via a proxy and hence the package manager needs to have a proxy host set.
 Setting a global wide proxy on Linux is easily possible by setting http_proxy="http://yourhost.com:8080" and https_proxy or if FTP connection via ftp_proxy somewhere in /etc/profile , /etc/bashrc or via /etc/environment but as using this Shell variables set it global wide for all applications lynx / links / wget / curl, sometimes it is useful to set the Proxy host only for deb package management tools.

Note that if you want to set a proxy host for deb operations this can be done during initial OS install installation, the Apt configuration file would have been automatically updated then. 

Creating  an Apt Proxy Conf File

Apt loads all configuration files under /etc/apt/apt.conf.d. We can create a configuration specifically for our proxy there, keeping it separate from all other configurations.

  1. Create a new configuration file named proxy.conf.


    # touch /etc/apt/apt.conf.d/proxy.conf
    
  2. Open the proxy.conf file in a text editor.


    # vi /etc/apt/apt.conf.d/proxy.conf
    
  3. Add the following line to set your HTTP proxy for apt.


    Acquire::http::Proxy "http://username:password@proxy.server:port/";
    
  4. Add the following line to set your HTTPS proxy.


    Acquire::https::Proxy "http://username:passw0rd@proxy.server:port/";
    
  5. Save your changes and exit the text editor.
     

Your proxy settings will be applied the next time you run Apt.

Simplifying the Configuration

As mentioned by a user in the comments below, there is an alternative way for defining the proxy settings. While similar, it removes some redundancy.

Just like in the first example, create a new file under the /etc/apt/apt.conf.d directory for example /etc/apt/apt.conf.d/proxies, and then add the lines as.

Acquire {
HTTP::proxy "http://127.0.0.1:8080";
HTTPS::proxy "http://127.0.0.1:8080";
}


How to set up dsmc client Tivoli ( TSM ) release version and process check monitoring with Zabbix

Thursday, December 17th, 2020

zabbix-monitor-dsmc-client-monitor-ibm-tsm-with-zabbix-howto

As a part of Monitoring IBM Spectrum (the new name of IBM TSM) if you don't have the money to buy something like HP Open View monitoring or other kind of paid monitoring system but you use Zabbix open source solution to monitor your Linux server infrastructure and you use Zabbix as a main Services and Servers monitoring platform you will want to monitor at least whether the running Tivoli dsmc backup clients run fine on each of the server (e.g. the dsmc client) runs normally as a backup solution with its common /usr/bin/dsmc process service that connects towards remote IBM TSM server where the actual Data storage is kept.

It might be a kind of weird monitoring to setup to have the tsm version frequently reported to a Zabbix server on a first glimpse, but in reality this is quite useful especially if you want to have a better overview of your multiple servers environment IBM (Spectrum Protect) Storage manager backup solution actual release.
 
So the goal is to have reported dsmc interactive storage manager version as reported from
 

[root@server ~]# dsmc

IBM Spectrum Protect
Command Line Backup-Archive Client Interface
  Client Version 8, Release 1, Level 11.0
  Client date/time: 12/17/2020 15:59:32
(c) Copyright by IBM Corporation and other(s) 1990, 2020. All Rights Reserved.

Node Name: Sub-Hostname.FQDN.COM
Session established with server TSM_SERVER: AIX
  Server Version 8, Release 1, Level 10.000
  Server date/time: 12/17/2020 15:59:34  Last access: 12/17/2020 13:28:01


into zabbix and set reports in case if your sysadmins have changed version of a IBM TSM to a newer version. Thus for non sysadmins and less technical persons as Service Delivery Managers (SDMs) it is much easier to track changes of multiple servers Tivoli version to a newer one.

Enough talk let me next show you how to setup the required with a small UserParameter one liner bash shell script.
 

1. Create TSM Userparameter script


With Userparameter key and content as below:

[root@server ~]# vim /etc/zabbix/zabbix_agentd.d/userparameter_TSM.conf


UserParameter=dsmc.version,cat /var/tsm/sched.log | grep Clie | tail -n 1 | awk '{print $7 " " $8 " " $9 " " $10 " " $11 " " $12 " " $13}'


The script output of TivSM version will be reported as so:

[root@server ~]# cat /var/tsm/sched.log | grep Clie | tail -n 1 | awk '{print $7 " " $8 " " $9 " " $10 " " $11 " " $12 " " $13}'
Client Version 8, Release 1, Level 11.0


If you want to get only a major version report from dsmc:

UserParameter=dsmc.version,cat /var/tsm/sched.log | grep Clie | tail -n 1 | awk '{print $7 " " $8 " " $9}'


The output as a major version you will get is

[root@server ~]# cat /var/tsm/sched.log | grep Clie | tail -n 1 | awk '{print $7 " " $8 " " $9}'
Client Version 8,


2. Restart the zabbix agent to load userparam script

To load above configured Userparameter script we need to restart zabbix-agent client

[root@server ~]# systemctl restart zabbix-agent

[root@server ~]#  systemctl status zabbix-agent
● zabbix-agent.service – Zabbix Agent
   Loaded: loaded (/usr/lib/systemd/system/zabbix-agent.service; enabled; vendor preset: disabled)
   Active: active (running) since Wed 2020-07-22 16:17:17 CEST; 4 months 26 days ago
 Main PID: 7817 (zabbix_agentd)
   CGroup: /system.slice/zabbix-agent.service
           ├─7817 /usr/sbin/zabbix_agentd -c /etc/zabbix/zabbix_agentd.conf
           ├─7818 /usr/sbin/zabbix_agentd: collector [idle 1 sec]
           ├─7819 /usr/sbin/zabbix_agentd: listener #1 [waiting for connection]
           ├─7820 /usr/sbin/zabbix_agentd: listener #2 [waiting for connection]
           ├─7821 /usr/sbin/zabbix_agentd: listener #3 [waiting for connection]
           └─7822 /usr/sbin/zabbix_agentd: active checks #1 [idle 1 sec]


3. Create template for TSM Service check and TSM Version


You will need to create 1 Trigger and 2 Items for the Service check and for TSM version reporting

tsm-service-version-screenshot-zabbix
As you see necessery names / keys to create are:

Name / Key: TSM – Service State proc.num{dsmcad}

Name / key: TSM version dmsc.version


3.1 Create the trigger


Now lets create the trigger that will report the Service State

tsm-service-state-zabbix-screenshot


Linux TSM:proc.num[dsmcad].last()}=0


3.2 Create the Items


zabbix-dsmc-proc-num-item-setting-screenshot-linux


Name: dsmcad
Key: proc.num{dsmcad}


tsm-version-item-zabbix-screenshot
 

Update interval: 1d
History Storage period: 90d
Applications: TSM


3.3 Create Zabbix Action

As usual if you want to receive some Email Alerting or lets say send SMS in case of Trigger is matched create the necessery Action with
instructions on how to solve the problem if there is a Standard Operation Procedure ( SOP ) as often called in the corporate world for that.

That's all folks ! 🙂


How to calculate connections from IP address with shell script and log to Zabbix graphic

Thursday, March 11th, 2021

We had to test the number of connections incoming IP sorted by its TCP / IP connection state.

For example:

TIME_WAIT, ESTABLISHED, LISTEN etc.


The reason behind is sometimes the IP address '192.168.0.1' does create more than 200 connections, a Cisco firewall gets triggered and the connection for that IP is filtered out. To be able to know in advance that this problem is upcoming. a Small userparameter script is set on the Linux servers, that does print out all connections from IP by its STATES sorted out.


The script is calc_total_ip_match_zabbix.sh is below:

#!/bin/bash
#  check ESTIMATED / FIN_WAIT etc. netstat output for IPs and calculate total
# UserParameter=count.connections,(/usr/local/bin/calc_total_ip_match_zabbix.sh)
CHECK_IP='192.168.0.1';
f=0; 


for i in $(netstat -nat | grep "$CHECK_IP" | awk '{print $6}' | sort | uniq -c | sort -n); do

echo -n "$i ";
f=$((f+i));
done;
echo
echo "Total: $f"


root@pcfreak:/bashscripts# ./calc_total_ip_match_zabbix.sh 
1 TIME_WAIT 2 ESTABLISHED 3 LISTEN 

Total: 6


root@pcfreak:/bashscripts# ./calc_total_ip_match_zabbix.sh 
2 ESTABLISHED 3 LISTEN 
Total: 5


images/zabbix-webgui-connection-check1

To make process with Zabbix it is necessery to have an Item created and a Depedent Item.


webguiconnection-check1

webguiconnection-check1
 

webgui-connection-check2-item

images/webguiconnection-check1

Finally create a trigger to trigger alarm if you have more than or eqaul to 100 Total overall connections.


images/zabbix-webgui-connection-check-trigger

The Zabbix userparameter script should be as this:

[root@host: ~]# cat /etc/zabbix/zabbix_agentd.d/userparameter_webgui_conn.conf
UserParameter=count.connections,(/usr/local/bin/webgui_conn_track.sh)


Some collleagues suggested more efficient shell script solution for suming the overall number of connections, below is less time consuming version of script, that can be used for the calculation.
 

#!/bin/bash -x
# show FIN_WAIT2 / ESTIMATED etc. and calcuate total
count=$(netstat -n | grep "192.168.0.1" | awk ' { print $6 } ' | sort -n | uniq -c | sort -nr)
total=$((${count// /+}))
echo "$count"
echo "Total:" "$total"

      2 ESTABLISHED
      1 TIME_WAIT
Total: 3


Below is the graph built with Zabbix showing all the fluctuations from connections from monitored IP. ebgui-check_ip_graph


How to add local user to admin access via /etc/sudoers with sudo su – root / Create a sudo admin group to enable users belonging to group become superuser

Friday, January 15th, 2021

sudo_logo-how-to-add-user-to-sysadmin-group

Did you had to have a local users on a server and you needed to be able to add Admins group for all system administrators, so any local user on the system that belongs to the group to be able to become root with command lets say sudo su – root / su -l root / su – root?
If so below is an example /etc/sudoers file that will allow your users belonging to a group local group sysadmins with some assigned group number

Here is how to create the sysadmins group as a starter

linux:~# groupadd -g 800 sysadmins

Lets create a new local user georgi and append the user to be a member of sysadmins group which will be our local system Administrator (superuser) access user group.

To create a user with a specific desired userid lets check in /etc/passwd and create it:

linux:~# grep :811: /etc/passwd || useradd -u 811 -g 800 -c 'Georgi hip0' -d /home/georgi -m georgi

Next lets create /etc/sudoers (if you need to copy paste content of file check here)and paste below configuration:

linux:~# mcedit /etc/sudoers

## Updating the locate database
# Cmnd_Alias LOCATE = /usr/bin/updatedb


## Storage
# Cmnd_Alias STORAGE = /sbin/fdisk, /sbin/sfdisk, /sbin/parted, /sbin/partprobe, /bin/mount, /bin/umount

## Delegating permissions
# Cmnd_Alias DELEGATING = /usr/sbin/visudo, /bin/chown, /bin/chmod, /bin/chgrp

## Processes
# Cmnd_Alias PROCESSES = /bin/nice, /bin/kill, /usr/bin/kill, /usr/bin/killall

## Drivers
# Cmnd_Alias DRIVERS = /sbin/modprobe

Cmnd_Alias PASSWD = /usr/bin/passwd [a-zA-Z][a-zA-Z0-9_-]*, \\
!/usr/bin/passwd root

Cmnd_Alias SU_ROOT = /bin/su root, \\
                     /bin/su – root, \\
                     /bin/su -l root, \\
                     /bin/su -p root


# Defaults specification

#
# Refuse to run if unable to disable echo on the tty.
#
Defaults   !visiblepw

#
# Preserving HOME has security implications since many programs
# use it when searching for configuration files. Note that HOME
# is already set when the the env_reset option is enabled, so
# this option is only effective for configurations where either
# env_reset is disabled or HOME is present in the env_keep list.
#
Defaults    always_set_home
Defaults    match_group_by_gid

Defaults    env_reset
Defaults    env_keep =  "COLORS DISPLAY HOSTNAME HISTSIZE KDEDIR LS_COLORS"
Defaults    env_keep += "MAIL PS1 PS2 QTDIR USERNAME LANG LC_ADDRESS LC_CTYPE"
Defaults    env_keep += "LC_COLLATE LC_IDENTIFICATION LC_MEASUREMENT LC_MESSAGES"
Defaults    env_keep += "LC_MONETARY LC_NAME LC_NUMERIC LC_PAPER LC_TELEPHONE"
Defaults    env_keep += "LC_TIME LC_ALL LANGUAGE LINGUAS _XKB_CHARSET XAUTHORITY"

#
# Adding HOME to env_keep may enable a user to run unrestricted
# commands via sudo.
#
# Defaults   env_keep += "HOME"
Defaults    secure_path = /sbin:/bin:/usr/sbin:/usr/bin

## Next comes the main part: which users can run what software on
## which machines (the sudoers file can be shared between multiple
## systems).
## Syntax:
##
##      user    MACHINE=COMMANDS
##
## The COMMANDS section may have other options added to it.
##
## Allow root to run any commands anywhere
root    ALL=(ALL)       ALL

## Allows members of the 'sys' group to run networking, software,
## service management apps and more.
# %sys ALL = NETWORKING, SOFTWARE, SERVICES, STORAGE, DELEGATING, PROCESSES, LOCATE, DRIVERS

## Allows people in group wheel to run all commands
%wheel  ALL=(ALL)       ALL

## Same thing without a password
# %wheel        ALL=(ALL)       NOPASSWD: ALL

## Allows members of the users group to mount and unmount the
## cdrom as root
# %users  ALL=/sbin/mount /mnt/cdrom, /sbin/umount /mnt/cdrom
## Allows members of the users group to shutdown this system
# %users  localhost=/sbin/shutdown -h now

%sysadmins            ALL            = SU_ROOT, \\
                                   NOPASSWD: PASSWD

## Read drop-in files from /etc/sudoers.d (the # here does not mean a comment)
#includedir /etc/sudoers.d

zabbix  ALL=(ALL) NOPASSWD:/usr/bin/grep


Save the config and give it a try now to become root with sudo su – root command

linux:~$ id
uid=811(georgi) gid=800(sysadmins) groups=800(sysadmins)
linux:~$ sudo su – root
linux~#

w00t Voila your user is with super rights ! Enjoy 🙂


How to backup Outlook Mailbox / Export Exchange Mail backup to .pst

Tuesday, November 17th, 2020

pst-outlook-exchange-windows-logo

In the corporate world most of us are forced to use as a desktop environment some kind of Windows version 7 / 8 / 10  version with Outlook configured to use Microsoft Exchange MailServer mailbox set to use POP3 or IMAP account.
Sometimes for new employees for Knowledge transfer purposes having a backup copy of some employee who was laid off or as most of the times has left the company for a better position or simply due to boredom.

Even just for backup purposes in case if by mistake you have deleted some mails out of your mailbox it is useful thing to create a Mailbox backup of whole mail address data especially as with time the amount of Emails grows to many, many thousand of emails year by year and under some circumstances where you have a Mailbox data Limit to up to lets say 4 Gigabytes per mailbox it is useful to periodically clean up old mails, but for the historical reference to create a backup of old email.

Even at some times it is useful to create a whole backup of mailbox every year and then delete the content of Mail data for this year from Outlook.

Export of mail data in Outlook configured email is exported to .PST file format – [ MS-PST ]: Outlook Personal Folders.

Each Personal Folders File (.PST) represents a Message store that contains an arbitrary hierarchy of Folder objects, which contains Message objects, which can contain Attachment objects. Information about Folder objects, Message objects, and Attachment objects are stored in properties, which collectively contain all of the information about the particular item.

If you want to back up the message folders locally to work PC (in addition to keeping them on the Exchange server), you can automatically move or delete older items with AutoArchive (feature of Outlook) or export the items to .pst file that you can restore later as needed and use by importing.

So how to backup / export your Email correspondence to .PTS?

1. Select File -> Open & Export -> Import/Export

outlook-backup-emails-to-pst-file-howto-1

2. Select Export to a file, and then select Next.

outlook-backup-emails-to-pst-file-howto-2

3. Select Outlook Data File (.pst), and select Next.

outlook-backup-emails-to-pst-file-howto-3

4. Select the mail folder you want to back up and select Next.

outlook-backup-emails-to-pst-file-howto-4

5. Choose a location and name for your backup file, and then select Finish.

outlook-backup-emails-to-pst-file-howto-7

To ensure no one has access to your .pst files, after finish you'll be prompted to enter and confirm a password (or if you don't want pass leave pass field as empty), and then select OK.

The produced .pst file will be stored by default under C:\Users\Username\Documents\Outlook Files.

The messages that you keep in a .pst file are no different from other standard messages in outlook. You can forward, reply, or search through the stored messages as you do with other messages.
 

Set Domain multiple alias (Aliases) in IIS on Windows server howto

Saturday, October 24th, 2020

https://www.pc-freak.net/images/microsoft-iis-logo

On Linux as mentioned in my previous article it is pretty easy to use the VirtualHost Apache directive etc. to create ServerName and ServerAlias but on IIS Domain multiple alias add too me a while to google.

<VirtualHost *>
ServerName whatevever-server-host.com
ServerAlias www.whatever-server-host.com whatever-server-host.com
</VirtualHost>


In click and pray environments as Winblows, sometimes something rather easy to be done can be really annoying if you are not sure what to do and where to click and you have not passed some of the many cryptic microsoft offered ceritification programs offer for professional sysadmins, I'll name a few of them as to introduce UNIX guys like me to what you might ask a M$ admin during an interview if you want to check his 31337 Windows Sk!lls 🙂


  • Microsoft Certified Professional (MCP)
  • Microsoft Technology Associate (MTA) –
  • Microsoft Certified Solutions Expert (MCSE)-
  • Microsoft Specialist (MS) etc. –

A full list of Microsoft Certifed Professsional program here

Ok enough of  balling.

Here is  how to  create a domain alias in IIS on Windows server.

Login to your server and click on the START button then ‘Run’¦’, and then type ‘inetmgr.exe’.

Certainly you can go and click trough the Administrative tools section to start ISS manager, but for me this is fastest and easiest way.

create-domain-alias-on-windows-server-1a
 

Now expand the (local computer), then ‘Web Sites’ and locate the site for which you want to add alias (here it is called additional web site identification).

Right click on the domain and choose ‘Properties’ option at the bottom.

This will open the properties window where you have to choose ‘Web Site’ and then to locate ‘Website identification‘ section. Click on the ‘Advanced’¦’ button which stands next to the IP of the domain.

create-domain-alias-on-windows-server-2a
Advanced Web site identification window (Microsoft likes to see the word ‘Advanced’ in all of the management menus) will be opened, where we are going to add a new domain alias.

create-domain-alias-on-windows-server-3a.png

Click on the ‘Add’¦’ button and ‘Add/Edit website (alias)identification’ window will appear.

create-domain-alias-on-windows-server-4a.png

Make sure that you will choose the same IP address from the dropdown menu, then set the port number on which your web server is running (the default is 80), write the domain you want, and click ‘OK’ to create the new domain alias.

Actually click ‘OK’ until you have ‘Advanced Web site identification’ and the domain properties windows closed.

Right click on the domain again and ‘Stop’ and ‘Start’ the service.
This will be enough the IIS domain alias to start working.

create-domain-alias-on-windows-server-5a


Another useful thing for novice IIS admins that come from UNIX is a domain1 to domain2 redirect, this is done with writting an IIS rule which is an interesting but long topic for a limited post as like this, but just for the reference of fun to let you know this exist.

Domain 1 to Domain 2 Redirect
This rule comes handy when you change the name of your site or may be when you need to catch and alias and direct it to your main site. If the new and the old URLs share some elements, then you could just use this rule to have the matching pattern together with the redirect target being

domain1-to-domain2-redirect-iis

That's all folks, if you enjoyed the clicking laziness you're ready to retrain yourself to become a successful lazy Windows admin who calls Microsoft Support everyday as many of the errors and problems Windows sysadmins experience as I heard from a friend can only be managed by M$ Support (if they can be managed at all). 

Yes that's it the great and wonderful life of the avarage sysadmin. Long live computing … it's great! Everyday something broken needs to get fixed everyday something to rethink / relearn / reupdate and restructure or migrate a never ending story of weirdness.

A remark to  make, the idea for this post is originated based on a task I had to do long time ago on IIS, the images and the description behind them are taking from a post originally written on Domain Aliasing in IIS originally written by Anthony Gee unfortunately his blog is not available anymore so credits goes to him.

Saint Petka Paraskeva of Bulgaria of Epivates Thracia (famous as St. Petka of Tarnovo) feast day 14 October

Friday, October 16th, 2020


Sveta-Petka-Paraskeva-Bylgarska-Balkanska-Epivatska

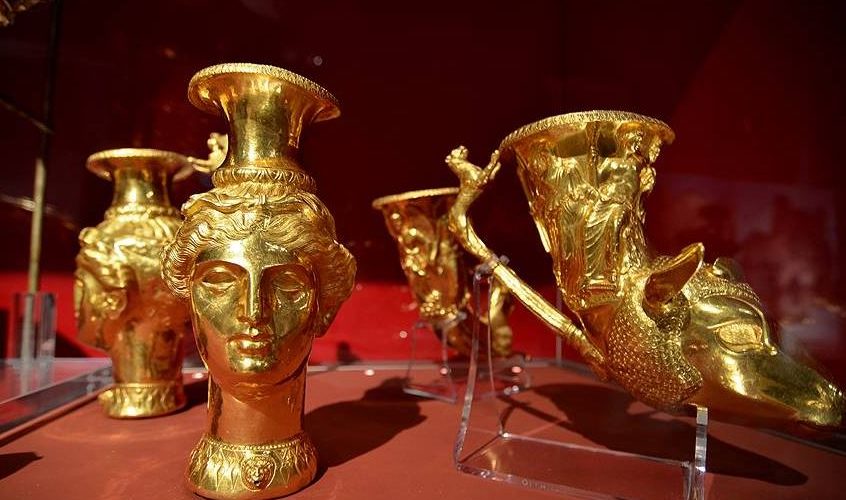
The inhabitants of Thracia are of a great and royal origin and due to recent historical studies, Thracians have been one of the most developed nations for its time they're developments and achievements especially in crafts such as vessel creation even up to day are perhaps the most unique.
It is still unknown of the exact technology used to create such a elegant and precise vessels. A little is known of the Thracians society as they have reached their bloom in a high speed and the place of the later Roman Empire province Thracia has been in a place where it was destroyed to the ground and robbed at multiple times eradicating unique piece of one of the best created ever forms of art.
Territories of Thrakia has been geographically today located in Southeast Europe, now split among Bulgaria, Greece, and Turkey, which is bounded by the Balkan Mountains to the north, the Aegean Sea to the south, and the Black Sea to the east.

Thrace_and_Thracians-present-day_state_borderlines-picture

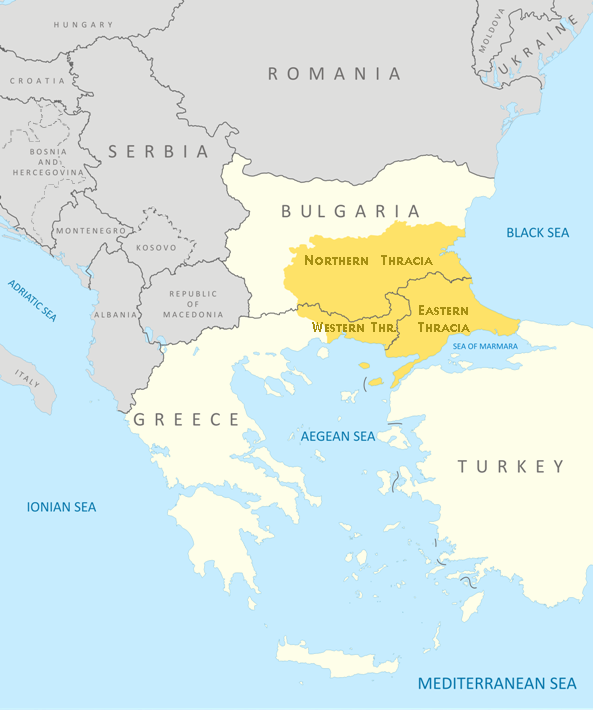
Territy of Thracia shown on a contemporary European (Balkans Maps)

World-famous-Thracian-Treasury-picture-1

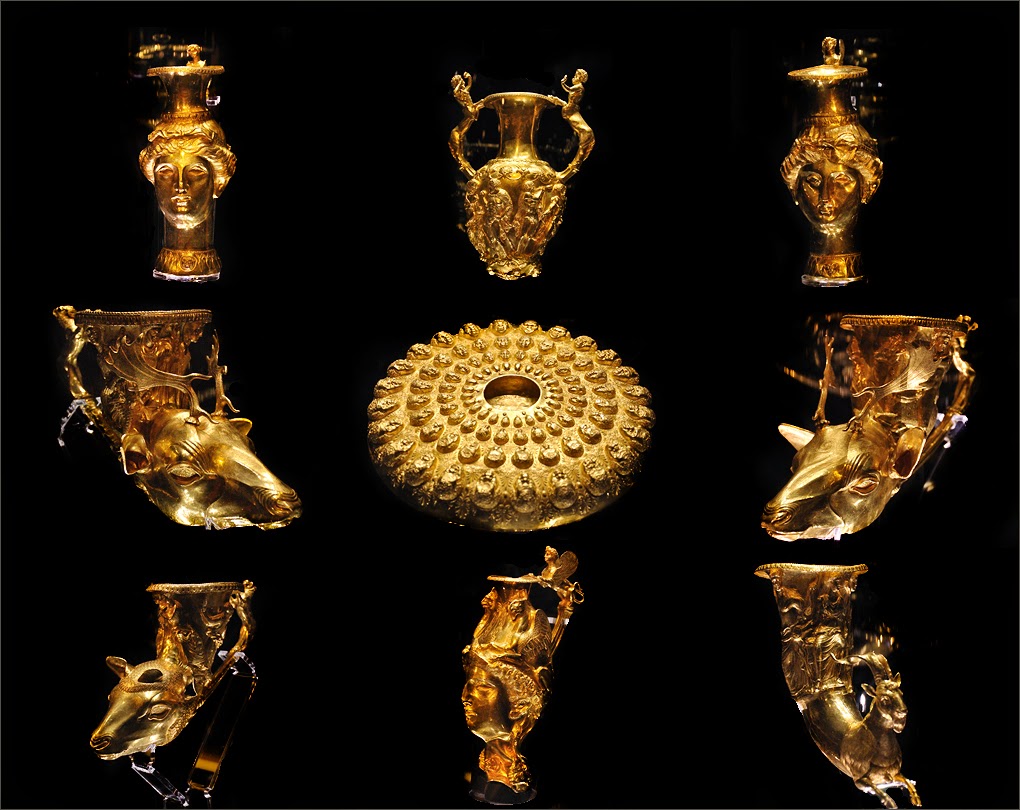
One of the most famous piece of such art is the World Famous Thracian's Treasuary.

World-famous-Thracian-Treasury-picture

The thrakians Empire and civillization has its bloom from 5th – 4th century before Christ era (B.C.). 
Saint Petka of Epivates region Thrakia was of a Bulgarian origin and lived much later in Xth – XI-th century A.D in Thracia. It is known she was of Bulgarian origin (her mother and father was of Bulgarian origin.) of the first generations who has received in 9-th century Baptism, in the times of the Baptism of Bulgaria conducted by the Apostle equal Saint King Boris I the Baptizer of Bulgaria in year 864 AD.  Thracians as an ancient and a blessed nation in craftship and arts was among the nations who received baptism on a good 'soil', as the seed of beauty and goodness has already been in their civillization.
 

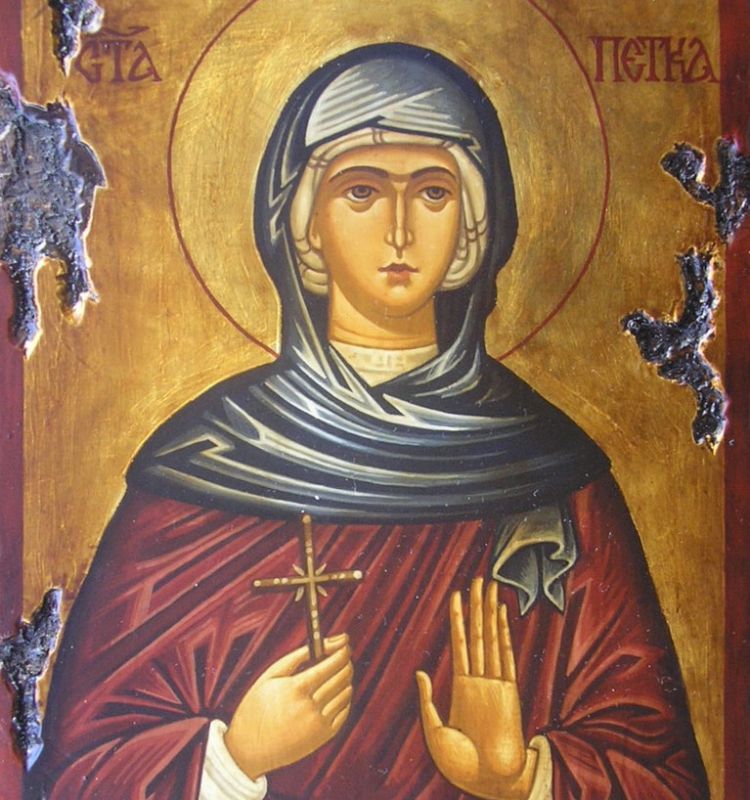
The short Living of Saint Petka of Bulgaria (of Epivates)


Out of this Christian atmosphere has rised Saint Petka also known as (Parashkeva). Saint Petka name means literally translated Friday and due to being born in Thracia on today territory of Balkans she is been venerated highly not only in Bulgaria but across all Orthodox Christians nations on the Balkans – Bulgarians, Romanians, Serbs, Greeks, Macedonians. Due to that Saint Petka is also famous as "Saint Petka of The Bulkans".
Saint Petka could be therefore heard to be called often Petka of Serbs (of Belgrade), Saint Petka of Moldova (of Iași), Mother Paraskeva / ParashkevaParascheva the New, Parascheva the Young, Ancient Greek: Ὁσία Παρασκευὴ ἡ Ἐπιβατινή, Greek: Οσία Παρασκευή η Επιβατινή ή Νέα, Romanian: Cuvioasa Parascheva, Bulgarian / Serbian : Света Петка / Sveta Petka or Петка Параскева / Petka Paraskeva, Paraskeva Pyatnitsa, Parascheva of Tirnovo).

The first information about her living is found in a local educated person (writter) which as of the time were too little and writter  in Greek in short. It did not follow the Church cannons and due to that by an order of Patriarch of Constantinople Nikolas IV Musalon of Constantinople deacon Vaslik has described in a more well systemized way her living, the Greek original unfortunately is now lost. At the time of writting her biography, she has been mostly popular in the realms of Byzantine Empire Thracia.

Bulgarian-Empire-under-King-Ivan-Asen-II-map-1917

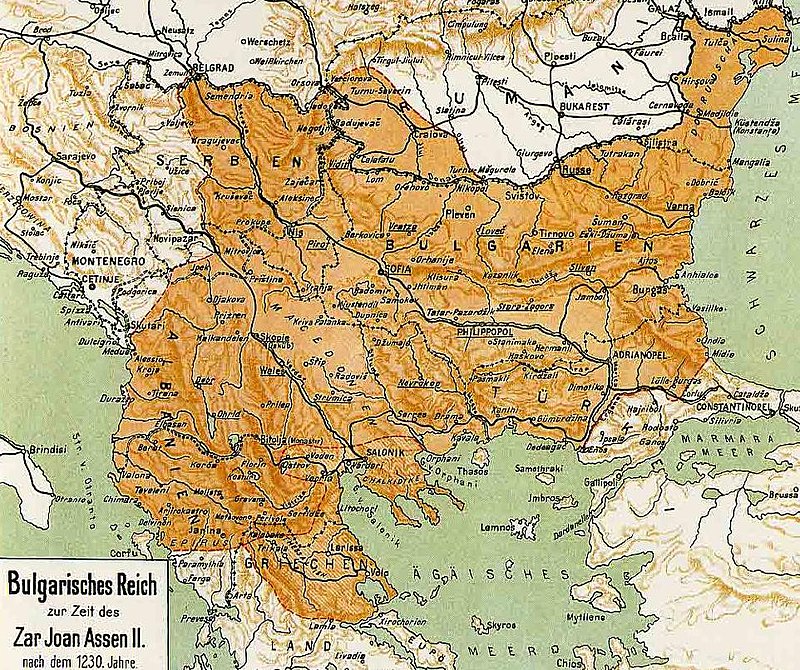
The Bulgarian Empire during the reign of Ivan Asen II. Atlas of Dimitar Rizov year 1917

Since the time of King Ivan Asen II a new biogprahy of saint has been written in Bulgarian which included narration of the transfer of her holy relics to Medieval Capital of Bulgaria Tarnovo. However peak and the key towards the immerse veneration to St. Petka that is evident to this very date has played the biography written by last Bulgarian Patriarch also a saint – st. Euthymius of Tarnovo. in year 1385 AD short before the fall under Turkish Slavery of Bulgaria in y. 1393.

Saint Patriarch Eutymious was the last person who in 1393 has actively parcipated in the protection of the fortified Tarnovo and see with his eyes the fall down of the city (by treachery).

When asked by the terrified people 'To whom do you leave us holy father, when the Turkish were taking him away?' He replied heart tearingly 'To the Holy Trinity The Father, The Son and The Holy Trinity our God I leave you and to the most Blessed Mother of God Theotokos now and For Eternity !!!'

Saint-Patriarch-Eutymious-the-last-Blessing-picture-sveti_Evtimij_seten_blagoslov

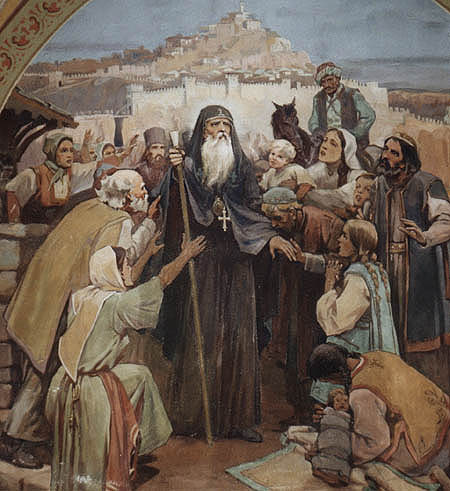
Saint Patriarch Eutymius (Evtimij) blessing the people in Medieval Bulgarian city Tarnovo for a last time before the Turkish took him away for imprisonment
Picture source Pravoslavieto.com

St Euthymius of Tarnovo work is one of the most unique bibliographies and a precious piece of medieval literature it is innovative for its time and spectacular, emotion rich creation, who become famous far before the borders of Bulgaria in the whole Slavonic world of that time, especially in todays territory of ex soviet countries Romania, Moldova, Ukraine and even far Russia.

Saint_Patriarch-Eutymius-last-bulgarian-patriarch-before-Turkish-Slavery

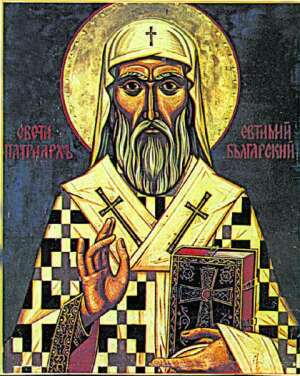
Saint Patriarch Eutymious of Bulgaria
Picture source Pravoslavieto.com

The veneration of Saint Petka of Bulgaria as a protector of family and a warm prayerer for all those who venerate her in this country has slowly spread in the coming centuries by pupils of St. Euthymius of Tarnovo who according to some historians whose works came to us in the form of the a bit more standardized Church Slavonic used in the Eastern Orthodox Churches as a fruit of the works of St. Euthymus.

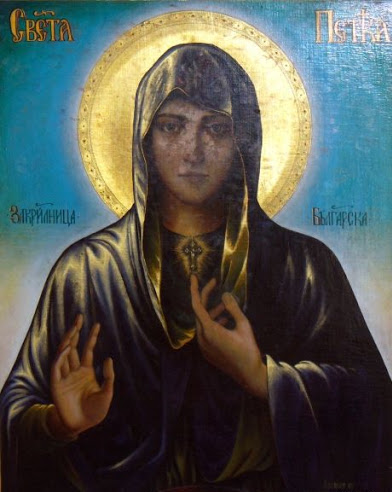
The Living of Saint Petka Parashkeva

Sveta_Petka-Bylgarska-Balkanska-holy-icon

Saint Petka Parashkeva Picture source Pravoslavieto.com

Tropion 4-th voice

 Desertous and silent living you loved after Christ your groom, diligently you ran to and his good yoke you took in your younghood,
with the Sign of the Cross against the thought enemies you have manly armed, with fasting feats and prayer and with tear drops the coals of passions extinguished oh highly famed Paraskevo. And now in the Heavenly halls with the wise virgins you stay in front of Christ, pray for us who venerate your holy remembrance.

Kontakion, voice 6

Let us piusly sung our reverend  mother Saint Petka, because by living the corruptable in live, received the imperishable in eternity, becoming holy intercessor for all in trouble and exhausting from the evils of life. For the reason she received from God imperishable fame, glory and grace to be a wonder worker.

Sveta-Petka-Zakrilnica-Bylgarska-Saint_Petka-Protectress-of-Bulgarian-lands

NB ! St. Petka of Epivates has not to be confused with Saint Petka (from Inokia who lived in 303 AD venerated on 28 of October) or  St Petka the Roman (feast day 26 July).

St. Petka's  has been born in city of Epivates in Byzantium (today city called Selim Pasha nearby Odrin's Aegian City) in 10-th Century from a famous and respectful family, her father Nikita has been very rich landowner.

She lived in the second part of X-th century. According to hear living by Patriarch Eutymious, her smaller brother Eutymious who become a monk has been a Metropolitan of Maditos for 40 years and in year (989 – 996) died aged 81 and is shortly after canonized as saint, his younger sister St. Paraskeva passed away after him in the new 11-th century and is aged at least 85 in the time of passing in the city of Kallikrateia. 

The living continues that near the age of 10 year old she heard in a Christian temple a voice by Jesus Christ himself in resemblance to Saint Apostle Paul and said the Evangelical New Testamental words:
"Whoever wants to walk after me, let him deny himself, to take his cross and follow me !".

The unexpected vision convinced the young Paraskeva to immediately exchange her new clothes to a beggers to leave all her belongings to the poor and live a silent living similarto begger for a time in work and prayer, though she did not leave her parents home. On a few occasions all she had worked for has been distributed to the poor.

Sveta-Petka-Bylgarska-Balkanska

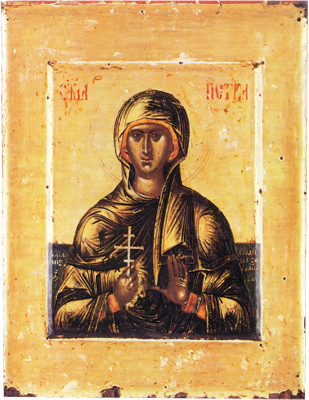
Greek typical depiction of Saint Petka of Epivates

When her parents died, her brother as already a monk and Bishop. St. Petka leave her house and travelled to Constanople and received a nun tonsure and as a nun she lived for 5 years near the deserted Church of the "Protection of the Virgin Mary" in the capital suburb of Heraklia. She travelled to the Holy lands visiting Jerusalem and Church of Holy Sepulchre.
Following the example of the blessed famed Saint Mary of Egypt, she lived in Jordan's desert many years till eldership.

Feeling and foreseeing her death, she travelled back through Constantinople to city of Epivates. Settle near the Church "Holy Apostles", where after 2 years of living in deep prayer and fasting labours living in solitary in holiness passed away silently to Christ in heavenly life. Compassionate Christians immediately buried her body of the nun outside of the city walls as a foreigner. A shortly after numerous miracles started happening on her grave.

St_Petka-Parashkeva-Epivatska-Klisura_Monastery_Holy_Icon

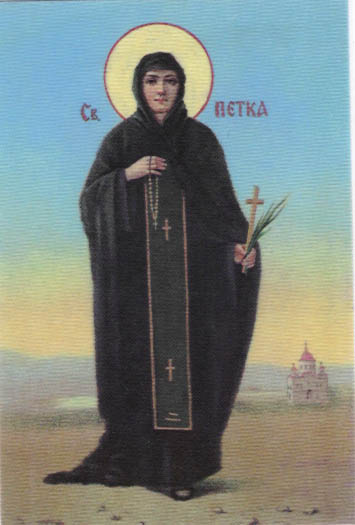
Saint Petka Parashkeva Bulgarian Icon from Klisura Monastery located nearby Sofia Bulgaria

In 1230 King Ivan Asen II the most powerful South-eastern European ruler demanded from the the Knights of the Crusaders to submit him her holy relics who are found still in Tracian city Kaliakratea ruled at that time by the Holy Latin Empire. King Ivan Asen II together with the patriach Joachim the first receives her holy relics with honor and settles her incorruptabilities into the newly creates Church in honour of herself St. Petka behind Tsarevets Fortress. Saint Petka became from that point considered as a protectress of the city, the throne and the country.
Her holy relics arrived from Kallikrateia in Tarnovo, the Capital of Second Bulgarian Empire in year 1230 AD, she has been thus called Paraskeva of Tarnovo and has been venerated as a protectress of the Tarnovo city the Bulgarian nation and the country. The attitude towards Saint Petka Tarnovska as a protectress of Bulgarian nation and contry is been clearly seen by the mention in the Bulgarian and International acts (documents) and manuscripts of that XII – XII century.

Saint_Petka-Epivatska-Bylgarska-Romanian-in-Iashi-Romania-veneration-of-romanian-monks

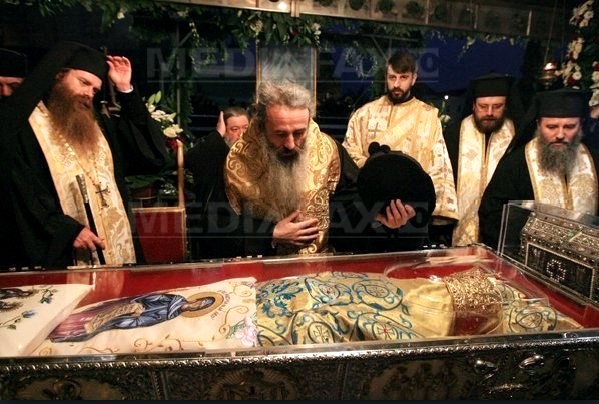
Romanian Monks and Priests venerate the holy relics of Saint Petka of Epivates in Iashi Romania

In subsequent years, St. Petka Paraskevi’s holy relics were transferred to various churches in the region.

In 1393 due to the fall of Bulgarian capital to save them her holy relics were transferred to fortress of Bdin today city of Vidin Bulgaria, but 3 years later 1396 Vidin's fortress also fall under the ungodly yatagan of  the muslim enslaver and to protect the relics they were again transferred to Belgrade, specifically the Ružica Church. When Belgrade fell to Ottoman forces in 1521, the relics were transferred to Constantinople. In 1641, the relics were transferred to Trei Ierarhi Monastery, in Iaşi, Moldavia (nowadays, eastern part of Romania). In 1888, they were transferred to the Metropolitan Cathedral of Iaşi.

Since 1888 they are kept in Romanian city of Iaşi and are a target of pilgrims from all around Romania, Bulgaria and other Orthodox Christian countries of the Balkans. For the day her memory is remembered in the Romanian Church usually about 200 000 people mostly from Romania and others travel to Iaşi's Cathedral in the Trei Ierarhi Monastery (Three Hierarchs – saint John Crysostom, St. Basilius the Great and St. Gregory the Great) of the  for a blessing and to beg the saint for her families, personal issues, curings especially of eye diseases

A severe drought in 1946-47 affected Moldavia, adding to the misery left by the war. Metropolitan Justinian Marina permitted the first procession featuring the coffin containing the relics of Saint Paraskevi, kept at Iaşi since then. The relics wended their way through the drought-deserted villages of Iaşi, Vaslui, Roman, Bacău, Putna, Neamţ, Baia and Botoşani Counties. The offerings collected on this occasion were distributed, based on Metropolitan Justinian's decisions, to orphans, widows, invalids, school cafeterias, churches under construction, and to monasteries in order to feed the sick, and old or feeble monks.

In the historical document with Venezia as of (year 1347), King Ivan Alexander of Bulgaria swears in the name of most holy considered matters, the document says – quote "in the name of God, The Most Holy Theotokos, The Holy Cross and The Most Holy Paraskeva of Tarnovo".

 
Since Second Bulgarian Kingdom, St. Petka has been venerated as a main patroness and protector of Bulgarian nation and country, protectress of countries of Moldova, Romania and Bulgarian cities of Veliko Tarnovo, Gabrovo and Troyan.

In Bulgaria it is an old tradition to name our childs in favour of Saint Petka, my grand-grand mother God Forgive us has also been called Parashkeva in favor of Saint Petka.

Holy Mother Petka Paraskeva (Parashkevo) Pray the Lord Jesus Christ to have mercy on All us the sinners !