Posts Tagged ‘daemon’
Friday, February 25th, 2022 
I have recently upgraded a number of machines from Debian 10 Buster to Debian 11 Bullseye. The update as always has some issues on some machines, such as problem with package dependencies, changing a number of external package repositories etc. to match che Bullseye deb packages. On some machines the update was less painful on others but the overall line was that most of the machines after the update ended up with one or more failed systemd services. It could be that some of the machines has already had this failed services present and I never checked them from the previous time update from Debian 9 -> Debian 10 or just some mess I've left behind in the hurry when doing software installation in the past. This doesn't matter anyways the fact was that I had to deal to a number of systemctl services which I managed to track by the Failed service mesage on system boot on one of the physical machines and on the OpenXen VTY Console the rest of Virtual Machines after update had some Failed messages. Thus I've spend some good amount of time like an overall of a day or two fixing strange failed services. This is how this small article was born in attempt to help sysadmins or any home Linux desktop users, who has updated his Debian Linux / Ubuntu or any other deb based distribution but due to the chaotic nature of Linux has ended with same strange Failed services and look for a way to find the source of the failures and get rid of the problems.
Systemd is a very complicated system and in my many sysadmin opinion it makes more problems than it solves, but okay for today's people's megalomania mindset it matches well.
1. Check the journal for errors, running service irregularities and so on
First thing to do to track for errors, right after the update is to take some minutes and closely check,, the journalctl for any strange errors, even on well maintained Unix machines, this journal log would bring you to a problem that is not fatal but still some process or stuff is malfunctioning in the background that you would like to solve:
root@pcfreak:~# journalctl -x
Jan 10 10:10:01 pcfreak CRON[17887]: pam_unix(cron:session): session closed for user root
Jan 10 10:10:01 pcfreak audit[17887]: USER_END pid=17887 uid=0 auid=0 ses=340858 subj==unconfined msg='op=PAM:session_close grantors=pam_loginuid,pam_env,pam_env,pam_permit>
Jan 10 10:10:01 pcfreak audit[17888]: CRED_DISP pid=17888 uid=0 auid=0 ses=340860 subj==unconfined msg='op=PAM:setcred grantors=pam_permit acct="root" exe="/usr/sbin/cron" >
Jan 10 10:10:01 pcfreak CRON[17888]: pam_unix(cron:session): session closed for user root
Jan 10 10:10:01 pcfreak audit[17888]: USER_END pid=17888 uid=0 auid=0 ses=340860 subj==unconfined msg='op=PAM:session_close grantors=pam_loginuid,pam_env,pam_env,pam_permit>
Jan 10 10:10:01 pcfreak audit[17884]: CRED_DISP pid=17884 uid=0 auid=0 ses=340855 subj==unconfined msg='op=PAM:setcred grantors=pam_permit acct="root" exe="/usr/sbin/cron" >
Jan 10 10:10:01 pcfreak CRON[17884]: pam_unix(cron:session): session closed for user root
Jan 10 10:10:01 pcfreak audit[17884]: USER_END pid=17884 uid=0 auid=0 ses=340855 subj==unconfined msg='op=PAM:session_close grantors=pam_loginuid,pam_env,pam_env,pam_permit>
Jan 10 10:10:01 pcfreak audit[17886]: CRED_DISP pid=17886 uid=0 auid=33 ses=340859 subj==unconfined msg='op=PAM:setcred grantors=pam_permit acct="www-data" exe="/usr/sbin/c>
Jan 10 10:10:01 pcfreak CRON[17886]: pam_unix(cron:session): session closed for user www-data
Jan 10 10:10:01 pcfreak audit[17886]: USER_END pid=17886 uid=0 auid=33 ses=340859 subj==unconfined msg='op=PAM:session_close grantors=pam_loginuid,pam_env,pam_env,pam_permi>
Jan 10 10:10:08 pcfreak NetworkManager[696]: [1641802208.0899] device (eth1): carrier: link connected
Jan 10 10:10:08 pcfreak kernel: r8169 0000:03:00.0 eth1: Link is Up – 100Mbps/Full – flow control rx/tx
Jan 10 10:10:08 pcfreak kernel: r8169 0000:03:00.0 eth1: Link is Down
Jan 10 10:10:19 pcfreak NetworkManager[696]: [1641802219.7920] device (eth1): carrier: link connected
Jan 10 10:10:19 pcfreak kernel: r8169 0000:03:00.0 eth1: Link is Up – 100Mbps/Full – flow control rx/tx
Jan 10 10:10:20 pcfreak kernel: r8169 0000:03:00.0 eth1: Link is Down
Jan 10 10:10:22 pcfreak NetworkManager[696]: [1641802222.2772] device (eth1): carrier: link connected
Jan 10 10:10:22 pcfreak kernel: r8169 0000:03:00.0 eth1: Link is Up – 100Mbps/Full – flow control rx/tx
Jan 10 10:10:23 pcfreak kernel: r8169 0000:03:00.0 eth1: Link is Down
Jan 10 10:10:33 pcfreak sshd[18142]: Unable to negotiate with 66.212.17.162 port 19255: no matching key exchange method found. Their offer: diffie-hellman-group14-sha1,diff>
Jan 10 10:10:41 pcfreak NetworkManager[696]: [1641802241.0186] device (eth1): carrier: link connected
Jan 10 10:10:41 pcfreak kernel: r8169 0000:03:00.0 eth1: Link is Up – 100Mbps/Full – flow control rx/tx
If you want to only check latest journal log messages use the -x -e (pager catalog) opts
root@pcfreak;~# journalctl -xe
…
Feb 25 13:08:29 pcfreak audit[2284920]: USER_LOGIN pid=2284920 uid=0 auid=4294967295 ses=4294967295 subj==unconfined msg='op=login acct=28696E76616C>
Feb 25 13:08:29 pcfreak sshd[2284920]: Received disconnect from 177.87.57.145 port 40927:11: Bye Bye [preauth]
Feb 25 13:08:29 pcfreak sshd[2284920]: Disconnected from invalid user ubuntuuser 177.87.57.145 port 40927 [preauth]
Next thing to after the update was to get a list of failed service only.
2. List all systemd failed check services which was supposed to be running
root@pcfreak:/root # systemctl list-units | grep -i failed
● certbot.service loaded failed failed Certbot
● logrotate.service loaded failed failed Rotate log files
● maldet.service loaded failed failed LSB: Start/stop maldet in monitor mode
● named.service loaded failed failed BIND Domain Name Server
Alternative way is with the –failed option
hipo@jeremiah:~$ systemctl list-units –failed
UNIT LOAD ACTIVE SUB DESCRIPTION
● haproxy.service loaded failed failed HAProxy Load Balancer
● libvirt-guests.service loaded failed failed Suspend/Resume Running libvirt Guests
● libvirtd.service loaded failed failed Virtualization daemon
● nvidia-persistenced.service loaded failed failed NVIDIA Persistence Daemon
● sqwebmail.service masked failed failed sqwebmail.service
● tpm2-abrmd.service loaded failed failed TPM2 Access Broker and Resource Management Daemon
● wd_keepalive.service loaded failed failed LSB: Start watchdog keepalive daemon
LOAD = Reflects whether the unit definition was properly loaded.
ACTIVE = The high-level unit activation state, i.e. generalization of SUB.
SUB = The low-level unit activation state, values depend on unit type.
7 loaded units listed.
root@jeremiah:/etc/apt/sources.list.d# systemctl list-units –failed
UNIT LOAD ACTIVE SUB DESCRIPTION
● haproxy.service loaded failed failed HAProxy Load Balancer
● libvirt-guests.service loaded failed failed Suspend/Resume Running libvirt Guests
● libvirtd.service loaded failed failed Virtualization daemon
● nvidia-persistenced.service loaded failed failed NVIDIA Persistence Daemon
● sqwebmail.service masked failed failed sqwebmail.service
● tpm2-abrmd.service loaded failed failed TPM2 Access Broker and Resource Management Daemon
● wd_keepalive.service loaded failed failed LSB: Start watchdog keepalive daemon
To get a full list of objects of systemctl you can pass as state:
# systemctl –state=help
Full list of possible load states to pass is here
Show service properties
Check whether a service is failed or has other status and check default set systemd variables for it.
root@jeremiah~:# systemctl is-failed vboxweb.service
inactive
# systemctl show haproxy
Type=notify
Restart=always
NotifyAccess=main
RestartUSec=100ms
TimeoutStartUSec=1min 30s
TimeoutStopUSec=1min 30s
TimeoutAbortUSec=1min 30s
TimeoutStartFailureMode=terminate
TimeoutStopFailureMode=terminate
RuntimeMaxUSec=infinity
WatchdogUSec=0
WatchdogTimestampMonotonic=0
RootDirectoryStartOnly=no
RemainAfterExit=no
GuessMainPID=yes
SuccessExitStatus=143
MainPID=304858
ControlPID=0
FileDescriptorStoreMax=0
NFileDescriptorStore=0
StatusErrno=0
Result=success
ReloadResult=success
CleanResult=success
…
Full output of the above command is dumped in show_systemctl_properties.txt
3. List all running systemd services for a better overview on what's going on on machine
To get a list of all properly systemd loaded services you can use –state running.
hipo@jeremiah:~$ systemctl list-units –state running|head -n 10
UNIT LOAD ACTIVE SUB DESCRIPTION
proc-sys-fs-binfmt_misc.automount loaded active running Arbitrary Executable File Formats File System Automount Point
cups.path loaded active running CUPS Scheduler
init.scope loaded active running System and Service Manager
session-2.scope loaded active running Session 2 of user hipo
accounts-daemon.service loaded active running Accounts Service
anydesk.service loaded active running AnyDesk
apache-htcacheclean.service loaded active running Disk Cache Cleaning Daemon for Apache HTTP Server
apache2.service loaded active running The Apache HTTP Server
avahi-daemon.service loaded active running Avahi mDNS/DNS-SD Stack
It is useful thing is to list all unit-files configured in systemd and their state, you can do it with:
root@pcfreak:~# systemctl list-unit-files
UNIT FILE STATE VENDOR PRESET
proc-sys-fs-binfmt_misc.automount static –
-.mount generated –
backups.mount generated –
dev-hugepages.mount static –
dev-mqueue.mount static –
media-cdrom0.mount generated –
mnt-sda1.mount generated –
proc-fs-nfsd.mount static –
proc-sys-fs-binfmt_misc.mount disabled disabled
run-rpc_pipefs.mount static –
sys-fs-fuse-connections.mount static –
sys-kernel-config.mount static –
sys-kernel-debug.mount static –
sys-kernel-tracing.mount static –
var-www.mount generated –
acpid.path masked enabled
cups.path enabled enabled
root@pcfreak:~# systemctl list-units –type service –all
UNIT LOAD ACTIVE SUB DESCRIPTION
accounts-daemon.service loaded inactive dead Accounts Service
acct.service loaded active exited Kernel process accounting
● alsa-restore.service not-found inactive dead alsa-restore.service
● alsa-state.service not-found inactive dead alsa-state.service
apache2.service loaded active running The Apache HTTP Server
● apparmor.service not-found inactive dead apparmor.service
apt-daily-upgrade.service loaded inactive dead Daily apt upgrade and clean activities
apt-daily.service loaded inactive dead Daily apt download activities
atd.service loaded active running Deferred execution scheduler
auditd.service loaded active running Security Auditing Service
auth-rpcgss-module.service loaded inactive dead Kernel Module supporting RPCSEC_GSS
avahi-daemon.service loaded active running Avahi mDNS/DNS-SD Stack
certbot.service loaded inactive dead Certbot
clamav-daemon.service loaded active running Clam AntiVirus userspace daemon
clamav-freshclam.service loaded active running ClamAV virus database updater
..

4. Finding out more on why a systemd configured service has failed
Usually getting info about failed systemd service is done with systemctl status servicename.service
However, in case of troubles with service unable to start to get more info about why a service has failed with (-l) or (–full) options
root@pcfreak:~# systemctl -l status logrotate.service
● logrotate.service – Rotate log files
Loaded: loaded (/lib/systemd/system/logrotate.service; static)
Active: failed (Result: exit-code) since Fri 2022-02-25 00:00:06 EET; 13h ago
TriggeredBy: ● logrotate.timer
Docs: man:logrotate(8)
man:logrotate.conf(5)
Process: 2045320 ExecStart=/usr/sbin/logrotate /etc/logrotate.conf (code=exited, status=1/FAILURE)
Main PID: 2045320 (code=exited, status=1/FAILURE)
CPU: 2.479s
Feb 25 00:00:06 pcfreak logrotate[2045577]: 2022/02/25 00:00:06| WARNING: For now we will assume you meant to write /32
Feb 25 00:00:06 pcfreak logrotate[2045577]: 2022/02/25 00:00:06| ERROR: '0.0.0.0/0.0.0.0' needs to be replaced by the term 'all'.
Feb 25 00:00:06 pcfreak logrotate[2045577]: 2022/02/25 00:00:06| SECURITY NOTICE: Overriding config setting. Using 'all' instead.
Feb 25 00:00:06 pcfreak logrotate[2045577]: 2022/02/25 00:00:06| WARNING: (B) '::/0' is a subnetwork of (A) '::/0'
Feb 25 00:00:06 pcfreak logrotate[2045577]: 2022/02/25 00:00:06| WARNING: because of this '::/0' is ignored to keep splay tree searching predictable
Feb 25 00:00:06 pcfreak logrotate[2045577]: 2022/02/25 00:00:06| WARNING: You should probably remove '::/0' from the ACL named 'all'
Feb 25 00:00:06 pcfreak systemd[1]: logrotate.service: Main process exited, code=exited, status=1/FAILURE
Feb 25 00:00:06 pcfreak systemd[1]: logrotate.service: Failed with result 'exit-code'.
Feb 25 00:00:06 pcfreak systemd[1]: Failed to start Rotate log files.
Feb 25 00:00:06 pcfreak systemd[1]: logrotate.service: Consumed 2.479s CPU time.
systemctl -l however is providing only the last log from message a started / stopped or whatever status service has generated. Sometimes systemctl -l servicename.service is showing incomplete the splitted error message as there is a limitation of line numbers on the console, see below
root@pcfreak:~# systemctl status -l certbot.service
● certbot.service – Certbot
Loaded: loaded (/lib/systemd/system/certbot.service; static)
Active: failed (Result: exit-code) since Fri 2022-02-25 09:28:33 EET; 4h 0min ago
TriggeredBy: ● certbot.timer
Docs: file:///usr/share/doc/python-certbot-doc/html/index.html
https://certbot.eff.org/docs
Process: 290017 ExecStart=/usr/bin/certbot -q renew (code=exited, status=1/FAILURE)
Main PID: 290017 (code=exited, status=1/FAILURE)
CPU: 9.771s
Feb 25 09:28:33 pcfrxen certbot[290017]: The error was: PluginError('An authentication script must be provided with –manual-auth-hook when using th>
Feb 25 09:28:33 pcfrxen certbot[290017]: All renewals failed. The following certificates could not be renewed:
Feb 25 09:28:33 pcfrxen certbot[290017]: /etc/letsencrypt/live/mail.pcfreak.org-0003/fullchain.pem (failure)
Feb 25 09:28:33 pcfrxen certbot[290017]: /etc/letsencrypt/live/www.eforia.bg-0005/fullchain.pem (failure)
Feb 25 09:28:33 pcfrxen certbot[290017]: /etc/letsencrypt/live/zabbix.pc-freak.net/fullchain.pem (failure)
Feb 25 09:28:33 pcfrxen certbot[290017]: 3 renew failure(s), 5 parse failure(s)
Feb 25 09:28:33 pcfrxen systemd[1]: certbot.service: Main process exited, code=exited, status=1/FAILURE
Feb 25 09:28:33 pcfrxen systemd[1]: certbot.service: Failed with result 'exit-code'.
Feb 25 09:28:33 pcfrxen systemd[1]: Failed to start Certbot.
Feb 25 09:28:33 pcfrxen systemd[1]: certbot.service: Consumed 9.771s CPU time.
5. Get a complete log of journal to make sure everything configured on server host runs as it should
Thus to get more complete list of the message and be able to later google and look if has come with a solution on the internet use:
root@pcfrxen:~# journalctl –catalog –unit=certbot
— Journal begins at Sat 2022-01-22 21:14:05 EET, ends at Fri 2022-02-25 13:32:01 EET. —
Jan 23 09:58:18 pcfrxen systemd[1]: Starting Certbot…
░░ Subject: A start job for unit certbot.service has begun execution
░░ Defined-By: systemd
░░ Support: https://www.debian.org/support
░░
░░ A start job for unit certbot.service has begun execution.
░░
░░ The job identifier is 5754.
Jan 23 09:58:20 pcfrxen certbot[124996]: Traceback (most recent call last):
Jan 23 09:58:20 pcfrxen certbot[124996]: File "/usr/lib/python3/dist-packages/certbot/_internal/renewal.py", line 71, in _reconstitute
Jan 23 09:58:20 pcfrxen certbot[124996]: renewal_candidate = storage.RenewableCert(full_path, config)
Jan 23 09:58:20 pcfrxen certbot[124996]: File "/usr/lib/python3/dist-packages/certbot/_internal/storage.py", line 471, in __init__
Jan 23 09:58:20 pcfrxen certbot[124996]: self._check_symlinks()
Jan 23 09:58:20 pcfrxen certbot[124996]: File "/usr/lib/python3/dist-packages/certbot/_internal/storage.py", line 537, in _check_symlinks
root@server:~# journalctl –catalog –unit=certbot|grep -i pluginerror|tail -1
Feb 25 09:28:33 pcfrxen certbot[290017]: The error was: PluginError('An authentication script must be provided with –manual-auth-hook when using the manual plugin non-interactively.')
Or if you want to list and read only the last messages in the journal log regarding a service
root@server:~# journalctl –catalog –pager-end –unit=certbot
…
If you have disabled a failed service because you don't need it to run at all on the machine with:
root@rhel:~# systemctl stop rngd.service
root@rhel:~# systemctl disable rngd.service
And you want to clear up any failed service information that is kept in the systemctl service log you can do it with:
root@rhel:~# systemctl reset-failed
Another useful systemctl option is cat, you can use it to easily list a service it is useful to quickly check what is a service, an actual shortcut to save you from giving a full path to the service e.g. cat /lib/systemd/system/certbot.service
root@server:~# systemctl cat certbot
# /lib/systemd/system/certbot.service
[Unit]
Description=Certbot
Documentation=file:///usr/share/doc/python-certbot-doc/html/index.html
Documentation=https://certbot.eff.org/docs
[Service]
Type=oneshot
ExecStart=/usr/bin/certbot -q renew
PrivateTmp=true
After failed SystemD services are fixed, it is best to reboot the machine and check put some more time to inspect rawly the complete journal log to make sure, no error was left behind.
Closure
As you can see updating a machine from a major to a major version even if you follow the official documentation and you have plenty of experience is always more or a less a pain in the ass, which can eat up much of your time banging your head solving problems with failed daemons issues with /etc/rc.local (which I have faced becase of #/bin/sh -e (which would make /etc/rc.local) to immediately quit if any error from command $? returns different from 0 etc.. The logical questions comes then;
1. Is it really worthy to update at all regularly, especially if you don't know of a famous major Vulnerability 🙂 ?
2. Or is it worthy to update from OS major release to OS major release at all?
3. Or should you only try to patch the service that is exposed to an external reachable computer network or the internet only and still the the same OS release until End of Life (LTS = Long Term Support) as called in Debian or End Of Life (EOL) Cycle as called in RPM based distros the period until the OS major release your software distro has official security patches is reached.
Anyone could take any approach but for my own managed systems small network at home my practice was always to try to keep up2date everything every 3 or 6 months maximum. This has caused me multiple days of irritation and stress and perhaps many white hairs and spend nerves on shit.
4. Based on the company where I'm employed the better strategy is to patch to the EOL is still offered and keep the rule First Things First (FTF), once the EOL is reached, just make a copy of all servers data and configuration to external Data storage, bring up a new Physical or VM and migrate the services.
Test after the migration all works as expected if all is as it should be change the DNS records or Leading Infrastructure Proxies whatever to point to the new service and that's it! Yes it is true that migration based on a full OS reinstall is more time consuming and requires much more planning, but usually the result is much more expected, plus it is much less stressful for the guy doing the job.
Tags: active, check, daemon, daemons, fix, fixing, haproxy, hipo, Journal, journalctl, kernel, libvirtd.service, list, log, log messages, lsb, Main, msg, PAM, pcfreak, properly, rc.local, root, root server, strange errors, Suspend Resume Running, systemctl, systemd, uid
Posted in Linux, Migration, OS Update, System Administration | No Comments »
Wednesday, August 12th, 2020 
Those who administer servers from the days of birth of Linux and who used actively GNU / Linux over the years or any other UNIX knows how practical could be to configure logging of all running services / kernel messages / errors and warnings on a physical console.
Traditionally from the days I was learning Linux basics I was shown how to do this on an old Debian Sarge 3.0 Linux without systemd and on all Linux distributions Redhat 9.0 / Calderas and Mandrakes I've used either as a home systems or for servers. I've always configured output of all messages to go to the last easy to access console /dev/tty12 (for those who never use it console switching under Linux plain text console mode is done with key combination of CTRL + ALT + F1 .. F12.
In recent times however with the introduction of systemd pretty much things changed as messages to console are not handled by /etc/inittab which was used to add and refresh physical consoles tty1, tty2 … tty7 (the default added one on Linux were usually 7), but I had to manually include more respawn lines for each console in /etc/inittab.
Nowadays as of year 2020 Linux distros /etc/inittab is no longer there being obsoleted and console print out of INPUT / OUTPUT messages are handled by systemd.
1. Enable Physical TTYs from TTY8 till TTY12 etc.
The number of default consoles existing in most Linux distributions I've seen is still from tty1 to tty7. Hence to add more tty consoles and be ready to be able to switch out not only towards tty7 but towards tty12 once you're connected to the server via a remote ILO (Integrated Lights Out) / IdRAC (Dell Remote Access Controller) / IPMI / IMM (Imtegrated Management Module), you have to do it by telling systemd issuing below systemctl commands:
# systemctl enable getty@tty8.service Created symlink /etc/systemd/system/getty.target.wants/getty@tty8.service -> /lib/systemd/system/getty@.service.
systemctl enable getty@tty9.service
Created symlink /etc/systemd/system/getty.target.wants/getty@tty9.service -> /lib/systemd/system/getty@.service.
systemctl enable getty@tty10.service
Created symlink /etc/systemd/system/getty.target.wants/getty@tty10.service -> /lib/systemd/system/getty@.service.
systemctl enable getty@tty11.service
Created symlink /etc/systemd/system/getty.target.wants/getty@tty11.service -> /lib/systemd/system/getty@.service.
systemctl enable getty@tty12.service
Created symlink /etc/systemd/system/getty.target.wants/getty@tty12.service -> /lib/systemd/system/getty@.service.
Once the TTYS tty7 to tty12 are enabled you will be able to switch to this consoles either if you have a physical LCD / CRT monitor or KVM switch connected to the machine mounted on the Rack shelf once you're in the Data Center or will be able to see it once connected remotely via the Management IP Interface (ILO) remote console.
2. Taking screenshot of the physical console TTY with fbcat
For example below is a screenshot of the 10th enabled tty10:
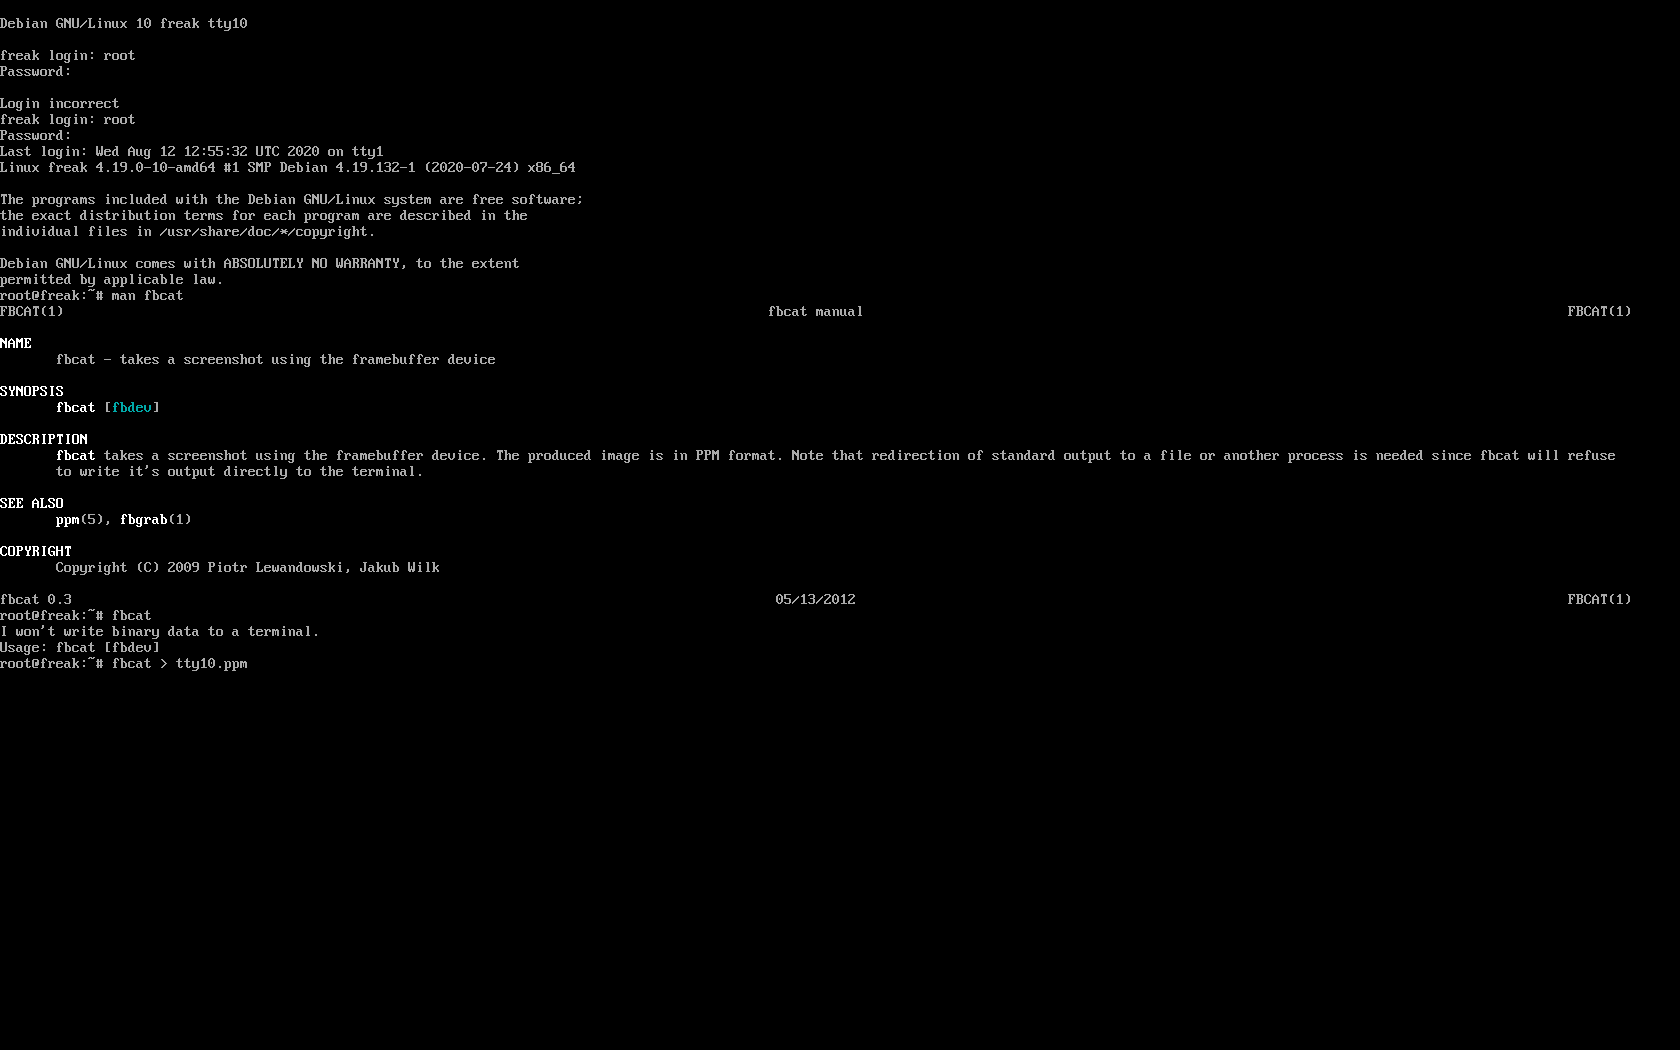
As you can in the screenshot I've used the nice tool fbcat that can be used to make a screenshot of remote console. This is very useful especially if remote access via a SSH client such as PuTTY / MobaXterm is not there but you have only a physical attached monitor access on a DCs that are under a heavy firewall that is preventing anyone to get to the system remotely. For example screenshotting the physical console in case if there is a major hardware failure occurs and you need to dump a hardware error message to a flash drive that will be used to later be handled to technicians to analyize it and exchange the broken server hardware part.
Screenshots of the CLI with fbcat is possible across most Linux distributions where as usual.
In Debian you have to first instal the tool via :
# apt install –yes fbcat
…
and on RedHats / CentOS / Fedoras
# yum install -y fbcat
…
Taking screenshot once tool is on the server of whatever you have printed on console is as easy as
# fbcat > tty_name.ppm
Note that you might want to convert the .ppm created picture to png with any converter such as imagemagick's convert command or if you have a GUI perhaps with GNU Image Manipulation Tool (GIMP).
3. Enabling every rsyslog handled message to log to Physical TTY12
To make everything such as errors, notices, debug, warning messages become instantly logging towards above added new /dev/tty12.
Open /etc/rsyslog.conf and to the end of the file append below line :
daemon,mail.*;\
news.=crit;news.=err;news.=notice;\
*.=debug;*.=info;\
*.=notice;*.=warn /dev/tty12
To make rsyslog load its new config restart it:
# systemctl status rsyslog
● rsyslog.service – System Logging Service
Loaded: loaded (/lib/systemd/system/rsyslog.service; enabled; vendor preset: enabled)
Active: active (running) since Mon 2020-08-10 04:09:36 EEST; 2 days ago
Docs: man:rsyslogd(8)
https://www.rsyslog.com/doc/
Main PID: 671 (rsyslogd)
Tasks: 4 (limit: 4915)
Memory: 12.5M
CGroup: /system.slice/rsyslog.service
└─671 /usr/sbin/rsyslogd -n -iNONE
авг 12 00:00:05 pcfreak rsyslogd[671]: [origin software="rsyslogd" swVersion="8.1901.0" x-pid="671" x-info="https://www.rsyslo
Warning: Journal has been rotated since unit was started. Log output is incomplete or unavailable.
# systemctl restart rsyslog
That's all folks navigate by pressing simultaneously CTRL + ALT + F12 to get to TTY12 or use ALT + LEFT / ALT + RIGHT ARROW (console switch commands) till you get to the console where everything should be now logged.
Enjoy and if you like this article share to tell your sysadmin friends about this nice hack ! 🙂
Tags: console, daemon, dev, Enabling, Enjoy, error message, everything, getty, Journal, linux?, logs, mail, news, rsyslog, servers, Set, status, sysadmin, systemctl, systemd, Warning, Warning Journal
Posted in Linux, Linux and FreeBSD Desktop, Remote System Administration, System Administration | 1 Comment »
Sunday, May 20th, 2012 
My home run machine MySQL server was suddenly down as I tried to check my blog and other sites today, the error I saw while trying to open, this blog as well as other hosted sites using the MySQL was:
Error establishing a database connection
The topology, where this error occured is simple, I have two hosts:
1. Apache version 2.0.64 compiled support externally PHP scripts interpretation via libphp – the host runs on (FreeBSD)
2. A Debian GNU / Linux squeeze running MySQL server version 5.1.61
The Apache host is assigned a local IP address 192.168.0.1 and the SQL server is running on a host with IP 192.168.0.2
To diagnose the error I've logged in to 192.168.0.2 and weirdly the mysql-server was appearing to run just fine:
debian:~# ps ax |grep -i mysql
31781 pts/0 S 0:00 /bin/sh /usr/bin/mysqld_safe
31940 pts/0 Sl 12:08 /usr/sbin/mysqld –basedir=/usr –datadir=/var/lib/mysql –user=mysql –pid-file=/var/run/mysqld/mysqld.pid –socket=/var/run/mysqld/mysqld.sock –port=3306
31941 pts/0 S 0:00 logger -t mysqld -p daemon.error
32292 pts/0 S+ 0:00 grep -i mysql
Moreover I could connect to the localhost SQL server with mysql -u root -p and it seemed to run fine. The error Error establishing a database connection meant that either something is messed up with the database or 192.168.0.2 Mysql port 3306 is not properly accessible.
My first guess was something is wrong due to some firewall rules, so I tried to connect from 192.168.0.1 to 192.168.0.2 with telnet:
freebsd# telnet 192.168.0.2 3306
Trying 192.168.0.2…
Connected to jericho.
Escape character is '^]'.
Host 'webserver' is blocked because of many connection errors; unblock with 'mysqladmin flush-hosts'
Connection closed by foreign host.
Right after the telnet was initiated as I show in the above output the connection was immediately closed with the error:
Host 'webserver' is blocked because of many connection errors; unblock with 'mysqladmin flush-hosts'Connection closed by foreign host.
In the error 'webserver' is my Apache machine set hostname. The error clearly states the problems with the 'webserver' apache host unable to connect to the SQL database are due to 'many connection errors' and a fix i suggested with mysqladmin flush-hosts
To temporary solve the error and restore my normal connectivity between the Apache and the SQL servers I logged I had to issue on the SQL host:
mysqladmin -u root -p flush-hostsEnter password:
Thogh this temporar fix restored accessibility to the databases and hence the websites errors were resolved, this doesn't guarantee that in the future I wouldn't end up in the same situation and therefore I looked for a permanent fix to the issues once and for all.
The permanent fix consists in changing the default value set for max_connect_error in /etc/mysql/my.cnf, which by default is not too high. Therefore to raise up the variable value, added in my.cnf in conf section [mysqld]:
debian:~# vim /etc/mysql/my.cnf

...

max_connect_errors=4294967295
and afterwards restarted MYSQL:
debian:~# /etc/init.d/mysql restart

Stopping MySQL database server: mysqld.

Starting MySQL database server: mysqld.

Checking for corrupt, not cleanly closed and upgrade needing tables..
To make sure the assigned max_connect_errors=4294967295 is never reached due to Apache to SQL connection errors, I've also added as a cronjob.
debian:~# crontab -u root -e

00 03 * * * mysqladmin flush-hosts
In the cron I have omitted the mysqladmin -u root -p (user/pass) input options because for convenience I have already stored the mysql root password in /root/.my.cnf
Here is how /root/.my.cnf looks like:
debian:~# cat /root/.my.cnf

[client]

user=root

password=a_secret_sql_password
Now hopefully, this would permanently solve SQL's 'failure to accept connections' due to too many connection errors for future.
Tags: apache version, Auto, basedir, bin, cnf, connection, connectionThe, daemon, database connection, debian gnu, default, Draft, due, error error, firewall rules, fix, freebsd, GNU, guess, host, host name, hostname, lib, Linux, local ip address, localhost, machine, mysql server, mysqladmin, mysqld, mysqlMoreover, nbsp, occured, password, port 3306, root, root password, running, server version, sl 12, Socket, something, SQL, sql server, squeeze, support, topology, value, webserver
Posted in MySQL, System Administration, Web and CMS | No Comments »
Monday, June 11th, 2012 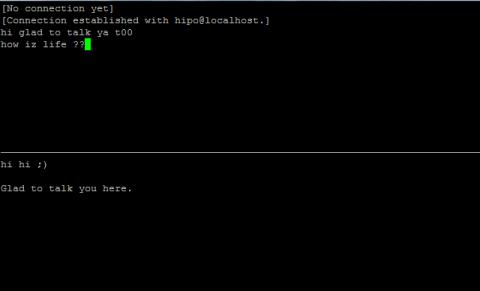
After writting in previous article on how talk be used to handle interactive chat console sessions on FreeBSD, I thought of dropping a few lines on how same is done on Debian, so here is how:
1.; Install talk and talkd
noah:/home/hipo# apt-get --yes install talk talkd

Reading package lists... Done

Building dependency tree

Reading state information... Done

The following NEW packages will be installed:

talk talkd

0 upgraded, 2 newly installed, 0 to remove and 93 not upgraded.

Need to get 19.0 kB/42.3 kB of archives.

After this operation, 201 kB of additional disk space will be used.

Get:1 http://ftp.nl.debian.org/debian/ stable/main talkd amd64 0.17-14 [19.0 kB]

Fetched 19.0 kB in 0s (67.1 kB/s)

Selecting previously deselected package talk.

(Reading database ... 90%

Unpacking talk (from .../talk_0.17-14_amd64.deb) ...

Selecting previously deselected package talkd.

Unpacking talkd (from .../talkd_0.17-14_amd64.deb) ...

Processing triggers for man-db ...

Setting up talk (0.17-14) ...

update-alternatives: using /usr/bin/netkit-ntalk to provide /usr/bin/talk (talk) in auto mode.

Setting up talkd (0.17-14) ...
2.;; Check and make sure talk and ntalkd lines are present in /etc/inetd.conf
noah:/home/hipo# grep -i talk /etc/inetd.conf

#:BSD: Shell, login, exec and talk are BSD protocols.

talk dgram udp wait nobody.tty /usr/sbin/in.talkd in.talkd

ntalk dgram udp wait nobody.tty /usr/sbin/in.ntalkd in.ntalkd
Now you probably wonder why are there two lines in /etc/inetd.conf for ))
in.talkd and in.ntald
in.talkd daemon's aim is to deliver talk sessions between logged in users on one Linux host with few logged in users willing to talk to each other locally;;
Wheter in.ntalkd is designed to serve interactive user talks between the host where in.ntalkd is installed and remote systems ruwhich have the talk client program installed. Of course in order for remote talks to work properly the firewall (if such has to be modified to allow in.ntalkd chats. I've never used in.ntalkd and on most machines having in.ntald hanging around from inetd, could be a potential security hole so, for people not planning to initiate remote TALKs between Unix / Linux / BSD hosts on a network it is a good practice the ntalkd line seen above in inetd.conf to be commented out ::;
noah:/home/hipo# grep -i talk /etc/inetd.conf

#:BSD: Shell, login, exec and talk are BSD protocols.

talk dgram udp wait nobody.tty /usr/sbin/in.talkd in.talkd

#ntalk dgram udp wait nobody.tty /usr/sbin/in.ntalkd in.ntalkd
3.;;; Restart openbsd-inetd init script and talk is ready to use
noah:~# /etc/init.d/openbsd-inetd restart

* Restarting internet superserver inetd
Onwards to use talk between two users the syntax is same like on other BSD, as a matter of fact TALK – console / terminal interactive chat originally was developed for the 4.2BSD UNIX release ;; the Linux code is a port of this BSD talk and not rewrite from scratch.
Using talk between two logged in users on pts/1 (lets say user test) and tty1 (user logged as root) is done with:
noah:~$ tty

noah:~$ talk root@localhost tty1

/dev/pts/1
On tty1 the user has to have enabled Talk sessions request, by default this behaviour in Debian and probably other Debian based Linuxes (Ubuntu) for instance is configured to have talks disabled, i,e ,,,
root@noah:~# mesg

is n
Enabling it on root console is done with:
root@noah:~# mesg y
Once enabled the root will be able to see the TALK service requests on tty1 otherwise, the user gets nothing. With enabled messaging the root user will get on his tty:
Message from TalkDaemon@his_machine...

talk: connection requested by your_name@your_machine.

talk: respond with: talk your_name@your_machine
So on the root console to reply back to talk chat request:
noah:~$ talk hipo@localhost
Tags: aim, Auto, auto mode, building, configured, confnoah, daemon, deb, debian gnu, dependency, dependency tree, dgram, Disk, disk space, DoneBuilding, Draft, exec, Fetched, freebsd, gnu linux, inetd, information, Install, Installing, interactive user, localhost, login, mesg, network, noah, nobody, ntalk, ntalkd, operation, package, protocols, reading database, reading package, request, root, root user, sbin, sessions, Shell, shell login, state information, tree, tty, wait, work, writting
Posted in Curious Facts, Everyday Life, Linux, Various | No Comments »
Tuesday, March 10th, 2015 
Something very useful that most Apache LAMP (Linux Apache MySQL PHP) admins should know is how to check Apache Webserver uptime and MySQL server running (uptime).
Checking Apache / MySQL uptime is primary useful for scripting purposes – creating auto Apache / MySQL service restart scripts, or just as a quick console way to check what is the status and uptime of Webserver / SQL.
My experience as a sysadmin shows that lack of Periodic Apache and MySQL restart every week or every month often creates sys-admin a lot of a headaches cause (Apache / NGINX / SQL server) starts eating too much memory or under some circumstances leads to service or system crashes. Periodic system main services restart is especially helpful in case if Website's backend programming code is writetn in a bad and buggy uneffient way by unprofessional (novice) programmers.
While I was still working as Senior SysAdmin in Design.BG, I've encountered many such Crappy Web applications developed by dozen of different programmers (because company's programmers changed too frequently and many of the hired Web Developers ,were still learning to program, I guess same is true also for other Start-UP Web / IT Company where crappy programming code is developed you will certainly need to keep an eye on Apache / MYSQL uptime. If that's the case below 2 quick one liners with PS command will help you keep an eye on Apache / MYSQL uptime
ps -eo "%U %c %t"| grep apache2 | grep -v grep|grep root
root apache2 02:30:05
Note that above example is Debian specific on RPM based distributions you will have to grep for httpd instead of apache2
ps -eo "%U %c %t"| grep http| grep -v grep|grep root
root apache2 10:30:05
To check MySQL uptine:
ps -eo "%U %c %t"| grep mysqld
root mysqld_safe 20:42:53
mysql mysqld 20:42:53
Though example is for mysql and Apache you can easily use ps cmd in same way to check any other Linux service uptime such as Java / Qmail / PostgreSQL / Postfix etc.
ps -eo "%U %c %t"|grep qmail
qmails qmail-send 19-01:10:48
qmaill multilog 19-01:10:48
qmaill multilog 19-01:10:48
qmaill multilog 19-01:10:48
root qmail-lspawn 19-01:10:48
qmailr qmail-rspawn 19-01:10:48
qmailq qmail-clean 19-01:10:48
qmails qmail-todo 19-01:10:48
qmailq qmail-clean 19-01:10:48
qmaill multilog 40-18:02:53
ps -eo "%U %c %t"|grep -i nginx|grep -v root|uniq
nobody nginx 55-01:22:44
ps -eo "%U %c %t"|grep -i java|grep -v root |uniq
hipo java 27-22:02:07
Tags: apache webserver, apache2, case, cms, command, Crappy Web, crashes, daemon, doesn, example, eye, grep, headaches, How to, lot, multilog, mysqld, primary, programmers, programming code, root, running, scripting, scripts, week
Posted in Everyday Life, Linux, Monitoring, Programming, System Administration | No Comments »
Monday, July 29th, 2013 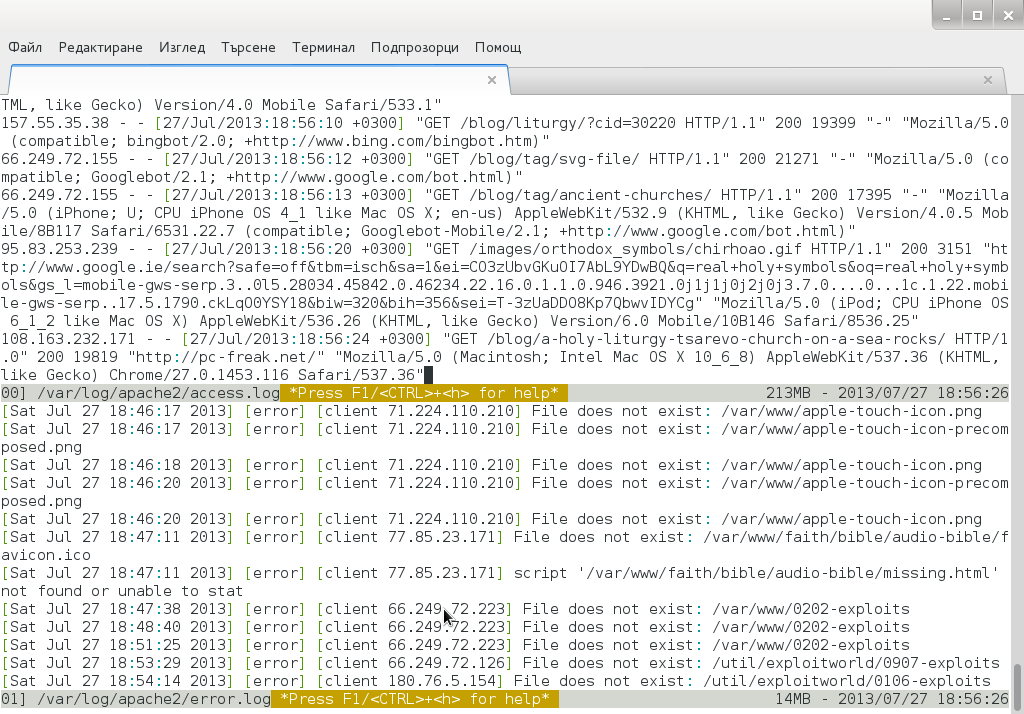
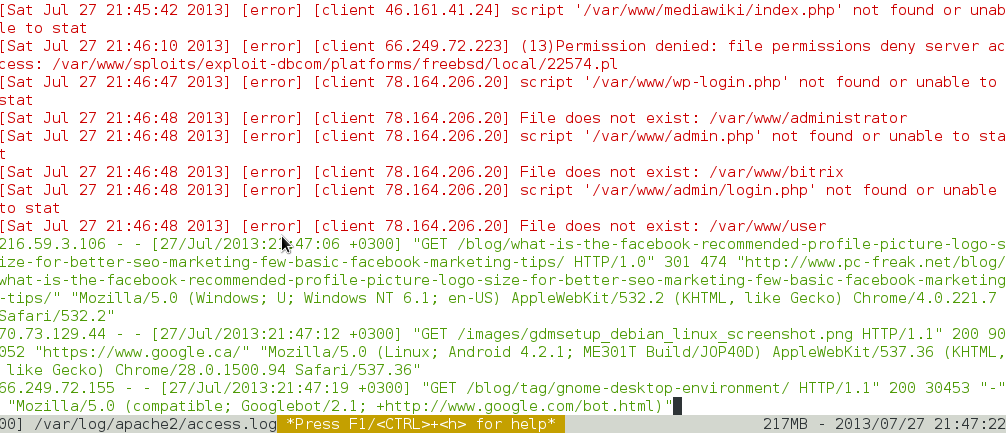
Whether you have to administer Apache, Nginx or Lighttpd, or whatever other kind of daemon which interactively logs user requests or errors you probably already know well of tail command (tail -f /var/log/apache2/access.log) is something Webserver Linux admin can't live without. Sometimes however you have number of Virtualhost (domains) each configured to log site activity in separate log file. One solution to the problem is to use GNU Screen (screen – terminal emulator) to launch multiple screen session and launch separate tail -f /var/log/apache2/domain1/access.log , tail -f /var/log/apache2/domain2/access.log etc. This however is a bit of hack and except configuring screen to show multiple windows on one Virtual Terminal (tty or vty in gnome), you can't really see output simultaneously in one separated window.
Here is where multitail comes handy. MultiTail is tool to visualize in real time log records output of multiple logs (tails) in one shared terminal Window. MultiTail is written to use ncurses library used by a bunch of other useful tools like Midnight Command so output is colorful and very nice looking.
Here is MultiTail package description on Debian Linux:
linux:~# apt-cache show multitail|grep -i description -A 1
Description-en: view multiple logfiles windowed on console
multitail lets you view one or multiple files like the original tail
—
Description-md5: 5e2f688efb214b063bdc418a705860a1
Tag: interface::text-mode, role::program, scope::utility, uitoolkit::ncurses,
root@noah:/home/hipo# apt-cache show multitail|grep -i description -A 1
Description-en: view multiple logfiles windowed on console
multitail lets you view one or multiple files like the original tail
—
Description-md5: 5e2f688efb214b063bdc418a705860a1
Tag: interface::text-mode, role::program, scope::utility, uitoolkit::ncurses,
Multiple Tail is available across most Linux distributions to install on Debian / Ubuntu / Mint etc. Linux:
 debian:~# apt-get install --yes multitail

...
On recent Fedora / RHEL / CentOS etc. RPM based Linuces to install:
 [root@centos ~]# yum -y install multitail

...
On FreeBSD multitail is available to install from ports:
 freebsd# cd /usr/ports/sysutils/multitail

freebsd# make install clean

...
Once installed to display records in multiple files lets say Apache domain name access.log and error.log
debian:~# multitail -f /var/log/apache2/access.log /var/log/apache2/error.log
…
It has very extensive help invoked by simply pressing h while running
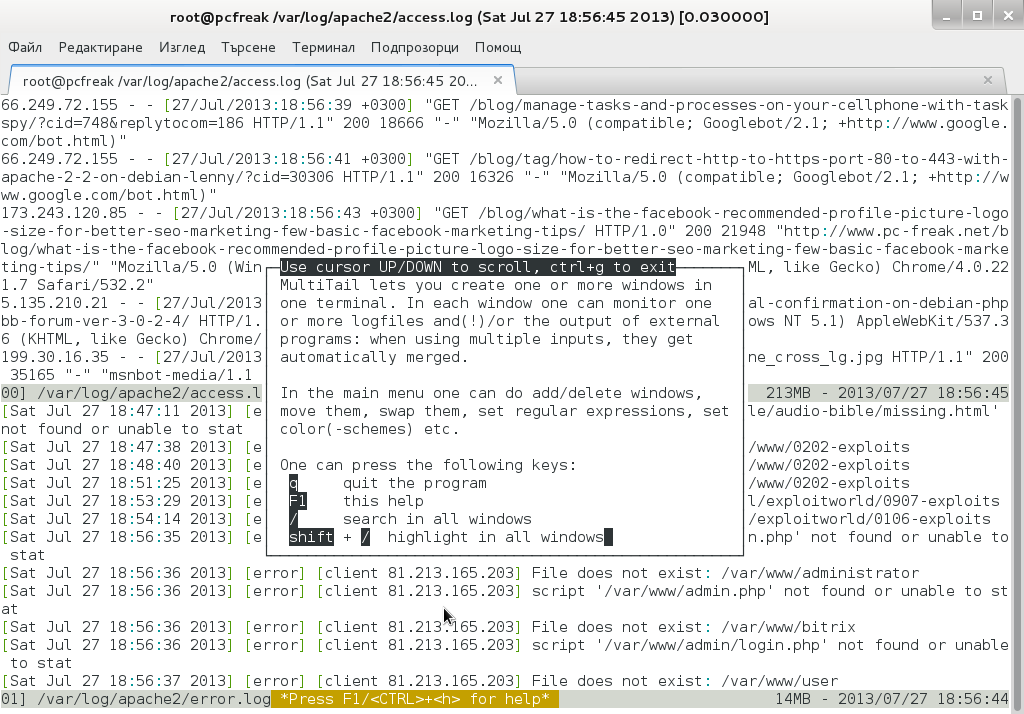
Even better multitail is written to already have integrated color schemes for most popular Linux services log files
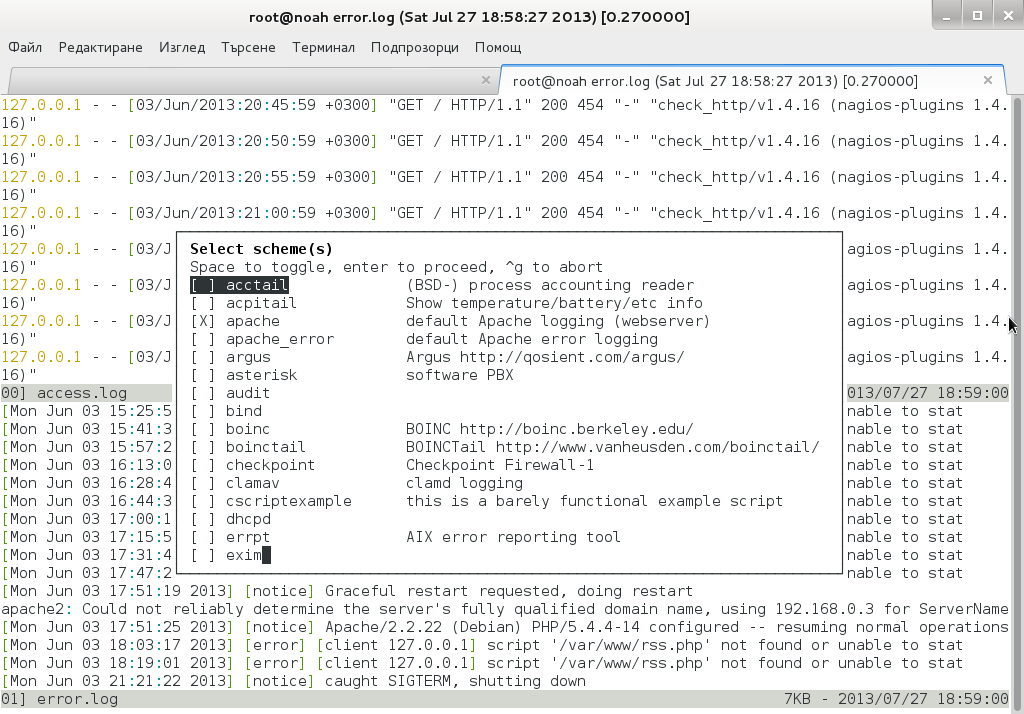
List of supported MulLog Color schemes as of time of writting article is:
acctail, acpitail, apache, apache_error, argus, asterisk, audit, bind, boinc, boinctail ,checkpoint, clamav, cscriptexample, dhcpd, errrpt, exim, httping, ii, inn, kerberos, lambamoo, liniptfw, log4j, mailscanner, motion, mpstat, mysql, nagtail, netscapeldap, netstat, nttpcache, ntpd, oracle, p0f, portsentry, postfix, pptpd, procmail, qmt-clamd, qmt-send, qmt-smtpd, qmt-sophie, qmt-spamassassin, rsstail, samba, sendmail, smartd, snort spamassassin, squid, ssh, strace, syslog, tcpdump, vmstat, vnetbr, websphere, wtmptail
To tell it what kind of log Color scheme to use from cmd line use:
debian:~# multitail -Csapache /var/log/apache2/access.log /var/log/apache2/error.log
Useful feature is to run command display in separate Windows while still following log output, i.e.:
  [root@centos:~]# multitail /var/log/httpd.log -l "netstat -nat"

...
Multitail can also merge output from files in one Window, while in second window some other log or command output is displayed. To merge output from Apache access.log and error.log:
debian:~# multitail /var/log/apache2/access.log -I /var/log/apache2/error.log
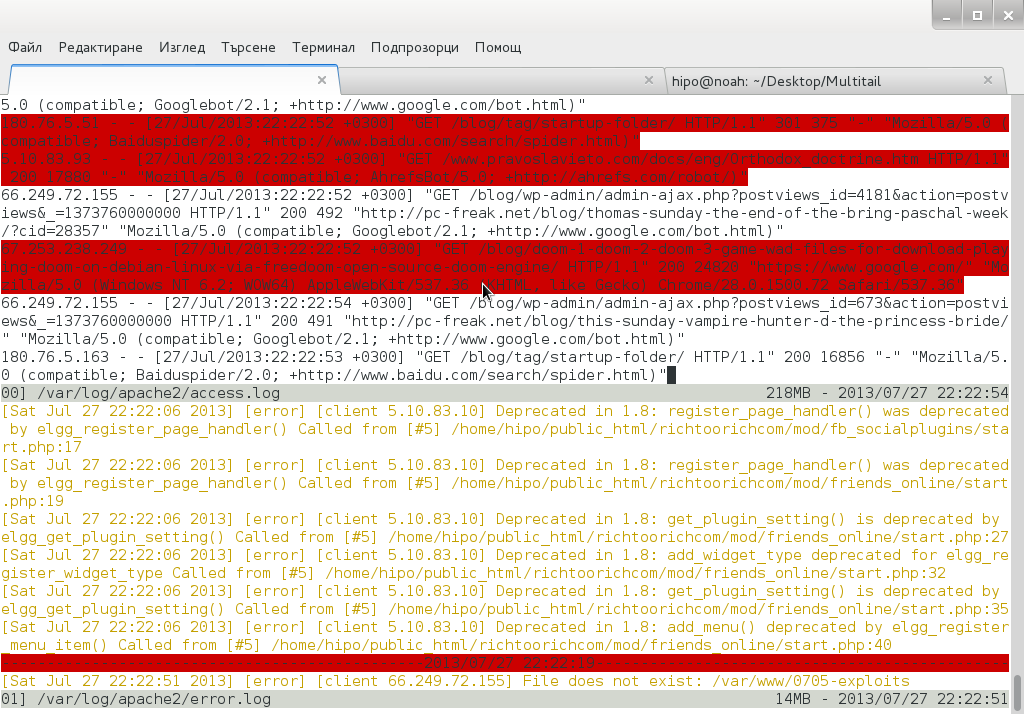
When merging two log files output to show in one Window it is useful to display each file output in different color for the sake of readability
For example:
debian:~# multitail -ci green /var/log/apache/access.log -ci red -I /var/log/apache/error.log
To display output from 3 log files in 3 separate shared Windows in console use:
linux:~# multitail -s 2 /var/log/syslog /var/log/apache2/access.log /var/log/apache2/error.log
For some more useful examples, check out MultiTail's official page examples
There is plenty of other useful things to do with multitail, for more RTFM 🙂
Tags: configured, daemon, Gnome, gnu screen, hack, lighttpd, logs, multiple files, nginx, package description, screen session, terminal emulator, terminal window, time log, useful tools, Virtualhost
Posted in Everyday Life, FreeBSD, Linux, System Administration | No Comments »
Saturday, August 7th, 2010 Some time ago before I have blogged about How to properly control your Lenovo Thinkpad R61 fan rotation cycles on Linux with ThinkFan
In this tiny article I have explained my previous obstacles of making my Notebook CPU cooling fan to properly rotate and cool up my Central Processing Unit.
However just recently I’ve upgraded my Debian Unstable – Squeeze/Sid through the apt-get manager to the newest possible package updates.
The upgraded bundle of packages also updated my sid thinkfan package to:
hipo@noah:~$ dpkg -l |grep -i thinkfan

ii thinkfan 0.7.1-1 simple and lightweight fan control program
I was unpleasently suprised when I tried to restart thinkfan using the thinkfan init.d script I have used until recently /etc/init.d/thinkfan , cause /etc/init.d/thinkfan was no longer be.
Furthermore I give a try to directly launch the thinkfan daemon from the terminal trying to backround the service, like so:
noah:~# thinkfan &

WARNING: Using default temperature inputs in /proc/acpi/ibm/thermal.

WARNING: You have not provided any correction values for any sensor, and your fan will only start at 55 °C. This can be dangerous for your hard drive.
Though this started up the thinkfan daemon as you can see the note in the message below it started up with a consistent cycling cooling to keep the CPU wamrth sticked to 55 ° degrees:
<</p>
Tags: central processing unit, cpu cooling fan, daemon, debian gnu, dpkg, fan control, hard drive, lenovo thinkpad, Linux, obstacles, package updates, squeeze, suprised, thinkpad r61, tiny article
Posted in Linux, Linux and FreeBSD Desktop | 12 Comments »
Tuesday, February 26th, 2008 Today I helped my cousing to fix his internet connection on a laptop.
The laptop was running Vista. A real nightmare, this OS is really heavy and even messier than Windows XP.
What else I’m trying to cope with life. Life is tough. What I can say….
Also I started a vsftp server on a FreeBSD box it took me some time because of configuration issues.
Right now I’mtrying to run a snort server still unsuccessfully for some reason the snort daemon does not start.
In the college everything is going in the old manner, except we have started studying Marketing II and another subject I forgot the name it is supposed to be something like statistics. The day was quiet with a bit of work.
END—–
Tags: bit, college, configuration issues, connection, daemon, end, everything, freebsd, internet connection, laptop, life, marketing, messier, name, real nightmare, reason, snort, something, statistics, time, title, Vista, vsftp, Windows, windows xp, work
Posted in Everyday Life | 1 Comment »
Friday, October 28th, 2011 One of the qmail servers I manage today has started returning strange errors in Squirrel webmail and via POP3/IMAP connections with Thunderbird.
What was rather strange is if the email doesn’t contain a link to a webpage or and attachment, e.g. mail consists of just plain text the mail was sent properly, if not however it failed to sent with an error message of:
Requested action aborted: error in processing Server replied: 451 qq temporary problem (#4.3.0)
After looking up in the logs and some quick search in Google, I come across some online threads reporting that the whole issues are caused by malfunction of the qmail-scanner.pl (script checking mail for viruses).
After a close examination on what is happening I found out /usr/sbin/clamd was not running at all?!
Then I remembered a bit earlier I applied some updates on the server with apt-get update && apt-get upgrade , some of the packages which were updated were exactly clamav-daemon and clamav-freshclam .
Hence, the reason for the error:
451 qq temporary problem (#4.3.0)
was pretty obvious qmail-scanner.pl which is using the clamd daemon to check incoming and outgoing mail for viruses failed to respond, so any mail which contained any content which needed to go through clamd for a check and returned back to qmail-scanner.pl did not make it and therefore qmail returned the weird error message.
Apparently for some reason apparently the earlier update of clamav-daemon failed to properly restart, the init script /etc/init.d/clamav-daemon .
Following fix was very simple all I had to do is launch clamav-daemon again:
linux:~# /etc/inid.d/clamav-daemon restart
Afterwards the error is gone and all mails worked just fine 😉
Tags: action, amp, cause and solution, checking, Clamav, clamd, daemon, email, examination, fine, fix, g mail, google, imap connections, init script, link, logs, mail, online, outgoing mail, pl script, processing, Qmail, qq, reason, Requested, scanner, Search, servers, solution, Squirrel, strange errors, Thunderbird, today, update, usr, Viruses, weird error message
Posted in Linux, Qmail, System Administration | No Comments »
Friday, February 10th, 2012

On FreeBSD ntpd , ntpdc , ntpdate , ntpq doesn't need to be installed via a specific package like on GNU/Linux as they're part of the FreeBSD world (binary standardly shipped with FreeBSD basis system).
The FreeBSD handbook has a chapter explaining thoroughfully on ntp on FreeBSD ,however for the lazy ones here is a short few steps tutorial on how to install and configure ntpd on bsd :
1. Copy sample ntp.conf file to /etc/
freebsd# cp -rpf /usr/src/etc/ntp.conf /etc/ntp/
No need for any modifications if you don't want to apply some specific restrictions on whom can access the ntpd server. If you update regularly the FreeBSD system with freebsd-update or directly by rebuilding the FreeBSD kernel / world adding restrictions might be not necessery..
If you check /usr/src/etc/ntp.conf you will notice freebsd project people are running their own ntp servers , by default ntpd will use this servers to fetch timing information. The exact server hosts which as of time of writting are used can be seen in ntp.conf and are:
server 0.freebsd.pool.ntp.org iburst maxpoll 9

server 1.freebsd.pool.ntp.org iburst maxpoll 9

server 2.freebsd.pool.ntp.org iburst maxpoll 9
2. Add ntpd daemon to load on system boot via /etc/rc.conf
By default ntpd is disabled on FreeBSD, you can see if it is disabled or enabled by invoking:
freebsd# /etc/rc.d/ntpd rcvar

# ntpd

ntpd_enable=NO
To Enable ntpd to get loaded each time it boots , following 3 lines has to be added in /etc/rc.conf .
ntpdate_enable="YES"

ntpdate_flags="europe.pool.ntp.org"

ntpd_enable="YES"
Quick way to add them is to use echo :
echo 'ntpdate_enable="YES" >> /etc/rc.conf

echo 'ntpdate_flags="europe.pool.ntp.org" >> /etc/rc.conf

echo 'ntpd_enable="YES" >> /etc/rc.conf
Now as the 3 rc.conf vars are set to "YES", the ntpd can be started. Without having this variables in /etc/rc.conf , "/etc/rc.d/ntpd start" will refuse to start ntpd.
3. Start the ntpd service
freebsd# /etc/rc.d/ntpd start

...
One interesting note to make is ntpd can also operate without specifying any config file (/etc/ntp.conf), the only requirement for the server to start is to have a properly set ntpdate server, like lets say (ntpdate_flags="europe.pool.ntp.org")
4. Permit only certain host or localhost to "talk" to the ntpd server
If you want to imply some ntp server restrictions, the configuration directives are same like on Linux:
To allow only a a host inside a local network with IP 192.168.0.2 as well as localhost, to be able to fetch time information via ntpd server put inside /etc/ntp.conf:
restrict 127.0.0.1

restrict 192.168.0.1 mask 255.255.255.0 nomodify notrap
If you want to prohibit ntpd to serve as a Network Time Server, to any other host except localhost, add in /etc/ntp.conf :
restrict default ignore
Allowing and denying certain hosts can be also done on pf (packet filter) or ipfw firewall level, and in my view is easier (and less confusing), than adding restrictions through ntp.conf. Besides that using directly the server firewall to apply restrictions is more secure. If for instance a remote exploit vulnerability is discovered affecting your ntpd server. this will not affect you externally as access to the UDP port 123 will be disabled on a firewall level.
Something good to mention is NTP servers communicate between each other using the UDP source/destination (port 123). Hence if the NTPD server has to be publicly accessible and there is a firewall already implemented, access to source/dest port 123 should be included in the configured firewall …
5. Check if the ntp server is running properly / ntp server query operations
[root@pcfreak /home/hipo]# ps axuww|grep -i ntp
root 15647 0.0 0.2 4672 1848 ?? Ss 2:49PM 0:00.04 /usr/sbin/ntpd -c /etc/ntp.conf -p /var/run/ntpd.pid -f /var/db/ntpd.drift
To query the now running ntpd server as well as set various configuration options "on the fly" (e.g. without need for ntp.conf edits and init script restart), a tool called ntpdc exists. ntpdc tool could be used to connect to localhost running ntpd as well as to connect and manage remotely a ntpd server.
The most basic use of ntpdc is to check (server peers).:
freebsd# ntpdc localhost

ntpdc> peers

remote local st poll reach delay offset disp

===================================================
kgb.comnet.bg 83.228.93.76 2 64 377 0.00282 -0.050575 0.06059

*billing.easy-la 83.228.93.76 2 64 377 0.01068 -0.057400 0.06770

=ns2.novatelbg.n 83.228.93.76 2 64 377 0.01001 -0.055290 0.06058
ntpdc has also a non-interactive interface, handy if there is a need for requests to a ntpd to be scripted. To check ntpd server peers non-interactively:
freebsd# ntpdc -p localhost

===================================================

kgb.comnet.bg 83.228.93.76 2 64 377 0.00284 -0.043157 0.06184

=billing.easy-la 83.228.93.76 2 64 377 0.01059 -0.042648 0.05811

*ns2.novatelbg.n 83.228.93.76 2 64 377 0.00996 -0.041097 0.06094
ntpdc has plenty of other ntpd query options, e.g. :
ntpdc> help

ntpdc commands:

addpeer controlkey fudge keytype quit timeout

addrefclock ctlstats help listpeers readkeys timerstats

addserver debug host loopinfo requestkey traps

addtrap delay hostnames memstats reset trustedkey

authinfo delrestrict ifreload monlist reslist unconfig

broadcast disable ifstats passwd restrict unrestrict

clkbug dmpeers iostats peers showpeer untrustedkey

clockstat enable kerninfo preset sysinfo version

clrtrap exit keyid pstats sysstats
ntpdc is an advanced query tool for ntpd , servers. Another tool exists called ntpq which syntax is almost identical to ntpdc . The main difference between the two is ntpq is a monitoring tool mostly used just for monitoring purposes, where ntpdc can also change plenty of things in the server configuration.
For people who want to learn more on ntpd the man page is a great reading , containing chapters describing thoroughfully exactly how NTPD time servers operate, etc.
Tags: basis, basis system, boots, comnet, configure, daemon, doesn, echo echo, europe, file, flags, freebsd handbook, freebsd kernel, freebsd system, freebsd world, gnu linux, handbook, iburst, information, level, Linux, localhost, maxpoll, nbsp, necessery, need, ntp servers, ntpd, ntpdate, ntpdc, ntpq, package, pool, quot, root, rpf, server clock, server hosts, system boot, time, timing, tool, variables, writting, YES
Posted in FreeBSD, System Administration | 1 Comment »


