
Recent days, I'm spending a lot of time again trying to optimize my wordpress blog. Optimizing WP for better efficiency is becoming harder and harder task day by day as the website file content data is growing along with SQL databases. Moreover situation gets even worse because the number of plugins enabled on my blog is incrementally growing with time because, there is more and more goodies I'd like to add.
Optimizing WordPress to run for Speed on a server is a whole a lot of art and its a small universe in itself, because as of time of writting this post the count (number) of WordPress available PLUGINS is 36,197 !
1. Manually Tracking WordPress Plugins causing Slow SQL Queries (MySQL bottleneck) issues directly using console / SSH
Because of its open source development and its nice modular design wordpress has turned into a standard for building small, middle sized and large websites (some WordPress based blogs and sites have from 50 000 to 100 000 unique pages!). My blog is still a small WordPress site with only 1676 posts, so I still haven't reached the high volume traffic optimization requirements but still even though I have a relatively good server hardware 8GB RAM / (2×2.70 Ghz Intel CPU) / 500 GB (7400 RPM HDD) at times I see Apache Webservers is unable to properly serve coming requests because of MySQL database (LEFT JOIN) requests being slow to serve (taking up to few seconds to complete) and creating a MySQL table lock, putting all the rest SQL queries to stay in a long unserved queues line, I've realized about this performance issue by using a a mysql cli (command) client and few commands and console command (tool) called mytop (also known as mtop). MyTop refreshes every 3 seconds, so the slow query will immediately stay on screen to view moer info about it press "f" and type the in query ID.
![]()
![]()
Finally it is very useful to run for a while MySQL server logging to /var/log/mysql/slow-query.log:
Slow query is enabled (on my Debian 7 Wheezy host) by adding to /etc/mysql/my.cnf after conf section
vim /etc/mysql/my.cnf
#
# * Logging and Replication
#
# Both location gets rotated by the cronjob.
# Be aware that this log type is a performance killer.
# As of 5.1 you can enable the log at runtime!
#general_log_file = /var/log/mysql/mysql.log
#general_log = 1
#
# Error logging goes to syslog due to /etc/mysql/conf.d/mysqld_safe_syslog.cnf.
#
# Here you can see queries with especially long duration
Paste:
slow_query_log = 1
slow_query_log_file = /var/log/mysql/slow-query.log
long_query_time = 2
log-queries-not-using-indexes
And then to make new mysql configuration load restarted mysql server:
debian-server:~# /etc/init.d/mysql restart
Stopping MySQL database server: mysqld.
Starting MySQL database server: mysqld ..
Checking for tables which need an upgrade, are corrupt or were
not closed cleanly..
Leaving mysql-slow.log to be enabled for 30 minutes to an 1 hrs is a good time to track most problematic slow queries and based on this queries, I took parts of SQL UPDATE / SELECT / INSERT etc. Db queries which was problematic and grepped throughout /var/www/blog/wp-content/plugin files in order to determine which WordPress Plugin is triggering the slow query, causing blog to hang when too many clients try to see it in browser.
My main problematic SQL query having long execution time (about 2 to 3 seconds!!!) most commonly occuring in slow-query.log was:
SELECT DISTINCT post_title, ID, post_type, post_name FROM wp_posts wposts LEFT JOIN wp_postmeta wpostmeta ON wposts.ID = wpostmeta.post_id LEFT JOIN wp_term_relationships ON (wposts.ID = wp_term_relationships.object_id) LEFT JOIN wp_term_taxonomy ON (wp_term_relationships.term_taxonomy_id = wp_term_taxonomy.term_taxonomy_id) WHERE (post_type='page' OR (wp_term_taxonomy.taxonomy = 'category' AND wp_term_taxonomy.term_id IN(11))) AND post_status = 'publish' AND LENGTH(post_title)>=5 ORDER BY LENGTH(post_title) ASC LIMIT 500
Because above query uses SQL Column names and Tables which are not hard coded in PHP code, to find out which plugins is most probably to launch this complex LEFT JOIN query, I used a quick bash one-liner:
# cd /var/www/blog/wp-content/plugins
# for i in $(grep -rli 'SELECT DISTINCT' *); do grep -rli 'LEFT JOIN' $i; done
./seo-automatic-links/seo-links.php
./wp-postviews/wp-postviews.php
./yet-another-related-posts-plugin/classes/YARPP_Cache_Tables.php
I wanted to put less load on CPU during grep so looked for string only in .PHP extensioned files with:
# for i in $(find . -iname '*.php' -exec grep -rli 'SELECT DISTINCT' '{}' \;); do grep -rli 'LEFT JOIN' $i; done
./seo-automatic-links/seo-links.php
./wp-postviews/wp-postviews.php
./yet-another-related-posts-plugin/classes/YARPP_Cache_Tables.php
As you can see the complex query is being called from PHP file belonging to one of 3 plugins
- SEO Automatic Links – this is SEO Smart Links WP plugin (Does internal bliog interlinking in order to boast SEA)
- WP PostViews – WordPress Post Views plugin (Which allows me to show how many times an article was read in WP Widget menu)
- Yet Another Related Posts – Which is WP plugin I installed / enabled to show Related posts down on each blog post
2. Basic way to optimize MySQL slow queries (EXPLAIN / SHOW CREATE TABLE)
Now as I have a basic clue on plugins locking my Database, I disabled them one by one while keeping enabled mysql slow query log and viewing queries in mytop and I figure out that actually all of the plugins were causing a short time overheat (lock) on server Database because of LEFT JOINs. Though I really like what this plugins are doing, as they boast SEO and attract prefer to disable them for now and have my blog all the time responsible light fast instead of having a little bit better Search Engine Optimization (Ranking) and loosing many of my visitors because they're annoyed to wait until my articles open …
Before disabling I tried to optimize the queries using MySQL EXPLAIN command + SHOW CREATE TABLE (2 commands often used to debug slow SQL queries and find out whether a Column needs to have added INDEX-ing to boast MySQL query).
Just in case if you decide to give them a try here is example on how they're used to debug problematic SQL query:
- mysql> explain SELECT DISTINCT post_title, ID, post_type, post_name
- -> FROM wp_posts wposts LEFT JOIN wp_postmeta wpostmeta
- -> ON wposts.ID = wpostmeta.post_id LEFT JOIN wp_term_relationships
- -> ON (wposts.ID = wp_term_relationships.object_id) LEFT JOIN wp_term_taxonomy
- -> ON (wp_term_relationships.term_taxonomy_id = wp_term_taxonomy.term_taxonomy_id)
- -> WHERE (post_type='page'
- -> OR (wp_term_taxonomy.taxonomy = 'category'
- -> AND wp_term_taxonomy.term_id IN(11,15,17)))
- -> AND post_status = 'publish'
- -> AND LENGTH(post_title)>=5
- -> ORDER BY LENGTH(post_title) ASC
- -> LIMIT 500;
- +—-+————-+———————–+——–+——————+———+———+———————————————+——+———————————————-+
- | id | select_type | table | type | possible_keys | key | key_len | ref | rows | Extra |
- +—-+————-+———————–+——–+——————+———+———+———————————————+——+———————————————-+
- | 1 | SIMPLE | wposts | ALL | type_status_date | NULL | NULL | NULL | 1715 | Using where; Using temporary; Using filesort |
- | 1 | SIMPLE | wpostmeta | ref | post_id | post_id | 8 | blog.wposts.ID | 11 | Using index; Distinct |
- | 1 | SIMPLE | wp_term_relationships | ref | PRIMARY | PRIMARY | 8 | blog.wposts.ID | 19 | Using index; Distinct |
- | 1 | SIMPLE | wp_term_taxonomy | eq_ref | PRIMARY | PRIMARY | 8 | blog.wp_term_relationships.term_taxonomy_id | 1 | Using where; Distinct |
- +—-+————-+———————–+——–+——————+———+———+———————————————+——+———————————————-+
- 4 rows in set (0.02 sec)
-
- mysql>
-
- mysql> show create table wp_posts;
- +———-+————————–+
- | Table | Create Table |
- +———-+————————–+
- | wp_posts | CREATE TABLE `wp_posts` (
- `ID` bigint(20) unsigned NOT NULL AUTO_INCREMENT,
- `post_author` bigint(20) unsigned NOT NULL DEFAULT '0',
- `post_date` datetime NOT NULL DEFAULT '0000-00-00 00:00:00',
- `post_date_gmt` datetime NOT NULL DEFAULT '0000-00-00 00:00:00',
- `post_content` longtext NOT NULL,
- `post_title` text NOT NULL,
- `post_excerpt` text NOT NULL,
- `post_status` varchar(20) NOT NULL DEFAULT 'publish',
- `comment_status` varchar(20) NOT NULL DEFAULT 'open',
- `ping_status` varchar(20) NOT NULL DEFAULT 'open',
- `post_password` varchar(20) NOT NULL DEFAULT '',
- `post_name` varchar(200) NOT NULL DEFAULT '',
- `to_ping` text NOT NULL,
- `pinged` text NOT NULL,
- `post_modified` datetime NOT NULL DEFAULT '0000-00-00 00:00:00',
- `post_modified_gmt` datetime NOT NULL DEFAULT '0000-00-00 00:00:00',
- `post_content_filtered` longtext NOT NULL,
- `post_parent` bigint(20) unsigned NOT NULL DEFAULT '0',
- `guid` varchar(255) NOT NULL DEFAULT '',
- `menu_order` int(11) NOT NULL DEFAULT '0',
- `post_type` varchar(20) NOT NULL DEFAULT 'post',
- `post_mime_type` varchar(100) NOT NULL DEFAULT '',
- `comment_count` bigint(20) NOT NULL DEFAULT '0',
- PRIMARY KEY (`ID`),
- KEY `post_name` (`post_name`),
- KEY `type_status_date` (`post_type`,`post_status`,`post_date`,`ID`),
- KEY `post_parent` (`post_parent`),
- KEY `post_author` (`post_author`),
- FULLTEXT KEY `post_related` (`post_title`,`post_content`)
- ) ENGINE=MyISAM AUTO_INCREMENT=12033 DEFAULT CHARSET=utf8 |
- +———-+———————-+
- 1 row in set (0.00 sec)
-
- mysql>
-
By the way above output is a paste from the the new PasteBin Open Source (Stikked powered) service I started on www.pc-freak.net – paste.www.pc-freak.net (p.www.pc-freak.net) 🙂
Before I took final decision to disable slow WP plugins, I've experimented a bit trying to add INDEX to Table Column (wposts) in hope that this would speed up SQL queries with:
mysql> ALTER TABLE TABLE_NAME ADD INDEX (wposts);
…
But this didn't improve query speed even on the contrary it make execution time worse.
3. Tracking WordPress Plugin PHP Code Execution time and Plugins causing Slow SQL Queries (MySQL bottleneck) issues through WP itself
Well fine, I'm running my own hosted Blog and WordPress sites, but for people who have wordpress sites on shared hosting, there is usually no SSH (Terminal) Access to server, those people will be happy to hear there are 2 Free easy installable WordPress plugins which can be used to Debug Slow WordPress Plugins SQL Queries as well as plugin to Track which plugin takes most time to execute, this are:
- WordPress Query Monitor
- (P3 Plugin Performance Profiler)
- WordPress Memory Viewer plugin
- WordPress DebugBar Memory reporter plugin
a) P3 Plugin Performance Profiler
runs a scan over your site to determine what resources your plugins are using, and when, during a standard page request. P3 PPP Can even create reports in a beatiful Excel like Pie chart sheet.
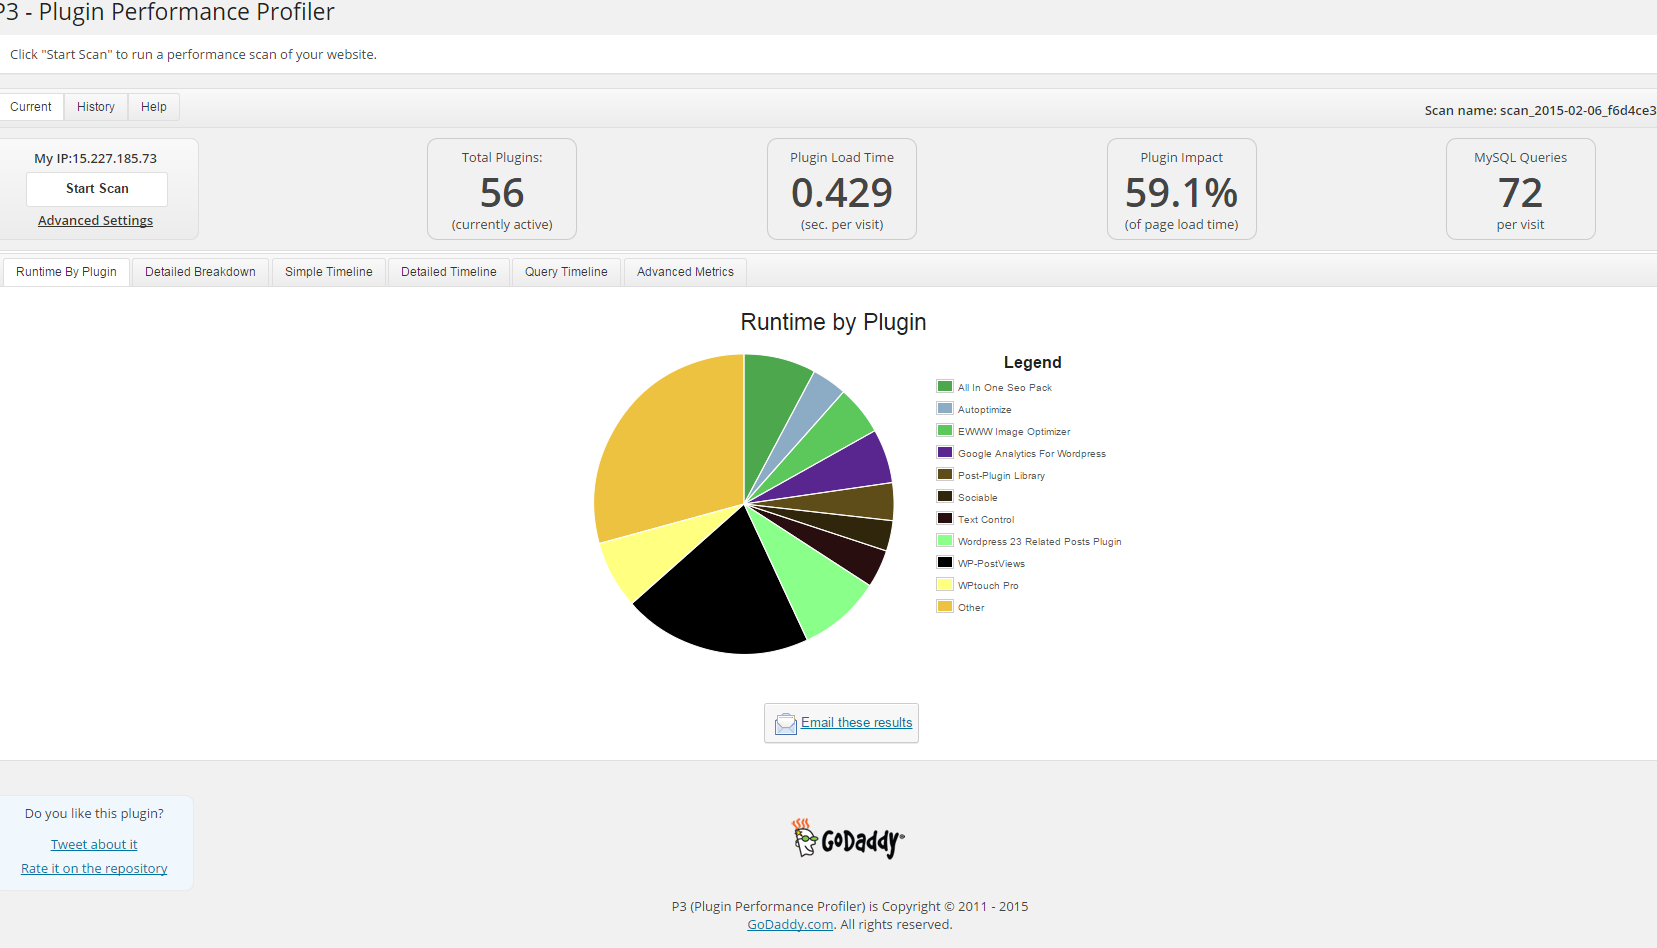
Another useful thing to see with P3 PPP is Detailed Timeline it shows when the plugins are being loaded during new page request so you can see if there is a certain sequence in time when a plugin slows down the website.
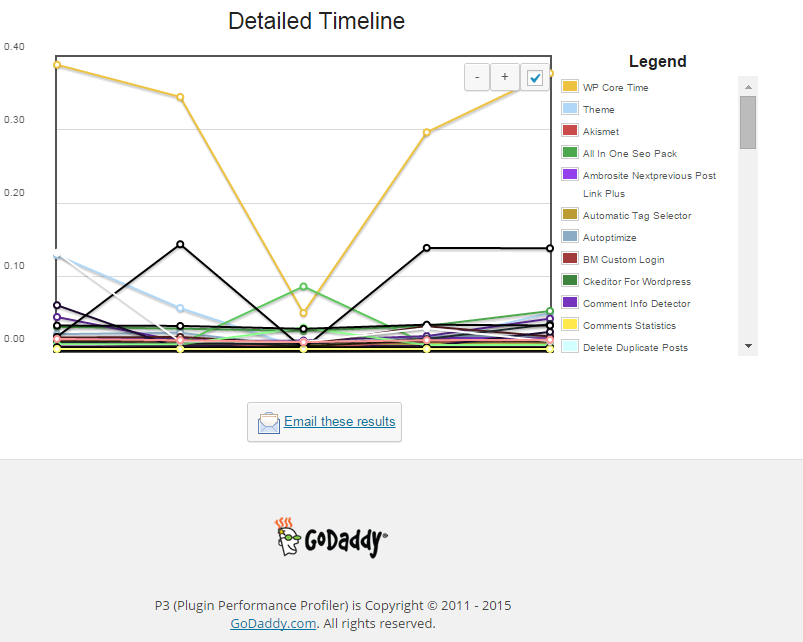
The pictures says it all as P3 PPP is Godaddy's work, congrats to GoDaddy, they've done great job.
b) WordPress memory Viewer WP plugins
Is useful to check how much memory each of WordPress plugin is taking on user (visitor) request.
Memory Viewer is allows you to view WordPress’ memory utilization at several hooks during WordPress’ execution. It also shows a summary of MySQL Queries that have ran as well as CPU time.
To use it download it to plugins/ folder as usual enable it from:
Installed Plugins -> (Inactive) -> Memory Viewer (Enable)
To see statistics from Memory Viewer open any post from your blog website and scroll down to the bottom you will notice the statistics, showing up there, like on below screenshot.
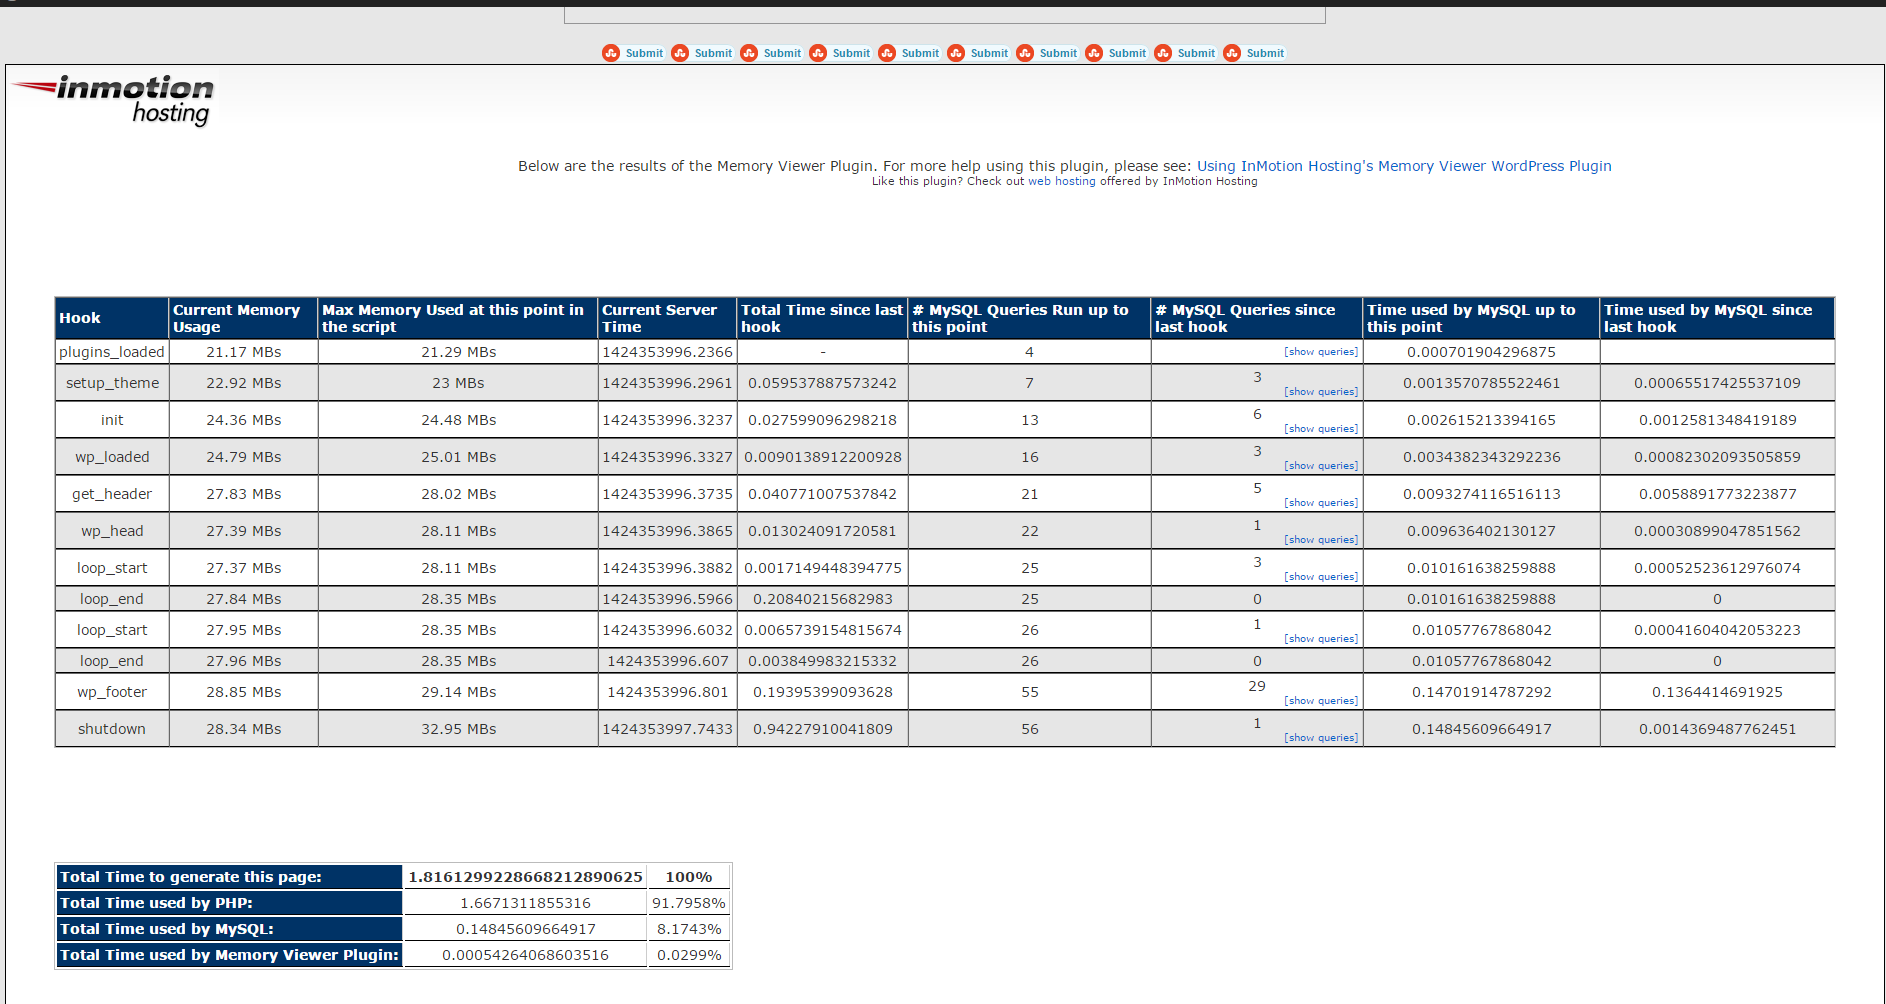
Though WP Memory Viewer is said to work only up to WP version 3.2.1, I've tested it and it works fine on my latest stable WordPress 4.1 based blog.
c) WordPress Query Monitor
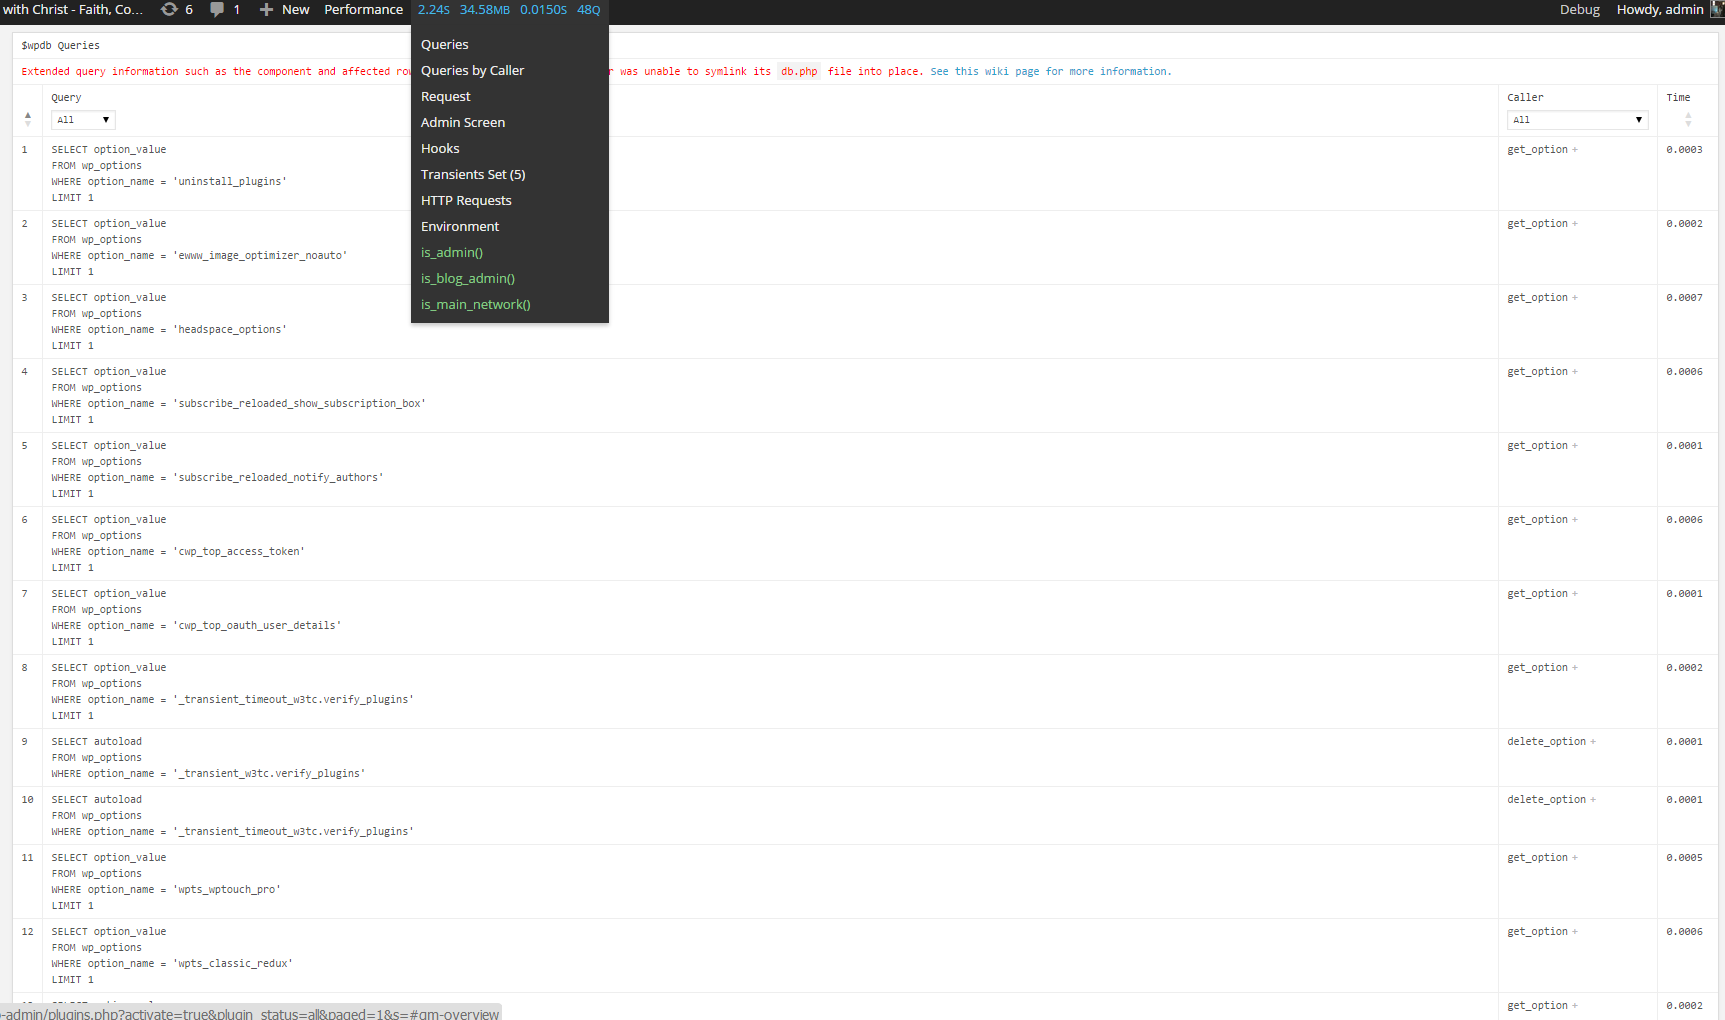
Query Monitor is a debugging plugin for anyone developing with WordPress but also very helpful for anyone who want to track issues with plugins who use the database unefficient.
It has some advanced features not available in other debugging plugins, including automatic AJAX debugging and the ability to narrow down things by plugin or theme.
You can view plenty of precious statistics on how enabled plugins query the database server, here is a short overview on its Database Queries capabilities:
- Shows all database queries performed on the current page
- Shows affected rows and time for all queries
- Show notifications for slow queries and queries with errors
- Filter queries by query type (SELECT, UPDATE, DELETE, etc)
- Filter queries by component (WordPress core, Plugin X, Plugin Y, theme)
- Filter queries by calling function
- View aggregate query information grouped by component, calling function, and type
- Super advanced: Supports multiple instances of wpdb on one page
- Once enabled from Plugins you will see it appear as a new menu on bottom Admin raw.
An important note to make here is latest Query Monitor extension fails when loaded on current latest Wordpress 4.1, to use it you will have to download and useolder Query Monitor plugin version 2.6.8 you can download it from here
d) Debug Bar
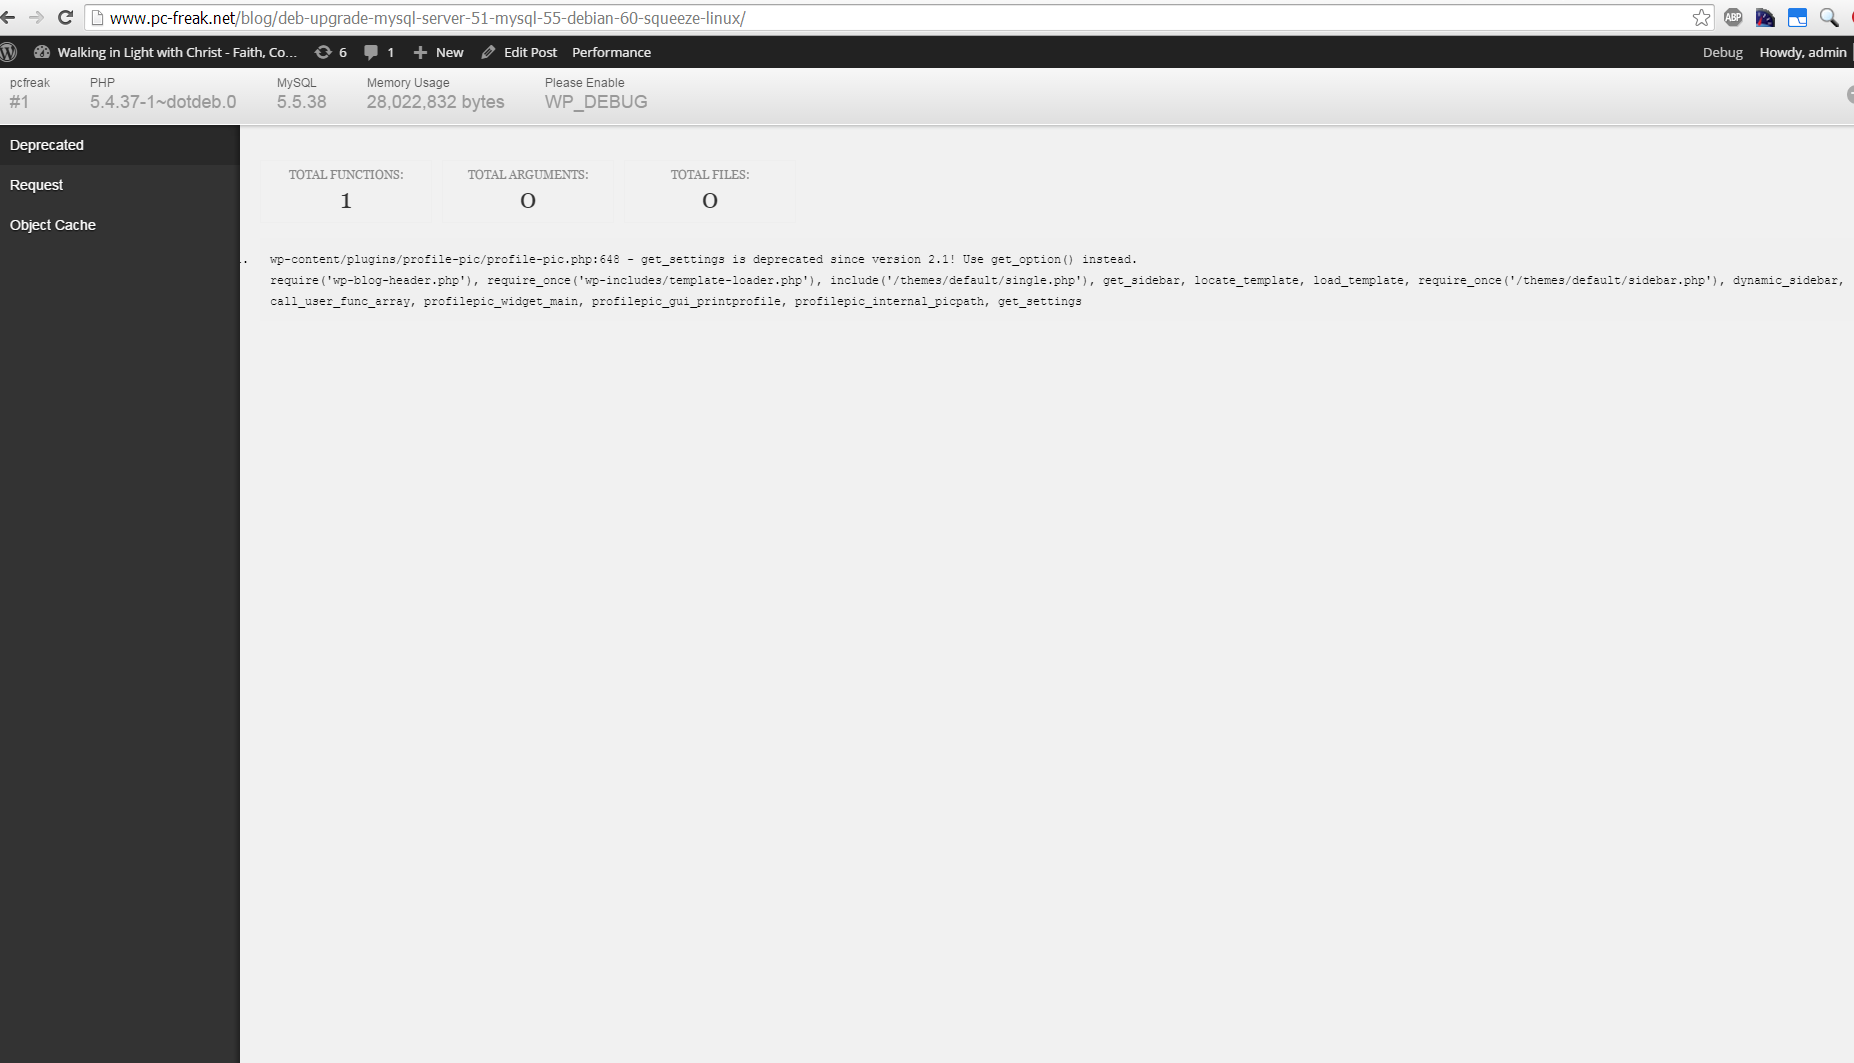
If you want you want a Memory Viewer like plugin for more complex used components memory debugging, reporting if (WP_DEBUG is set in wp-config.php) also check out Debug Bar .
For me Debug Bar was very useful because it show me depreciated functions some plugins used, so I substituted the obsoleted function with new one.
4. Server Hardware hungry (slow) WordPress plugins that you better not use
While spending time to Google for some fixes to WP slow query plugins – I've stumbled upon this post giving a good list with WordPress Plugins better off not to use because they will slow down your site
This is a publicly well known list of WP plugins every WordPress based site adminstrator should avoid, but until today I didn't know so my assumption is you don't know either ..
Below plugins are extremely database intensive mentioned in article that we should better (in all cases!) avoid:
- Dynamic Related Posts
- SEO Auto Links & Related Posts
- Yet Another Related Posts Plugin
- Similar Posts
- Contextual Related Posts
- Broken Link Checker — Overwhelms even our robust caching layer with an inordinate amount of HTTP requests.
- MyReviewPlugin — Slams the database with a fairly significant amount of writes.
- LinkMan — Much like the MyReviewPlugin above, LinkMan utilizes an unscalable amount of database writes.
- Fuzzy SEO Booster — Causes MySQL issues as a site becomes more popular.
- WP PostViews — Inefficiently writes to the database on every page load. To track traffic in a more scalable manner, both the stats module in Automattic’s Jetpack plugin and Google Analytics work wonderfully.
- Tweet Blender — Does not play nicely with our caching layer and can cause increased server load.
There are few alternatives to this plugins and when I have some free time I will download and test their alternatives but for now I plan the plugins to stay disabled.
For the absolute WP Performance Optimization Freaks, its good to check out the native way to Debug a wordpress installation through using few embedded
variables
define('WP_DEBUG', true);
define('WP_DEBUG', false);
define('WP_DEBUG_LOG', true);
define('WP_DEBUG_DISPLAY', false);
define('SAVEQUERIES', true);
An article describing how you can use native WP debug variables is here
Happy Optimizing ! 🙂


