If you're pissed off too already of GNOME 3 Unity / GNOME 3 Flashback and KDE Plasma as I am you perhaps are looking for something more light weigth but you're not okay with default Debian Cinnanom GUI environment or you don't feel confortable for system administration jobs and programming with XFCE then perhaps you would like to give a try to something more old school but build with good design in Mind.
Those who are fans of the evil genius Steve Jobs (as Richard Stallman use to call him), definitely Remember NeXT company and the revolutionary Graphic Environment they tried to develop NeXT Step then you'll be happy to hear about GNUStep which historically was called AfterStep and is a Free Software remake of NextStep graphical environment for Free and Open Source operating systems (FOSS) such as GNU / Linux and FreeBSD / OpenBSD / NetBSD etc.

Amanda the Panda is the mascot of Window Maker. She was designed by Agnieszka Czajkowska.
The good thing about Window Maker and the complete bunch of desktop environment GNUStep is it much lighter and less complex than the more and more becoming bloated modern Free Software graphical environments, it definitely easifies the way the user interacts with basic browsing with Firefox / Opera, terminal code writting or command system administration and basic chat functionalities such as with Gajim or Pidgin and basic email writting operatins be it with some text email client such as Mutt or with Thunderbird. Its great also to reduce the overall load the Operating System puts on your brain so you can have more time to invest in more useful stuff like programming.
After all simplicity in Operating System is a key for an increased productivity with your computer.
Besides that stability of Window Maker is much better when compared to GNOME and GNOME 2 fork MATE graphical environment which nowadays in my opinion is becoming even more buggy than it used to be some years ago.
Below is how Window Makers site describes Window Maker:
"Window Maker is an X11 window manager originally designed to provide integration support for the GNUstep Desktop Environment. In every way possible, it reproduces the elegant look and feel of the NEXTSTEP user interface. It is fast, feature rich, easy to configure, and easy to use. It is also free software, with contributions being made by programmers from around the world.
Window Maker has a stable user interface since many years and comes with a powerful GUI configuration editor called WPrefs, which removes the need to edit text-based config files by hand. It supports running dockapps which make everyday tasks such as monitoring system performance and battery usage, mounting devices or connecting to the internet very easy. Please see the features section for more specifics on what Window Maker can do, and how it compares with other popular window managers."
Window Maker is bundled with a number of useful applications which gives ability to put Dock applets easily for easily intearcive desktop update of current Weather Report, Monitoring Network Traffic, TV Player (video4linux), laptop battery info dock, CD player and Volume control management app, text editor, pdf viewer, integrated Mail application, Calculator, RSS Reader, GNUStep games and much useful things to customize from the desktop resembling many of the basic features any other graphical environment such as GNOME / KDE Provides.
The User Interface (UI) of Window Maker is highly configurable with an integrated WMaker tool called
WPrefs
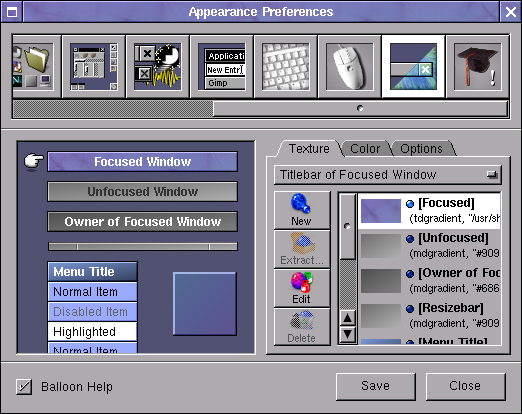
All generated settings from WPrefs (Window Maker Prefernces) GUI tool are to be stored in a plaintext file:
~/GNUstep/Defaults/WMRootMenu
All Wmaker configurations are stored inside ~/GNUstep/ (Your user home GNUStep), so if you're to become its user sooner or later you will have to get acquired to it.
Wmaker is very minimalist and the performance is killing so Window Maker is perhaps the number one choice Graphical Environment to use on Old Computers with Linux and BSD.
Below is a full list of all packages installed on my Debian GNU / Linux that provides WMaker / GNUStep great functionalities:
root@jericho:/home/hipo# dpkg -l |grep -i wmaker; dpkg -l |grep -i gnustep
ii wmaker 0.95.8-2 amd64 NeXTSTEP-like window manager for X
ii wmaker-common 0.95.8-2 all Window Maker – Architecture independent files
ii wmbattery 2.50-1+b1 amd64 display laptop battery info, dockable in WindowMaker
ii wmcdplay 1.1-2+b1 amd64 CD player based on ascd designed for WindowMaker
ii wmifs 1.8-1 amd64 WindowMaker dock app for monitoring network traffic
ii wmnut 0.66-1 amd64 WindowMaker dock app that displays UPS statistics from NUT's upsd
ii wmpuzzle 0.5.2-2+b1 amd64 WindowMaker dock app 4×4 puzzle
ii wmrack 1.4-5+b1 amd64 Combined CD Player + Mixer designed for WindowMaker
ii wmtv 0.6.6-1 amd64 Dockable video4linux TV player for WindowMaker
ii wmweather 2.4.6-2+b1 amd64 WindowMaker dockapp that shows your current weather
ii wmweather+ 2.15-1.1+b2 amd64 WindowMaker dock app that shows your current weather
ii addressmanager.app 0.4.8-2+b2 amd64 Personal Address Manager for GNUstep
ii agenda.app 0.42.2-1+b7 amd64 Calendar manager for GNUstep
ii charmap.app 0.3~rc1-3 amd64 Character map for GNUstep
ii charmap.app-common 0.3~rc1-3 all Character map for GNUstep (arch-independent files)
ii cynthiune.app 1.0.0-1+b4 amd64 Music player for GNUstep
ii dictionaryreader.app 0+20080616+dfsg-2+b6 amd64 Dict client for GNUstep
ii edenmath.app 1.1.1a-7.1+b1 amd64 Scientific calculator for GNUstep
ii gnumail.app 1.2.2-1.1 amd64 Mail client for GNUstep
ii gnumail.app-common 1.2.2-1.1 all Mail client for GNUstep (common files)
ii gnustep 7.8 all User applications for the GNUstep Environment
ii gnustep-back-common 0.25.0-2 amd64 GNUstep GUI Backend – common files
ii gnustep-back0.25 0.25.0-2 all GNUstep GUI Backend
ii gnustep-back0.25-cairo 0.25.0-2 amd64 GNUstep GUI Backend (cairo)
ii gnustep-base-common 1.24.9-3.1 all GNUstep Base library – common files
ii gnustep-base-doc 1.24.9-3.1 all Documentation for the GNUstep Base Library
ii gnustep-base-runtime 1.24.9-3.1 amd64 GNUstep Base library – daemons and tools
ii gnustep-common 2.7.0-1 amd64 Common files for the core GNUstep environment
ii gnustep-core-devel 7.8 all GNUstep Development Environment — core libraries
ii gnustep-core-doc 7.8 all GNUstep Development Environment — core documentation
ii gnustep-devel 7.8 all GNUstep Development Environment — development tools
ii gnustep-games 7.8 all GNUstep games
ii gnustep-gui-common 0.25.0-4 all GNUstep GUI Library – common files
ii gnustep-gui-doc 0.25.0-4 all Documentation for the GNUstep GUI Library
ii gnustep-gui-runtime 0.25.0-4+b1 amd64 GNUstep GUI Library – runtime files
ii gnustep-icons 1.0-5 all Several free icons for use with GNUstep and others
ii gnustep-make 2.7.0-1 all GNUstep build system
ii gnustep-make-doc 2.7.0-1 all Documentation for GNUstep Make
ii gomoku.app 1.2.9-2+b2 amd64 Extended TicTacToe game for GNUstep
ii gorm.app 1.2.23-1 amd64 Visual Interface Builder for GNUstep
ii gridlock.app 1.10-4+b2 amd64 Collection of grid-based board games for GNUstep
ii grr.app 1.0-1+b2 amd64 RSS reader for GNUstep
ii gworkspace-common 0.9.3-1 all GNUstep Workspace Manager – common files
ii gworkspace.app 0.9.3-1+b2 amd64 GNUstep Workspace Manager
ii helpviewer.app 0.3-8+b3 amd64 Online help viewer for GNUstep programs
ii libaddresses0 0.4.8-2+b2 amd64 Database API backend framework for GNUstep (library files)
ii libaddressview0 0.4.8-2+b2 amd64 Address display/edit framework for GNUstep (library files)
ii libgnustep-base-dev 1.24.9-3.1 amd64 GNUstep Base header files and development libraries
ii libgnustep-base1.24 1.24.9-3.1 amd64 GNUstep Base library
ii libgnustep-gui-dev 0.25.0-4+b1 amd64 GNUstep GUI header files and static libraries
ii libgnustep-gui0.25 0.25.0-4+b1 amd64 GNUstep GUI Library
ii libpantomime1.2 1.2.2+dfsg1-1 amd64 GNUstep framework for mail handling (runtime library)
ii libpopplerkit0 0.0.20051227svn-7.1+b9 amd64 GNUstep framework for rendering PDF content (library files)
ii libpreferencepanes1 1.2.0-2+b2 amd64 GNUstep preferences library – runtime library
ii librenaissance0 0.9.0-4+b6 amd64 GNUstep GUI Framework – library files
ii librenaissance0-dev 0.9.0-4+b6 amd64 GNUstep GUI Framework – development files
ii librsskit0d 0.4-1 amd64 GNUstep RSS framework (runtime library)
ii mknfonts.tool 0.5-11+b5 amd64 Create nfont packages for GNUstep
ii price.app 1.3.0-1 amd64 Image filtering and manipulation using GNUstep
ii projectcenter.app 0.6.2-1 amd64 IDE for GNUstep Development
ii renaissance-doc 0.9.0-4 all GNUstep GUI Framework – documentation
ii systempreferences.app 1.2.0-2+b2 amd64 GNUstep preferences application
ii terminal.app 0.9.8.1-1 amd64 Terminal Emulator for GNUstep
ii textedit.app 4.0+20061029-3.5+b1 amd64 Text editor for GNUstep
ii viewpdf.app 1:0.2dfsg1-5+b2 amd64 Portable Document Format (PDF) viewer for GNUstep
ii zipper.app 1.5-1+b2 amd64 Archive manager for GNUstep
Well yes it is true Window Maker is not a spoon for every mouth, those who want to have more confortable desktop environment better look out at other options as Window Maker is Unix / Linux graphical environment that fits better hackers, computer developers and system administrators.
Anyhow if you have some old family member that has to use an old computer architecture and the person is only to use mainly just browser to check email, youtube and basic surfing then Wmaker will be a great choice as it will consume little CPU and Memory much less than the heavy and computer resources sucking GNOME and KDE.
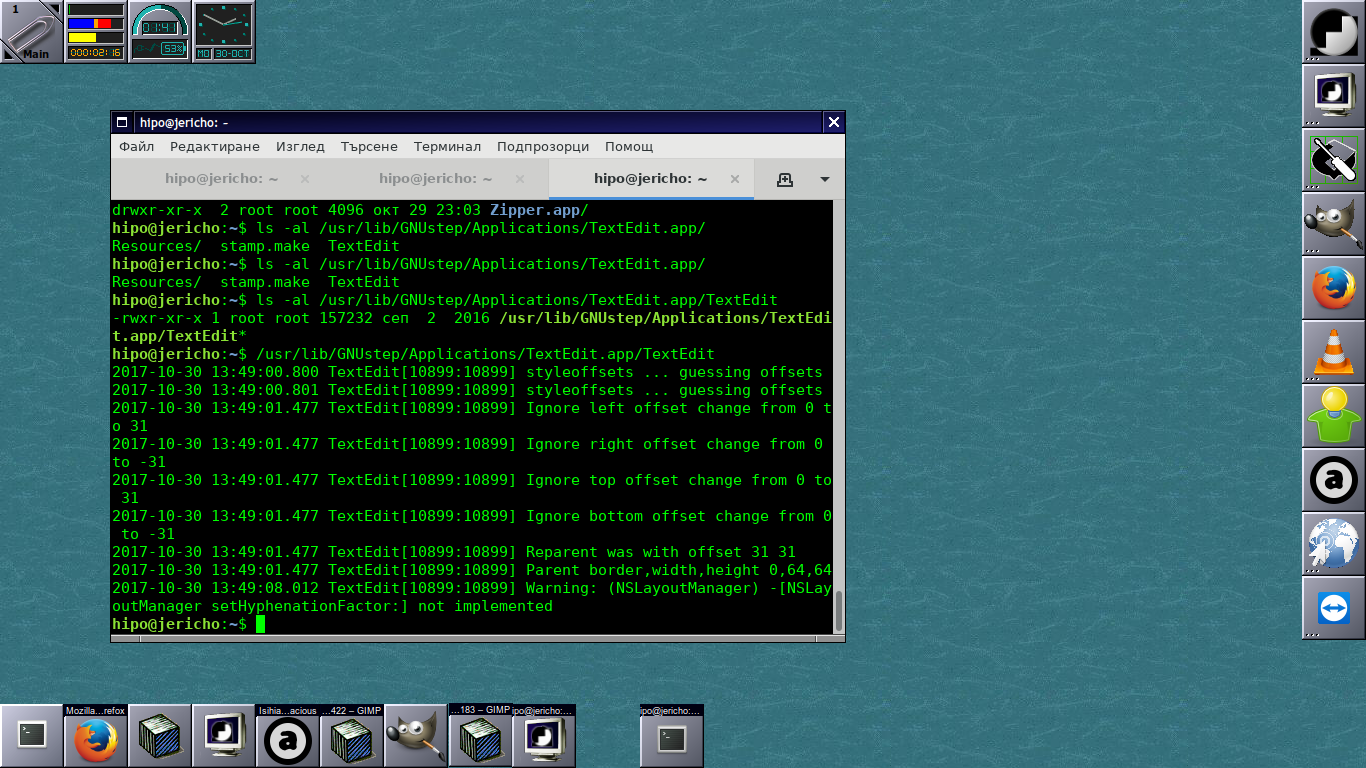
I've historically used Wmaker also with its teminal emulator rxvt (VT102 terminal emulator for the X Windows System) which is a kinda of improved version of xterm (the default terminal program bundled with Xorg server), but for those who are already used to Gnome Terminal nice tabs perhaps that would be not the terminal of choice.
rxvt was build to match well the look and feel of AfterStep and consequently Wmaker, its scrollbar was aiming to very much resemble NeXTStep style scrollbar
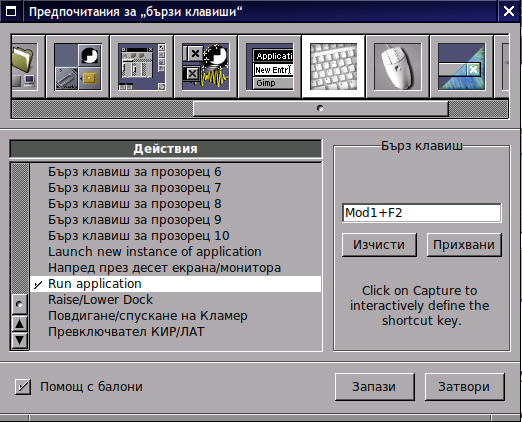
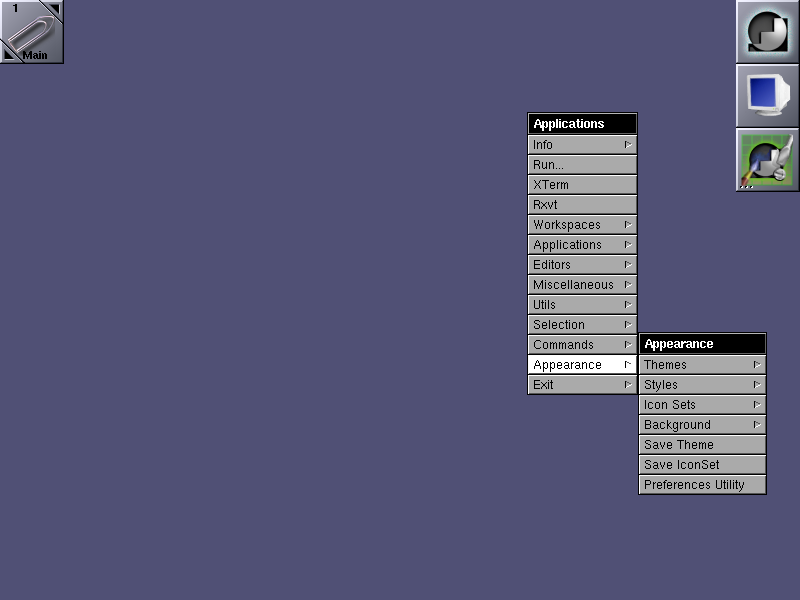
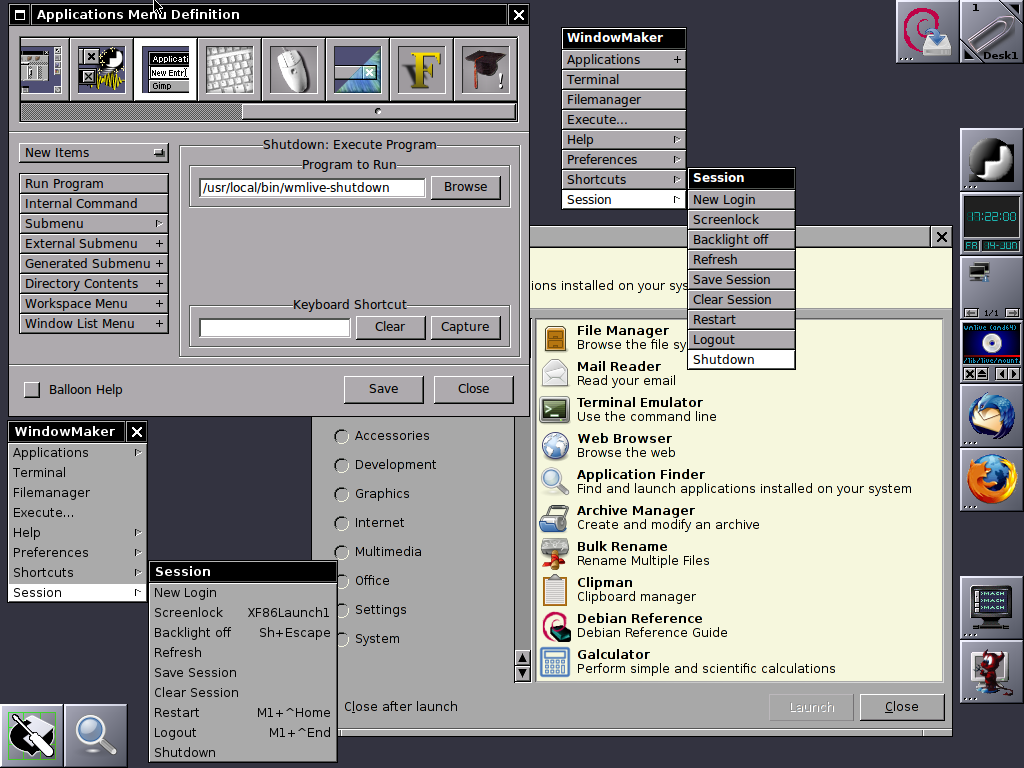
Most "custom" shortcuts are used to launch specific applications. To add your own keyboard shortcut for an application, go to the "Applications Menu Definition" panel in the Preferences app. Select the application item in the menu for which you want to create a shortcut, then use the "capture" button to capture the keystrokes you want to assign to that item. In the screenshot, I've assigned Mod1 + W to open Firefox.
Above screenshot shows how to map the Run Application keyboard bind to behave like GNOME Run application ALT + F2

Customizing background of Window Maker
Because WMaker is so simple made and targetting more of a developer audience for use it doesn't have a special graphical interaface to set a Background if you like so, but instead you need to use a wmsetbg command to do so:
wmsetbg -s -u filename.jpg
WMSetBG command stands for WindowMaker Set Background
If you're too lazy to install and start configuring wmaker, there is a Window Maker LiveCD, you can run Window Maker through LiveCD in Virtual Machine such as VirtualBox to get feeling what you're about to get if you install and start using Wmaker on your Computer.
Well at first with Window Maker you might feel confused and quickly irritating missing the already established way to work with your computer, but that's just for a starter sooner you will realize, that for using a limited number of applications for work wmaker, makes you much more efficient. Moreover using your computer with Wmaker can rewire your brain circuits to think a little bit different.
Once you switched to Window Maker you will likely want to have a graphical option to connect to Wireless Networks especially if you're using Wmaker on a notebook it is convenient to not always manually do scan for networks with
Iwlscan
commad and use wpasupplicant command to connect instead you can just install wicd and stop default Gnome Network Manager (called Network Manager), you can do so by running as root:
service network-manager stop
apt-get install wicd wicd-gtk
service wicd start
wicd-gtk &