Posts Tagged ‘interval’

Monitoring chronyd time service is synchronized, get additional time server values with Zabbix userparameter script

Monday, March 21st, 2022

monitoring-chronyc-time-server-synchronization-zabbix-logo

If you''re running a server infrastructure and your main monitoring system is Zabbix. Then a vital check you might want to setup is to monitor the server time synchronization to a central server. In newer Linux OS-es ntpd time server is started to be used lesser and many modern Linux distributions used in the corporate realm are starting to recommend using chrony as a time synchronization client / server.

In this article, I'll show you how you can quickly setup monitoring of chronyd process and monitoring whether the time is successfully synchronizing with remote Chronyd time server. This will be done with a tiny one liner shell script setup as userparameter It is relatively easy then to setup an Action Alert


1. Create userparameter script to send parsed chronyd time synchronization to Zabbix Server

chronyc tracking provides plenty of useful data which can give many details about info such as offset, skew, root delay, stratum, update interval.

[root@server: ~]# chronyc tracking
Reference ID    : 0A32EF0B (fkf-intp01.intcs.meshcore.net)
Stratum         : 3
Ref time (UTC)  : Fri Mar 18 12:42:31 2022
System time     : 0.000032544 seconds fast of NTP time
Last offset     : +0.000031102 seconds
RMS offset      : 0.000039914 seconds
Frequency       : 3.037 ppm slow
Residual freq   : +0.000 ppm
Skew            : 0.023 ppm
Root delay      : 0.017352410 seconds
Root dispersion : 0.004285847 seconds
Update interval : 1041.6 seconds
Leap status     : Normal

[root@server zabbix_agentd.d]# cat userparameter_chrony.conf 
UserParameter=chrony.json,chronyc -c tracking | sed -e s/'^'/'{"chrony":[“‘/g -e s/’$’/'”]}'/g -e s/','/'","'/g
[root@server zabbix_agentd.d]#

The -c option passed to chronyc is printing the chronyc tracking command ouput data in comma-separated values ( CSV ) format.

2. Create Necessery Item key to get chronyd processes and catch the userparameter data


  • First lets create a an Item key to calculate the chronyd daemon proc.num
    proc.num – simply returns the number of processes in the process list just like a simple
    pgrep servicename command does.
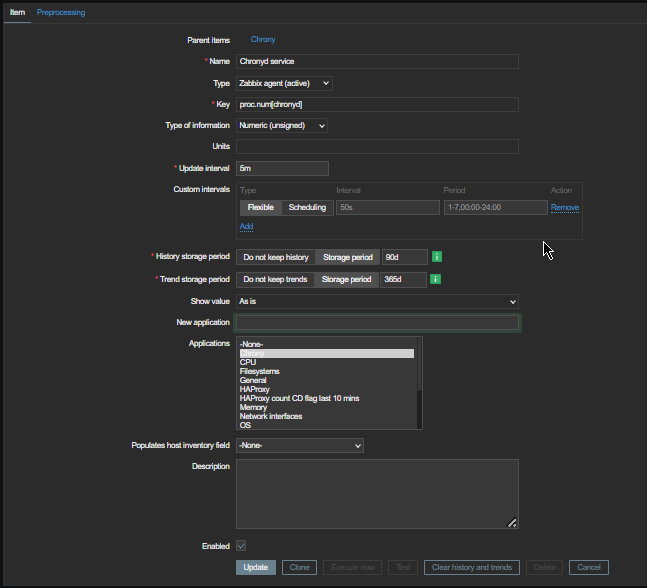

monitroing-chronyc_zabbix_item_report_to-zabbix

Second lets create the Item for the userparameter script, the chrony.json key should be the same as the key given in the userparameter script.
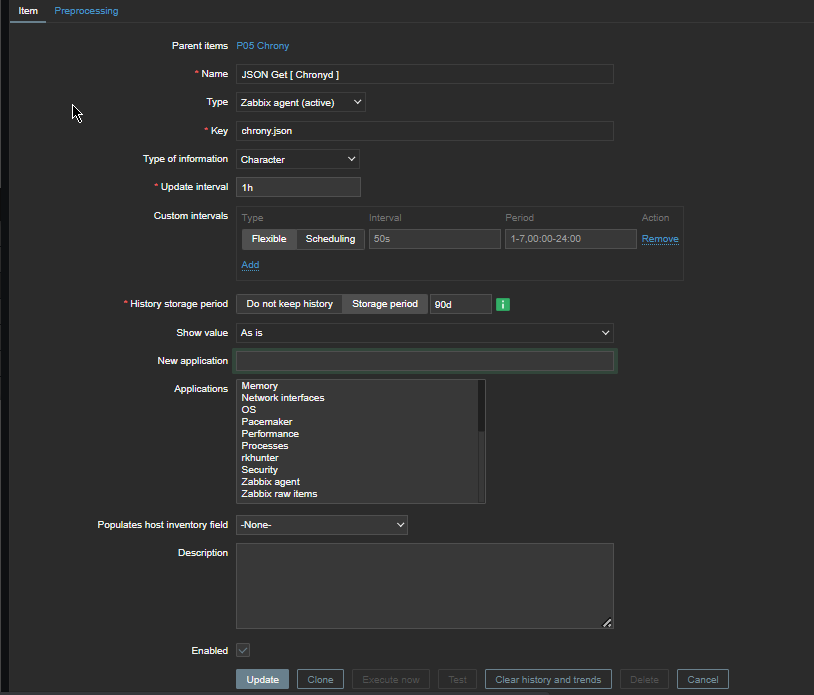
obtain-chronyc-statistic-variables-from-remote-chronyd-to-zabbix-windows

Create Chrony Zabbix Triggers 
 

Expression 

{server-host:proc.num[chronyd].last()}<1


will be triggered if the process of chronyd on the server is less than 1


chronyc_monitoring_process-is-not-running-screenshot

Next configure

{server-host:chrony[Leap status].iregexp[Not synchronised) ]=1


to trigger Alert Chronyd is Not synchronized if the Expression check occurs.
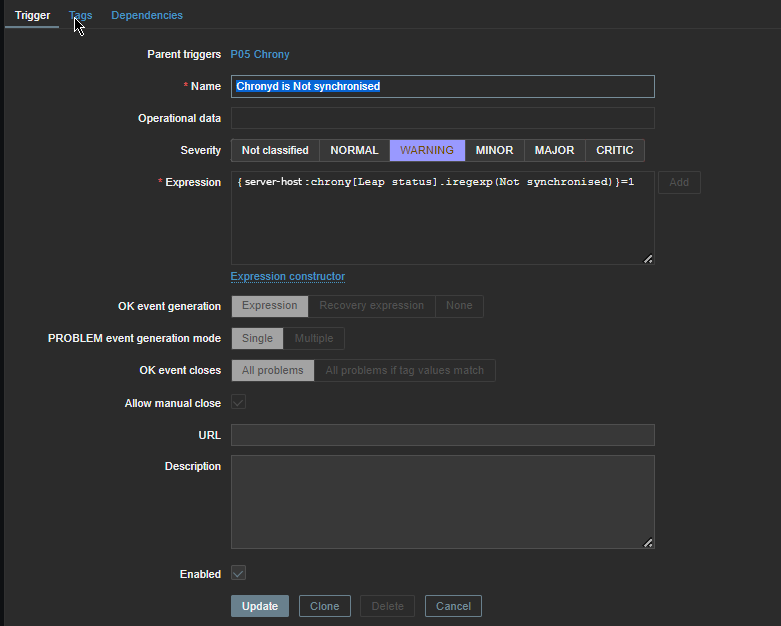
chronyd-is-not-synchronized-trigger-iregexp

Reload the zabbix-agent on the server
 

To make zabbix-agent locally installed on the machine read the userparameter into memory  (in my case this is zabbix-agent-4.0.28-1.el8.x86_64) installed on Redhat 8.3 (Ootpa), you have to restart it.

[root@server: ~]# systemctl restart zabbix-agent
[root@server: ~]# systemctl status zabbix-agent

● zabbix-agent.service – Zabbix Agent
   Loaded: loaded (/usr/lib/systemd/system/zabbix-agent.service; enabled; vendor preset: disabled)
   Active: active (running) since Thu 2021-12-16 16:41:02 CET; 3 months 0 days ago
 Main PID: 862165 (zabbix_agentd)
    Tasks: 6 (limit: 23662)
   Memory: 20.6M
   CGroup: /system.slice/zabbix-agent.service
           ├─862165 /usr/sbin/zabbix_agentd -c /etc/zabbix/zabbix_agentd.conf
           ├─862166 /usr/sbin/zabbix_agentd: collector [idle 1 sec]
           ├─862167 /usr/sbin/zabbix_agentd: listener #1 [waiting for connection]
           ├─862168 /usr/sbin/zabbix_agentd: listener #2 [waiting for connection]
           ├─862169 /usr/sbin/zabbix_agentd: listener #3 [waiting for connection]
           └─862170 /usr/sbin/zabbix_agentd: active checks #1 [idle 1 sec]

Warning: Journal has been rotated since unit was started. Log output is incomplete or unavailable.


In a short while you should be seeing in the chrony.json key History data fed by the userparameter Script.

In Zabbix Latest data, you will see plenty of interesting time synchronization data get reported such as Skew, Stratum, Root Delay, Update Interval, Frequency etc.

chronyd-zabbix-reported-time-synchronization-offset-leap-residual-freq-root-delay-screenshot

To have an email Alerting further, go and setup a new Zabbix Action based on the Trigger with your likings and you're done. 
The tracked machine will be in zabbix to make sure your OS clock is not afar from the time server. Repeat the same steps if you need to track chronyd is up running and synchronized on few machines, or if you have to make it for dozens setup a Zabbix template.

How to set up dsmc client Tivoli ( TSM ) release version and process check monitoring with Zabbix

Thursday, December 17th, 2020

zabbix-monitor-dsmc-client-monitor-ibm-tsm-with-zabbix-howto

As a part of Monitoring IBM Spectrum (the new name of IBM TSM) if you don't have the money to buy something like HP Open View monitoring or other kind of paid monitoring system but you use Zabbix open source solution to monitor your Linux server infrastructure and you use Zabbix as a main Services and Servers monitoring platform you will want to monitor at least whether the running Tivoli dsmc backup clients run fine on each of the server (e.g. the dsmc client) runs normally as a backup solution with its common /usr/bin/dsmc process service that connects towards remote IBM TSM server where the actual Data storage is kept.

It might be a kind of weird monitoring to setup to have the tsm version frequently reported to a Zabbix server on a first glimpse, but in reality this is quite useful especially if you want to have a better overview of your multiple servers environment IBM (Spectrum Protect) Storage manager backup solution actual release.
 
So the goal is to have reported dsmc interactive storage manager version as reported from
 

[root@server ~]# dsmc

IBM Spectrum Protect
Command Line Backup-Archive Client Interface
  Client Version 8, Release 1, Level 11.0
  Client date/time: 12/17/2020 15:59:32
(c) Copyright by IBM Corporation and other(s) 1990, 2020. All Rights Reserved.

Node Name: Sub-Hostname.FQDN.COM
Session established with server TSM_SERVER: AIX
  Server Version 8, Release 1, Level 10.000
  Server date/time: 12/17/2020 15:59:34  Last access: 12/17/2020 13:28:01


into zabbix and set reports in case if your sysadmins have changed version of a IBM TSM to a newer version. Thus for non sysadmins and less technical persons as Service Delivery Managers (SDMs) it is much easier to track changes of multiple servers Tivoli version to a newer one.

Enough talk let me next show you how to setup the required with a small UserParameter one liner bash shell script.
 

1. Create TSM Userparameter script


With Userparameter key and content as below:

[root@server ~]# vim /etc/zabbix/zabbix_agentd.d/userparameter_TSM.conf


UserParameter=dsmc.version,cat /var/tsm/sched.log | grep Clie | tail -n 1 | awk '{print $7 " " $8 " " $9 " " $10 " " $11 " " $12 " " $13}'


The script output of TivSM version will be reported as so:

[root@server ~]# cat /var/tsm/sched.log | grep Clie | tail -n 1 | awk '{print $7 " " $8 " " $9 " " $10 " " $11 " " $12 " " $13}'
Client Version 8, Release 1, Level 11.0


If you want to get only a major version report from dsmc:

UserParameter=dsmc.version,cat /var/tsm/sched.log | grep Clie | tail -n 1 | awk '{print $7 " " $8 " " $9}'


The output as a major version you will get is

[root@server ~]# cat /var/tsm/sched.log | grep Clie | tail -n 1 | awk '{print $7 " " $8 " " $9}'
Client Version 8,


2. Restart the zabbix agent to load userparam script

To load above configured Userparameter script we need to restart zabbix-agent client

[root@server ~]# systemctl restart zabbix-agent

[root@server ~]#  systemctl status zabbix-agent
● zabbix-agent.service – Zabbix Agent
   Loaded: loaded (/usr/lib/systemd/system/zabbix-agent.service; enabled; vendor preset: disabled)
   Active: active (running) since Wed 2020-07-22 16:17:17 CEST; 4 months 26 days ago
 Main PID: 7817 (zabbix_agentd)
   CGroup: /system.slice/zabbix-agent.service
           ├─7817 /usr/sbin/zabbix_agentd -c /etc/zabbix/zabbix_agentd.conf
           ├─7818 /usr/sbin/zabbix_agentd: collector [idle 1 sec]
           ├─7819 /usr/sbin/zabbix_agentd: listener #1 [waiting for connection]
           ├─7820 /usr/sbin/zabbix_agentd: listener #2 [waiting for connection]
           ├─7821 /usr/sbin/zabbix_agentd: listener #3 [waiting for connection]
           └─7822 /usr/sbin/zabbix_agentd: active checks #1 [idle 1 sec]


3. Create template for TSM Service check and TSM Version


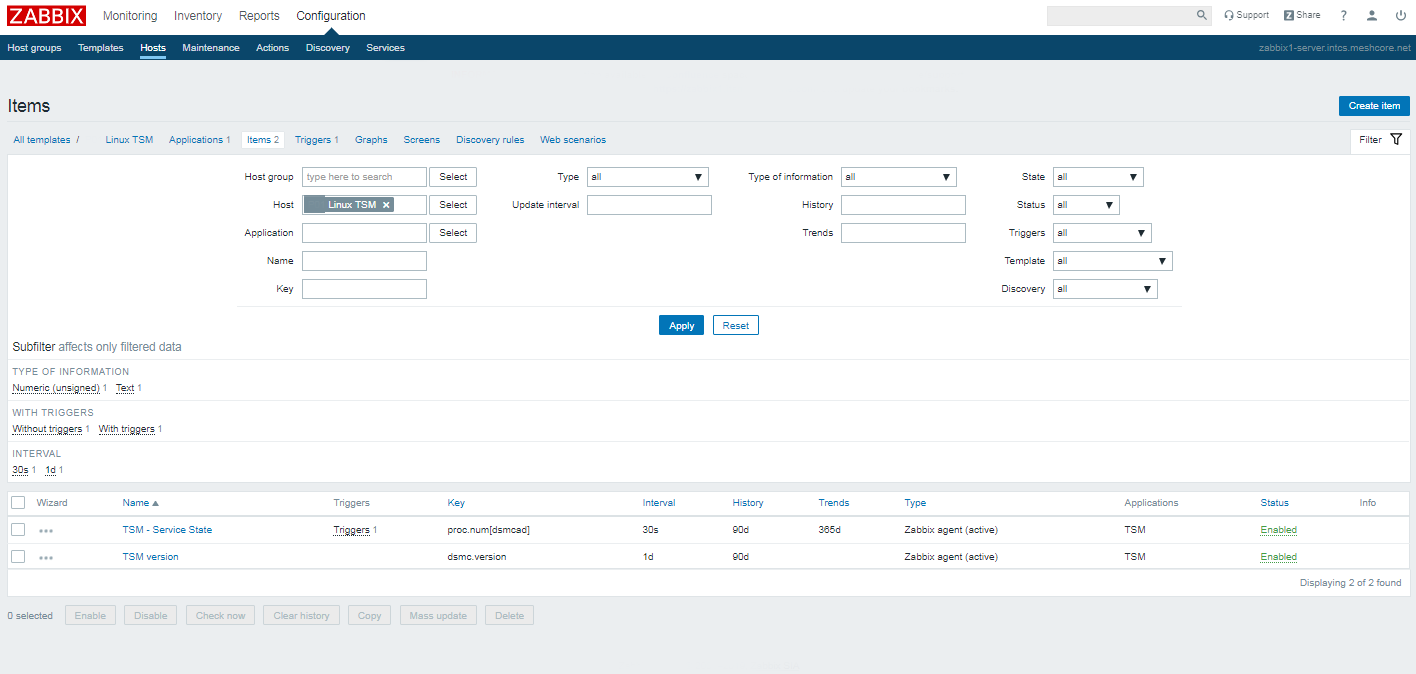
You will need to create 1 Trigger and 2 Items for the Service check and for TSM version reporting

tsm-service-version-screenshot-zabbix
As you see necessery names / keys to create are:

Name / Key: TSM – Service State proc.num{dsmcad}

Name / key: TSM version dmsc.version


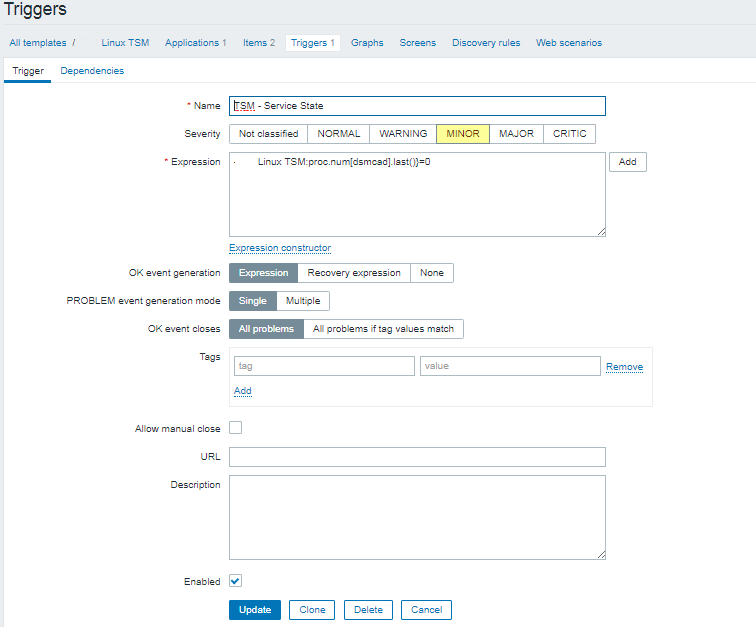
3.1 Create the trigger


Now lets create the trigger that will report the Service State

tsm-service-state-zabbix-screenshot


Linux TSM:proc.num[dsmcad].last()}=0


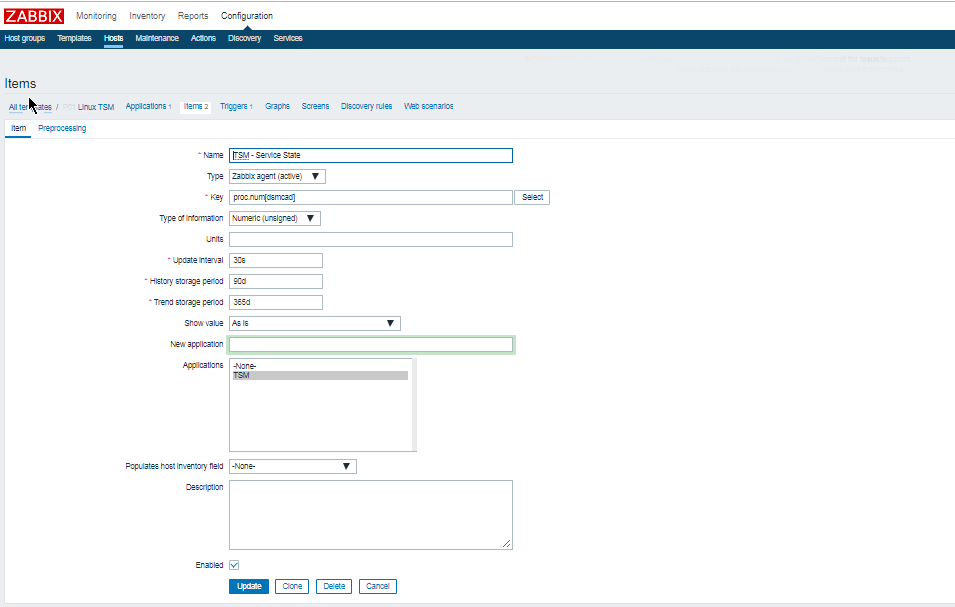
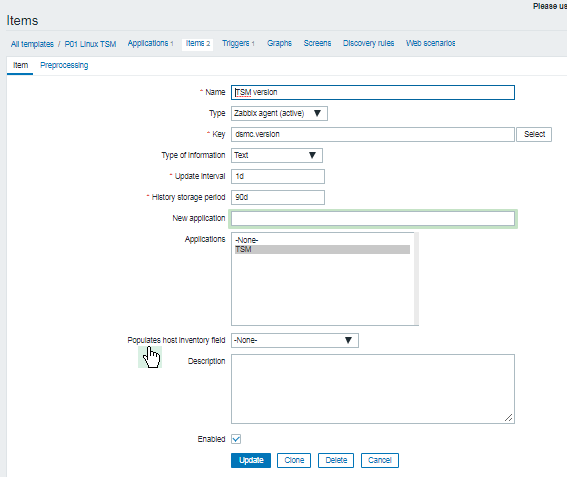
3.2 Create the Items


zabbix-dsmc-proc-num-item-setting-screenshot-linux


Name: dsmcad
Key: proc.num{dsmcad}


tsm-version-item-zabbix-screenshot
 

Update interval: 1d
History Storage period: 90d
Applications: TSM


3.3 Create Zabbix Action

As usual if you want to receive some Email Alerting or lets say send SMS in case of Trigger is matched create the necessery Action with
instructions on how to solve the problem if there is a Standard Operation Procedure ( SOP ) as often called in the corporate world for that.

That's all folks ! 🙂


How to set a crontab to execute commands on a seconds time interval on GNU / Linux and FreeBSD

Sunday, October 30th, 2011

crontab-execute-cron-jobs-every-second-on-linux-cron-logo
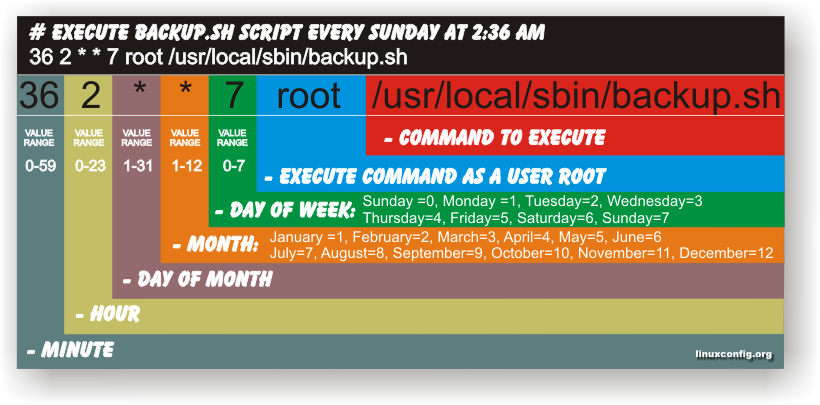
Have you ever been in need to execute some commands scheduled via a crontab, every let’s say 5 seconds?, naturally this is not possible with crontab, however adding a small shell script to loop and execute a command or commands every 5 seconds and setting it up to execute once in a minute through crontab makes this possible.
Here is an example shell script that does execute commands every 5 seconds:

#!/bin/bash
command1_to_exec='/bin/ls';
command2_to_exec='/bin/pwd';
for i in $(echo 1 2 3 4 5 6 7 8 9 10 11); do
sleep 5;
$command1_to_exec; $command2_to_exec;
done

This script will issue a sleep every 5 seconds and execute the two commands defined as $command1_to_exec and $command2_to_exec

Copy paste the script to a file or fetch exec_every_5_secs_cmds.sh from here

The script can easily be modified to execute on any seconds interval delay, the record to put on cron to use with this script should look something like:

# echo '* * * * * /path/to/exec_every_5_secs_cmds.sh' | crontab -

Where of course /path/to/exec_every_5_secs_cmds.sh needs to be modified to a proper script name and path location.

Another way to do the on a number of seconds program / command schedule without using cron at all is setting up an endless loop to run/refresh via /etc/inittab with a number of predefined commands inside. An example endless loop script to run via inittab would look something like:

while [ 1 ]; do
/bin/ls
sleep 5;
done

To run the above sample never ending script using inittab, one needs to add to the end of inittab, some line like:

mine:234:respawn:/path/to/script_name.sh

A quick way to add the line from consone would be with echo:

echo 'mine:234:respawn:/path/to/script' >> /etc/inittab

Of course the proper paths, should be put in:

Then to load up the newly added inittab line, inittab needs to be reloaded with cmd:

# init q

I've also red, some other methods suggested to run programs on a periodic seconds basis using just cron, what I found in stackoverflow.com's  as a thread proposed as a solution is:

* * * * * /foo/bar/your_script
* * * * * sleep 15; /foo/bar/your_script
* * * * * sleep 30; /foo/bar/your_script
* * * * * sleep 45; /foo/bar/your_script

One guy, even suggested a shorted way with cron:

0/15 * * * * * /path/to/my/script

Possible way to increase Linux TCP/IP port thoroughput via sysctl kernel variable

Thursday, August 25th, 2011

Sysctl is a great way to optimize Linux. sysctl has a dozens of values which could drastically improve server networking and overall performance.

One of the many heplful variables to optimize the way the Linuz kernel works on busy servers is net.ipv4.ip_local_port_range .

The default sysctl setting for net.ipv4.ip_local_port_range on Debian, Ubuntu Fedora, RHEL, CentOS is:

net.ipv4.ip_local_port_range = 32768 65536

This means that the kernel and the corresponding server running services instructing the Linuz kernel open new port sockets can only open local ports in the range of 32768 – 65536 .
On a regular Desktop GNU/Linux machine or a not high iron server this settins is perfectly fine, however on a high scale servers the local port range in the interval of 32768-65536 might be insufficient at times, especially if there are programs which require binding of many local ports.

Therefore on a high load servers, generally it’s a good to raise the port range to be assigned by kernel to 8912 – 65536 , to do so the setting has to be changed like shown below:

linux:~# sysctl -w net.ipv4.ip_local_port_range = 8192 65536
...

If changing this setting on the server doesn’t show any negative impact on performance in few hours time or a day or even better decreases the server average load, it’s a good idea that it be added to sysctl.conf to load up the setting on next kernel boot.

linux:~# echo 'net.ipv4.ip_local_port_range' >> /etc/sysctl.conf

Enjoy 😉