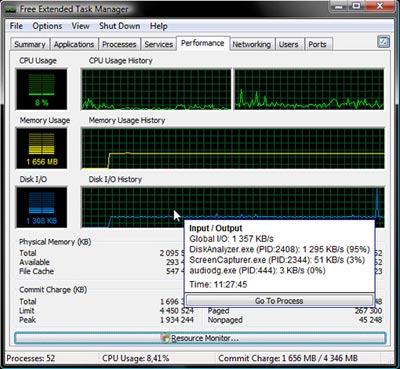
I've earlier wrote an article How to find which processes are causing hard disk i/o overhead on Linux there I explained very rawly few tools which can be used to benchmark hard disk read / write operations. My prior article accent was on iotop and dstat and it just mentioned of iostat. Therefore I've wrote this short article in attempt to explain a bit more thoroughfully on how iostat can be used to track problems with excessive server I/O read/writes.
Here is the command man page description;
iostat – Report Central Processing Unit (CPU) statistics and input/output statistics for devices, partitions and network filesystems
I will further proceed with few words on how iostat can be installed on various Linux distros, then point at few most common scenarious of use and a short explanation on the meaning of each of the command outputs.
1. Installing iostat on Linux
iostat is a swiss army knife of finding a server hard disk bottlenecks. Though it is a must have tool in the admin outfut, most of Linux distributions will not have iostat installed by default.
To have it on your server, you will need to install sysstat package:
a) On Debian / Ubuntu and other Debian GNU / Linux derivatives to install sysstat:
debian:~# apt-get --yes install sysstat
b) On Fedora, CentOS, RHEL etc. install is with yum:
[root@centos ~]# yum -y install sysstat
c) On Slackware Linux sysstat package which contains iostat is installed by default.
d) In FreeBSD, there is no need for installation of any external package as iostat is part of the BSD world (bundle commands).
I should mention bsd iostat and Linux's iostat commands are not the same and hence there use to track down hard disk bottlenecks differs a bit, however the general logic of use is very similar as with most tools in BSD and Linux.
2. Checking a server hard disk for i/o disk bottlenecks on G* / Linux
Once having the sysstat installed on G* / Linux systems, the iostat command will be added in /usr/bin/iostat
a) To check what is the hard disk read writes per second (in megabytes) use:
 debian:~# /usr/bin/iostat -m

Linux 2.6.32-5-amd64 (debian) 03/27/2012 _x86_64_ (8 CPU)

avg-cpu: %user %nice %system %iowait %steal %idle

15.34 0.36 2.76 2.66 0.00 78.88

Device: tps MB_read/s MB_wrtn/s MB_read MB_wrtn

sda 63.89 0.48 8.20 6730223 115541235

sdb 64.12 0.44 8.23 6244683 116039483

md0 2118.70 0.22 8.19 3041643 115528074
In the above output the server, where I issue the command is using sda and sdb configured in software RAID 1 array visible in the output as (md0)
The output of iostat should already be easily to read, for anyone who didn't used the tool here is a few lines explanation of the columns:
The %user 15.34 meaning is that 15.34 out of 100% possible i/o load is generad by system level read/write operations.
%nice – >Show the percentage of CPU utilization that occurred while executing at the user level with nice priority.
%iowait – just like the top command idle it shows the idle time when the system didn't have an outstanding disk I/O requests.
%steal – show percentage in time spent in time wait of CPU or virtual CPUs to service another virtual processor (high numbers of disk is sure sign for i/o problem).
%idle – almost the same as meaning to %iowait
tps – HDD transactions per second
MB_read/s (column) – shows the actual Disk reads in Mbytes at the time of issuing iostat
MB_wrtn/s – displays the writes p/s at the time of iostat invocation
MB_read – shows the hard disk read operations in megabytes, since the server boot 'till moment of invocation of iostat
MB_wrtn – gives the number of Megabytes written on HDD since the last server boot filesystem mount
The reason why the Read / Write values for sda and sdb are similar in this example output is because my disks are configured in software RAID1 (mirror)
The above iostat output reveals in my specific case the server is experiencing mostly Disk writes (observable in the high MB_wrtn/s 8.19 md0 in the above sample output).
It also reveals, the I/O reads experienced on that server hard disk are mostly generated as a system (user level load) – see (%user 15.34 and md0 2118.70).
For all those not familiar with system also called user / level load, this is all kind of load which is generated by running programs on the server – (any kind of load not generated by the Linux kernel or loaded kernel modules).
b) To periodically keep an eye on HDD i/o operations with iostat, there are two ways:
– Use watch in conjunction with iostat;
 [root@centos ~]# watch "/usr/bin/iostat -m"

Every 2.0s: iostat -m Tue Mar 27 11:00:30 2012

Linux 2.6.32-5-amd64 (centos) 03/27/2012 _x86_64_ (8 CPU)

avg-cpu: %user %nice %system %iowait %steal %idle

15.34 0.36 2.76 2.66 0.00 78.88

Device: tps MB_read/s MB_wrtn/s MB_read MB_wrtn

sda 63.89 0.48 8.20 6730255 115574152

sdb 64.12 0.44 8.23 6244718 116072400

md0 2118.94 0.22 8.20 3041710 115560990

Device: tps MB_read/s MB_wrtn/s MB_read MB_wrtn

sda 55.00 0.01 25.75 0 51

sdb 52.50 0.00 24.75 0 49

md0 34661.00 0.01 135.38 0 270
Even though watch use and -d might appear like identical, they're not watch does refresh the screen, executing instruction similar to the clear command which clears screen on every 2 seconds, so the output looks like the top command refresh, while passing the -d 2 will output the iostat command output on every 2 secs in a row so all the data is visualized on the screen. Hence -d 2 in cases, where more thorough debug is necessery is better. However for a quick routine view watch + iostat is great too.
c) Outputting extra information for HDD input/output operations;
 root@debian:~# iostat -x

Linux 2.6.32-5-amd64 (debian) 03/27/2012 _x86_64_ (8 CPU)

avg-cpu: %user %nice %system %iowait %steal %idle

15.34 0.36 2.76 2.66 0.00 78.88

Device: rrqm/s wrqm/s r/s w/s rsec/s wsec/s avgrq-sz avgqu-sz await svctm %util

sda 4.22 2047.33 12.01 51.88 977.44 16785.96 278.03 0.28 4.35 3.87 24.72

sdb 3.80 2047.61 11.97 52.15 906.93 16858.32 277.05 0.03 5.25 3.87 24.84

md0 0.00 0.00 20.72 2098.28 441.75 16784.05 8.13 0.00 0.00 0.00 0.00
This command will output extended useful Hard Disk info like;
r/s – number of read requests issued per second
w/s – number of write requests issued per second
rsec/s – numbers of sector reads per second
b>wsec/s – number of sectors wrote per second
etc. etc.
Most of ppl will never need to use this, but it is good to know it exists.
3. Tracking read / write (i/o) hard disk bottlenecks on FreeBSD
BSD's iostat is a bit different in terms of output and arguments.
a) Here is most basic use:
 freebsd# /usr/sbin/iostat

tty ad0 cpu

tin tout KB/t tps MB/s us ni sy in id

1 561 45.18 44 1.95 14 0 5 0 82
b) Periodic watch of hdd i/o operations;
 freebsd# iostat -c 10

tty ad0 cpu

tin tout KB/t tps MB/s us ni sy in id

1 562 45.19 44 1.95 14 0 5 0 82

0 307 51.96 113 5.73 44 0 24 0 32

0 234 58.12 98 5.56 16 0 7 0 77

0 43 0.00 0 0.00 1 0 0 0 99

0 485 0.00 0 0.00 2 0 0 0 98

0 43 0.00 0 0.00 0 0 1 0 99

0 43 0.00 0 0.00 0 0 0 0 100

...
As you see in the output, there is information like in the columns tty, tin, tout which is a bit hard to comprehend.
Thanksfully the tool has an option to print out only more essential i/o information:
 freebsd# iostat -d -c 10

ad0

KB/t tps MB/s

45.19 44 1.95

58.12 97 5.52

54.81 108 5.78

0.00 0 0.00

0.00 0 0.00

0.00 0 0.00

20.48 25 0.50
The output info is quite self-explanatory.
Displaying a number of iostat values for hard disk reads can be also achieved by omitting -c option with:
 freebsd# iostat -d 1 10

...
Tracking a specific hard disk partiotion with iostat is done with:
 freebsd# iostat -n /dev/ad0s1a

tty cpu

tin tout us ni sy in id

1 577 14 0 5 0 81
c) Getting Hard disk read/write information with gstat
gstat is a FreeBSD tool to print statistics for GEOM disks. Its default behaviour is to refresh the screen in a similar fashion like top command, so its great for people who would like to periodically check all attached system hard disk and storage devices:
 freebsd# gstat

dT: 1.002s w: 1.000s

L(q) ops/s r/s kBps ms/r w/s kBps ms/w %busy Name

0 10 0 0 0.0 10 260 2.6 15.6| ad0

0 10 0 0 0.0 10 260 2.6 11.4| ad0s1

0 10 0 0 0.0 10 260 2.8 12.5| ad0s1a

0 0 0 0 0.0 0 0 0.0 20.0| ad0s1b

0 0 0 0 0.0 0 0 0.0 0.0| ad0s1c

0 0 0 0 0.0 0 0 0.0 0.0| ad0s1d

0 0 0 0 0.0 0 0 0.0 0.0| ad0s1e

0 0 0 0 0.0 0 0 0.0 0.0| acd0
It even has colors if your tty supports colors 🙂
Another useful tool in debugging the culprit of excessive hdd I/O operations is procstat command:
Here is a sample procstat run to track (httpd) one of my processes imposing i/o hdd load:
 freebsd# procstat -f 50404

PID COMM FD T V FLAGS REF OFFSET PRO NAME

50404 httpd cwd v d -------- - - - /

50404 httpd root v d -------- - - - /

50404 httpd 0 v c r------- 56 0 - -

50404 httpd 1 v c -w------ 56 0 - -

50404 httpd 2 v r -wa----- 56 75581 - /var/log/httpd-error.log

50404 httpd 3 s - rw------ 105 0 TCP ::.80 ::.0

50404 httpd 4 p - rw---n-- 56 0 - -

50404 httpd 5 p - rw------ 56 0 - -

50404 httpd 6 v r -wa----- 56 25161132 - /var/log/httpd-access.log

50404 httpd 7 v r rw------ 56 0 - /tmp/apr8QUOUW

50404 httpd 8 v r -w------ 56 0 - /var/run/accept.lock.49588

50404 httpd 9 v r -w------ 1 0 - /var/run/accept.lock.49588

50404 httpd 10 v r -w------ 1 0 - /tmp/apr8QUOUW

50404 httpd 11 ? - -------- 2 0 - -
Btw fstat is sometimes helpful in identifying the number of open files and trying to estimate which ones are putting the hdd load.
Hope this info helps someone. If you know better ways to track hdd excessive loads on Linux / BSD pls share 'em pls.