Posts Tagged ‘level’

What is IPMI (IPKVM), ILO and IDRAC – Remote management interfaces to server / PC on BIOS level

Friday, May 30th, 2014

IPMI-Block-Diagram-ILO-IPKVM-how-it-works
IPMI
Intelligent Platform Management Interface is a standardized computer interface also accessible remotely via Java applet allowing remote management and monitoring access to PC BIOS. IPMI is a way to manage a computer that may be powered off or otherwise unresponsive by using a network connection to the hardware rather than to an operating system or a keyboard physical / screen login shell. The IPMI server standard was introduced by Intel and nowadays supported by more than 200 computer vendors i.e. – Super Micro, Hewlett Packard, Cisco, Dell etc.

Intelligent Platform Management Interface is an open, industry-standard interface that was designed for the management of server systems over network. IPMI interfaces by various vendors have also Virtual Media support (i.e. – Operating System  ISO files could be mounted remotely to a Virtual CD / DVD rom and you can approach installing a bare-metal server without physical presense to it). Just like Power Off / Restart, BIOS Entrance and Virtual Media access is done directly through a web-browser interface over the network or the internet.

HP_IPMI_ILO-screenshot-remote-management-server-console

ILO – stands for Integrated Lights-Out and is  HP Proliant servers remote console to PC / server physical screen. ILO is server integrated chip on HP servers and doesn't need further installations. It gives you a web console using Java showing you server screen just like there is a Monitor connected to the server it is precious for remote system administration purposes as often when there is no SSH  or Remote Desktop to server you can see directly whether the server has completed hanged and try to recover or see a failing hardware notification on the screen to a server with a partially accessible services. Using ILO console access to an HP server one can have a BIOS access remotely to machines already colocated in data canters. In other words ILO is HP's variation of IPMI remote interface also known under business buzz word IPKVM.

DRAC-Dell-Remote-Acccess-console-IPMI-tools-remote-management-bios-interface

DRAC (iDRAC)- Dell's Remote Access Controller is interface card from Dell Inc. offering remote access (out-of-band) management facilities – i.e. DRAC is Dell's variant of HP's ILO – an implementation of Intel's IPMI out-of-band standard. DRAC is also giving you remote way to access no other means accessible server on a software level. Interesting and nice things is Dell provides their DRAC source code, so if you're a developer you can learn how DRAC technology works on a lower level.

ILO, iDRAC (Dell's new generation DRAC for Blade servers) and ILO's remote management interfaces's (IPMI tools) most valuable features is it allows remote system Power On / Shutdown and Remote Restart while monitoring the server screen (hardware output) messages and allowing you see critical hardware issue messages on pre-OS boot time, failure with memory, hard disks etc. and remote interface to do BIOS tuning.

How to harden Linux Security and imprpove network efficiency on Kernel sysctl Level to Stop SYN flood

Friday, July 8th, 2011

Power up Linux and protect against DDoS with sysctl var optimization

Some long time ago I’ve written an article Optimizing Linux tcp/ip networking

In the article I’ve examined a number of Linux kernel sysctl variables, which significantly improve the way TCP/IP networking is handled by a non router Linux based servers.

As the time progresses I’ve been continuing to read materials on blogs and internet sites on various tips and anti Denial of Service rules which one could apply on newly installed hosting (Apache/MySql/Qmail/Proxy) server to improve webserver responce times and tighten the overall security level.

In my quest for sysctl 😉 I found a few more handy sysctl variables apart from the old ones I incorporate on every Linux server I adminstrate.
The sysctl variables improves the overall network handling efficiency and protects about common SYN/ACK Denial of service attacks.

Here are the extra sysctl variables I started incorporating just recently:

############ IPv4 Sysctl Settings ################
#Enable ExecShield protection (randomize virtual assigned space to protect against many exploits)
kernel.randomize_va_space = 1
#Increase the number of PIDs processes could assign this is very needed especially on more powerful servers
kernel.pid_max = 65536
# Prevent against the common 'syn flood attack'
net.ipv4.tcp_syncookies = 1
# Controls the use of TCP syncookies two is generally a better idea, though you might experiment
#net.ipv4.tcp_syncookies = 1
net.ipv4.tcp_synack_retries = 2
##################################################
#
############## IPv6 Sysctl Settings ################
# Number of Router Solicitations to send until assuming no routers are present.
net.ipv6.conf.default.router_solicitations = 0
# Accept Router Preference in RA? Again not necessery if the server is not a router
net.ipv6.conf.default.accept_ra_rtr_pref = 0
# Learn Prefix Information in Router Advertisement (Unnecessery) for non-routers
net.ipv6.conf.default.accept_ra_pinfo = 0
# disable accept of hop limit settings from other routers (could be used for DoS)
net.ipv6.conf.default.accept_ra_defrtr = 0
# disable ipv6 global unicasts server assignments
net.ipv6.conf.default.autoconf = 0
# neighbor solicitations to send out per address (better if disabled)
net.ipv6.conf.default.dad_transmits = 0
# disable assigning more than 1 address per network interface
net.ipv6.conf.default.max_addresses = 1
#####################################################


To use this settings paste the above sysctl variables in /etc/sysctl.conf and ask sysctl command to read and apply the newly added conf settings:

server:~# sysctl -p
...

Hopefully you should not get errors while applying the sysctl settings, if you get some errors, it’s possible some of the variable is differently named (depending on the Linux kernel version) or the Linux distribution on which sysctl’s are implemented.

For some convenience I’ve created unified sysctl variables /etc/sysct.conf containing the newly variables I started implementing to servers with the ones I already exlpained in my previous post Optimizing Linux TCP/IP Networking

Here is the optimized / hardened sysctl.conf file for download

I use this exact sysctl.conf these days on both Linux hosting / VPS / Mail servers etc. as well as on my personal notebook 😉

Here is also the the complete content of above’s sysctl.conf file, just in case if somebody wants to directly copy/paste it in his /etc/sysctl.conf

# Sysctl kernel variables to improve network performance and protect against common Denial of Service attacks
# It's possible that not all of the variables are working on all Linux distributions, test to make sure
# Some of the variables might need a slight modification to match server hardware, however in most cases it should be fine
# variables list compiled by hip0
### https://www.pc-freak.net
#### date 08.07.2011
############ IPv4 Sysctl Kernel Settings ################
net.ipv4.ip_forward = 0
# ( Turn off IP Forwarding )
net.ipv4.conf.default.rp_filter = 1
# ( Control Source route verification )
net.ipv4.conf.default.accept_redirects = 0
# ( Disable ICMP redirects )
net.ipv4.conf.all.accept_redirects = 0
# ( same as above )
net.ipv4.conf.default.accept_source_route = 0
# ( Disable IP source routing )
net.ipv4.conf.all.accept_source_route = 0
# ( - || - )net.ipv4.tcp_fin_timeout = 40
# ( Decrease FIN timeout ) - Useful on busy/high load server
net.ipv4.tcp_keepalive_time = 4000
# ( keepalive tcp timeout )
net.core.rmem_default = 786426
# Receive memory stack size ( a good idea to increase it if your server receives big files )
##net.ipv4.tcp_rmem = "4096 87380 4194304"
net.core.wmem_default = 8388608
#( Reserved Memory per connection )
net.core.wmem_max = 8388608
net.core.optmem_max = 40960
# ( maximum amount of option memory buffers )
# tcp reordering, increase max buckets, increase the amount of backlost
net.ipv4.tcp_max_tw_buckets = 360000
net.ipv4.tcp_reordering = 5
##net.core.hot_list_length = 256
net.core.netdev_max_backlog = 1024
#Enable ExecShield protection (randomize virtual assigned space to protect against many exploits)
kernel.randomize_va_space = 1
#Increase the number of PIDs processes could assign this is very needed especially on more powerful servers
kernel.pid_max = 65536
# Prevent against the common 'syn flood attack'net.ipv4.tcp_syncookies = 1
# Controls the use of TCP syncookies two is generally a better idea, though you might experiment
#net.ipv4.tcp_syncookies = 1
net.ipv4.tcp_synack_retries = 2
###################################################
############## IPv6 Sysctl Settings ################
# Number of Router Solicitations to send until assuming no routers are present.
net.ipv6.conf.default.router_solicitations = 0
# Accept Router Preference in RA? Again not necessery if the server is not a router
net.ipv6.conf.default.accept_ra_rtr_pref = 0
# Learn Prefix Information in Router Advertisement (Unnecessery) for non-routersnet.
ipv6.conf.default.accept_ra_pinfo = 0
# disable accept of hop limit settings from other routers (could be used for DoS)
net.ipv6.conf.default.accept_ra_defrtr = 0
# disable ipv6 global unicasts server assignmentsnet.
ipv6.conf.default.autoconf = 0
# neighbor solicitations to send out per address (better if disabled)
net.ipv6.conf.default.dad_transmits = 0
# disable assigning more than 1 address per network interfacenet.
ipv6.conf.default.max_addresses = 1
#####################################################
# Reboot if kernel panic
kernel.panic = 20

These sysctl settings will tweaken the Linux kernel default network settings performance and you will notice the improvements in website responsiveness immediately in some cases implementing this kernel level goodies will make the server perform better and the system load might decrease even 😉

This optimizations on a kernel level are not only handy for servers, their implementation on Linux Desktop should also have a positive influence on the way the network behaves and could improve significantly the responce times of opening pages in Firefox/Opera/Epiphany Torrent downloads etc.

Hope this kernel tweakenings are helpful to someone.
Cheers 😉

How to count how many files are in a directory with find on Linux

Tuesday, February 21st, 2012

how to count how many directories are on your linux server

Did you ever needed to count, how many files in a directory are there?
Having the concrete number of files in a directory is not a seldom task but still very useful especially for scripts or simply for the sake of learning

The quickest and maybe the easiest way to count all files in a directory in Linux is with a combination of find and wc commands:

Here is how;

linux:~# cd ascii
linux:~/ascii# find . -type f -iname '*' -print |wc -l
407

This will find and list all matched files in any directory and subdirectories, print them out and count them with wc command.
The -type f argument instructs find to look only for files.

Other helpful variance of finding and listing all files in a directory and subdirectories is to list and count all the files with a certain file extension under a directory. For example, lets list all text files (.txt) contained in a directory and all level sub-directories:

linux:~/ascii# find . -type f -iname '*.txt' -print |wc -l
401

If you need to check the number of files in a directory for multiple directories on a server and you're aiming at doing it efficienly, issung above find .. | wc code will definitely be not a good choice. If used it will generate heavy load for the system and along with that will complete the execution in ages if issued on a large number of files containing dirs.

Thanksfully if efficiency is targetted, there is a command written in C called tree which is more efficient than find.
To count the number of files in dir but using tree :

linux:~# cd ascii
linux:/ascii# tree | tail -n 1
32 directories, 407 files

By default tree prints info for both the number of found files and directories.
To print out only the files matched, awk comes handy, e.g.:

linux:/ascii# tree |tail -n 1| awk '{ print $3 }'407

To list only the number of files in a directory without its existing sub-directories ls + wc use is also possible:

linux:~/ascii# ls -l | grep ^- | wc -l68

This result the above command would produce is +1 more than the real number of files, as it counts the directory ".." as one file (in UNIX / LINUX everything is file).

A short one liner script that can calculate all files correctly by substracting 1 is and hence present correct result on number of files is like so:

linux:~/ascii# var=$(ls -l | grep ^- | wc -l); var=$(($var - 1)); echo $var

ls can be used to calculate the number of 1-st level sub-directories under certain directory for instance:

linux:~/ascii# ls -l |grep ^d|wc -l
25

You see the ascii directory has 25 subdirectories in its 1st level.

To check symlinks under a directory with ls the command would be:

linux:~/ascii# ls -l | grep ^l | wc -l
0

Note above 3 ls | grep … examples, will not work properly if the directory contains files with SUID or some special properties set.
Hence to get the same 3 results for active files, directories and symbolic links, a one liner similar to the one below can be used instead:

linux:~/ascii# for t in files links directories; do echo `find . -type ${t:0:1} | wc -l` $t; done 2> /dev/null
407 files
0 links
33 directories

This will show statistics about all files, links and directories for all directory sub-levels.
Just in case if there is need to only count files, links and directories without directory recursion enabled, use:

linux:~/ascii# for t in files links directories; do echo `find . -maxdepth 1 -type ${t:0:1} | wc -l` $t; done 2> /dev/null
68 files
0 links
26 directories

Anyways the above bash loop will be slow, for directories containing thousands of files. For better performance the equivallent of above bash loop rewritten in perl would be:

linux:~/ascii# ls -l |perl -e 'while(<>){$h{substr($_,0,1)}+=1;} END {foreach(keys %h) {print "$_ $h{$_}\n";}}'
- 68
d 25
t 1
linux:~/ascii#
In any case the most preferrable and efficient way to count files en directories is by using tree command.
In my view using always tree command instead of code "hacks" is smart idea.

In Slackware tree command is part of the base install, on Debian and CentOS Linux, tree cmd is not part of the base system and requires install via apt / yum e.g.:

debian:~# apt-get --yes install tree
...

[root@centos:~ ]# yum --yes install tree

Happy counting 😉

Tracking I/O hard disk server bottlenecks with iostat on GNU / Linux and FreeBSD

Tuesday, March 27th, 2012

Hard disk overhead tracking on Linux and FreeBSD with iostat

I've earlier wrote an article How to find which processes are causing hard disk i/o overhead on Linux there I explained very rawly few tools which can be used to benchmark hard disk read / write operations. My prior article accent was on iotop and dstat and it just mentioned of iostat. Therefore I've wrote this short article in attempt to explain a bit more thoroughfully on how iostat can be used to track problems with excessive server I/O read/writes.

Here is the command man page description;
iostatReport Central Processing Unit (CPU) statistics and input/output statistics for devices, partitions and network filesystems

I will further proceed with few words on how iostat can be installed on various Linux distros, then point at few most common scenarious of use and a short explanation on the meaning of each of the command outputs.

1. Installing iostat on Linux

iostat is a swiss army knife of finding a server hard disk bottlenecks. Though it is a must have tool in the admin outfut, most of Linux distributions will not have iostat installed by default.
To have it on your server, you will need to install sysstat package:

a) On Debian / Ubuntu and other Debian GNU / Linux derivatives to install sysstat:

debian:~# apt-get --yes install sysstat

b) On Fedora, CentOS, RHEL etc. install is with yum:

[root@centos ~]# yum -y install sysstat

c) On Slackware Linux sysstat package which contains iostat is installed by default. 

d) In FreeBSD, there is no need for installation of any external package as iostat is part of the BSD world (bundle commands).
I should mention bsd iostat and Linux's iostat commands are not the same and hence there use to track down hard disk bottlenecks differs a bit, however the general logic of use is very similar as with most tools in BSD and Linux.

2. Checking a server hard disk for i/o disk bottlenecks on G* / Linux

Once having the sysstat installed on G* / Linux systems, the iostat command will be added in /usr/bin/iostat
a) To check what is the hard disk read writes per second (in megabytes) use:

debian:~# /usr/bin/iostat -m
Linux 2.6.32-5-amd64 (debian) 03/27/2012 _x86_64_ (8 CPU)
avg-cpu: %user %nice %system %iowait %steal %idle
15.34 0.36 2.76 2.66 0.00 78.88
Device: tps MB_read/s MB_wrtn/s MB_read MB_wrtn
sda 63.89 0.48 8.20 6730223 115541235
sdb 64.12 0.44 8.23 6244683 116039483
md0 2118.70 0.22 8.19 3041643 115528074

In the above output the server, where I issue the command is using sda and sdb configured in software RAID 1 array visible in the output as (md0)

The output of iostat should already be easily to read, for anyone who didn't used the tool here is a few lines explanation of the columns:

The %user 15.34 meaning is that 15.34 out of 100% possible i/o load is generad by system level read/write operations.
%nice – >Show the percentage of CPU utilization that occurred while executing at the user level with nice priority.
%iowait – just like the top command idle it shows the idle time when the system didn't have an outstanding disk I/O requests.
%steal – show percentage in time spent in time wait of CPU or virtual CPUs to service another virtual processor (high numbers of disk is sure sign for i/o problem).
%idle – almost the same as meaning to %iowait
tps – HDD transactions per second
MB_read/s (column) – shows the actual Disk reads in Mbytes at the time of issuing iostat
MB_wrtn/s – displays the writes p/s at the time of iostat invocation
MB_read – shows the hard disk read operations in megabytes, since the server boot 'till moment of invocation of iostat
MB_wrtn – gives the number of Megabytes written on HDD since the last server boot filesystem mount

The reason why the Read / Write values for sda and sdb are similar in this example output is because my disks are configured in software RAID1 (mirror)

The above iostat output reveals in my specific case the server is experiencing mostly Disk writes (observable in the high MB_wrtn/s 8.19 md0 in the above sample output).

It also reveals, the I/O reads experienced on that server hard disk are mostly generated as a system (user level load) – see (%user 15.34 and md0 2118.70).

For all those not familiar with system also called user / level load, this is all kind of load which is generated by running programs on the server – (any kind of load not generated by the Linux kernel or loaded kernel modules).

b) To periodically keep an eye on HDD i/o operations with iostat, there are two ways:

– Use watch in conjunction with iostat;

[root@centos ~]# watch "/usr/bin/iostat -m"
Every 2.0s: iostat -m Tue Mar 27 11:00:30 2012
Linux 2.6.32-5-amd64 (centos) 03/27/2012 _x86_64_ (8 CPU)
avg-cpu: %user %nice %system %iowait %steal %idle
15.34 0.36 2.76 2.66 0.00 78.88
Device: tps MB_read/s MB_wrtn/s MB_read MB_wrtn
sda 63.89 0.48 8.20 6730255 115574152
sdb 64.12 0.44 8.23 6244718 116072400
md0 2118.94 0.22 8.20 3041710 115560990
Device: tps MB_read/s MB_wrtn/s MB_read MB_wrtn
sda 55.00 0.01 25.75 0 51
sdb 52.50 0.00 24.75 0 49
md0 34661.00 0.01 135.38 0 270

Even though watch use and -d might appear like identical, they're not watch does refresh the screen, executing instruction similar to the clear command which clears screen on every 2 seconds, so the output looks like the top command refresh, while passing the -d 2 will output the iostat command output on every 2 secs in a row so all the data is visualized on the screen. Hence -d 2 in cases, where more thorough debug is necessery is better. However for a quick routine view watch + iostat is great too.

c) Outputting extra information for HDD input/output operations;

root@debian:~# iostat -x
Linux 2.6.32-5-amd64 (debian) 03/27/2012 _x86_64_ (8 CPU)
avg-cpu: %user %nice %system %iowait %steal %idle
15.34 0.36 2.76 2.66 0.00 78.88
Device: rrqm/s wrqm/s r/s w/s rsec/s wsec/s avgrq-sz avgqu-sz await svctm %util
sda 4.22 2047.33 12.01 51.88 977.44 16785.96 278.03 0.28 4.35 3.87 24.72
sdb 3.80 2047.61 11.97 52.15 906.93 16858.32 277.05 0.03 5.25 3.87 24.84
md0 0.00 0.00 20.72 2098.28 441.75 16784.05 8.13 0.00 0.00 0.00 0.00

This command will output extended useful Hard Disk info like;
r/s – number of read requests issued per second
w/s – number of write requests issued per second
rsec/s – numbers of sector reads per second
b>wsec/s – number of sectors wrote per second
etc. etc.

Most of ppl will never need to use this, but it is good to know it exists.

3. Tracking read / write (i/o) hard disk bottlenecks on FreeBSD

BSD's iostat is a bit different in terms of output and arguments.

a) Here is most basic use:

freebsd# /usr/sbin/iostat
tty ad0 cpu
tin tout KB/t tps MB/s us ni sy in id
1 561 45.18 44 1.95 14 0 5 0 82

b) Periodic watch of hdd i/o operations;

freebsd# iostat -c 10
tty ad0 cpu
tin tout KB/t tps MB/s us ni sy in id
1 562 45.19 44 1.95 14 0 5 0 82
0 307 51.96 113 5.73 44 0 24 0 32
0 234 58.12 98 5.56 16 0 7 0 77
0 43 0.00 0 0.00 1 0 0 0 99
0 485 0.00 0 0.00 2 0 0 0 98
0 43 0.00 0 0.00 0 0 1 0 99
0 43 0.00 0 0.00 0 0 0 0 100
...

As you see in the output, there is information like in the columns tty, tin, tout which is a bit hard to comprehend.
Thanksfully the tool has an option to print out only more essential i/o information:

freebsd# iostat -d -c 10
ad0
KB/t tps MB/s
45.19 44 1.95
58.12 97 5.52
54.81 108 5.78
0.00 0 0.00
0.00 0 0.00
0.00 0 0.00
20.48 25 0.50

The output info is quite self-explanatory.

Displaying a number of iostat values for hard disk reads can be also achieved by omitting -c option with:

freebsd# iostat -d 1 10
...

Tracking a specific hard disk partiotion with iostat is done with:

freebsd# iostat -n /dev/ad0s1a
tty cpu
tin tout us ni sy in id
1 577 14 0 5 0 81
c) Getting Hard disk read/write information with gstat

gstat is a FreeBSD tool to print statistics for GEOM disks. Its default behaviour is to refresh the screen in a similar fashion like top command, so its great for people who would like to periodically check all attached system hard disk and storage devices:

freebsd# gstat
dT: 1.002s w: 1.000s
L(q) ops/s r/s kBps ms/r w/s kBps ms/w %busy Name
0 10 0 0 0.0 10 260 2.6 15.6| ad0
0 10 0 0 0.0 10 260 2.6 11.4| ad0s1
0 10 0 0 0.0 10 260 2.8 12.5| ad0s1a
0 0 0 0 0.0 0 0 0.0 20.0| ad0s1b
0 0 0 0 0.0 0 0 0.0 0.0| ad0s1c
0 0 0 0 0.0 0 0 0.0 0.0| ad0s1d
0 0 0 0 0.0 0 0 0.0 0.0| ad0s1e
0 0 0 0 0.0 0 0 0.0 0.0| acd0

It even has colors if your tty supports colors 🙂

Another useful tool in debugging the culprit of excessive hdd I/O operations is procstat command:

Here is a sample procstat run to track (httpd) one of my processes imposing i/o hdd load:

freebsd# procstat -f 50404
PID COMM FD T V FLAGS REF OFFSET PRO NAME
50404 httpd cwd v d -------- - - - /
50404 httpd root v d -------- - - - /
50404 httpd 0 v c r------- 56 0 - -
50404 httpd 1 v c -w------ 56 0 - -
50404 httpd 2 v r -wa----- 56 75581 - /var/log/httpd-error.log
50404 httpd 3 s - rw------ 105 0 TCP ::.80 ::.0
50404 httpd 4 p - rw---n-- 56 0 - -
50404 httpd 5 p - rw------ 56 0 - -
50404 httpd 6 v r -wa----- 56 25161132 - /var/log/httpd-access.log
50404 httpd 7 v r rw------ 56 0 - /tmp/apr8QUOUW
50404 httpd 8 v r -w------ 56 0 - /var/run/accept.lock.49588
50404 httpd 9 v r -w------ 1 0 - /var/run/accept.lock.49588
50404 httpd 10 v r -w------ 1 0 - /tmp/apr8QUOUW
50404 httpd 11 ? - -------- 2 0 - -

Btw fstat is sometimes helpful in identifying the number of open files and trying to estimate which ones are putting the hdd load.
Hope this info helps someone. If you know better ways to track hdd excessive loads on Linux / BSD pls share 'em pls.
 

How to disable ACPI on productive Linux servers to decrease kernel panics and increase CPU fan lifespan

Tuesday, May 15th, 2012

Linux TUX ACPI logo / Tux Hates ACPI logohttps://www.pc-freak.net/images/linux_tux_acpi_logo-tux-hates-acpi.png

Why would anyone disable ACPI support on a server machine??
Well  ACPI support kernel loaded code is just another piece of code constantly being present in the memory,  that makes the probability for a fatal memory mess up leading to  a fatal bug resulting in system crash (kernel panic) more likely.

Many computers ship with buggy or out of specifications ACPI firmware which can cause a severe oddities on a brand new bought piece of comp equipment.

One such oddity related to ACPI motherboard support problems is if you notice your machine randomly powering off or failing to boot with a brand new Linux installed on it.

Another reason to switch off ACPI code will would to be prevent the CPU FAN rotation from being kernel controlled.

If the kernel controls the CPU fan on  high CPU heat up it will instruct the fan to rotate quickly and on low system loads it will bring back the fan to loose speed.
 This frequent switch of FAN from high speed to low speed  increases the probability for a short fan damage due to frequent changes of fan speed. Such a fan damage leads often to  system outage due to fan failure to rotate properly.

Therefore in my view it is better ACPI support is switched off completely on  servers. On some servers ACPI is useful as it can be used to track CPU temperature with embedded motherboard sensors with lm_sensors or any piece of hardwre vendor specific software provided. On many machines, however lm_sensors will not properly recognize the integrated CPU temperature sensors and hence ACPI is mostly useless.

There are 3 ways to disable fully or partially ACPI support.

- One is to disable it straight for BIOS (best way IMHO)
- Disable via GRUB or LILO passing a kernel parameter
- Partial ACPI off-ing - /disabling the software that controls the CPU fan/

1. Disable ACPI in BIOS level

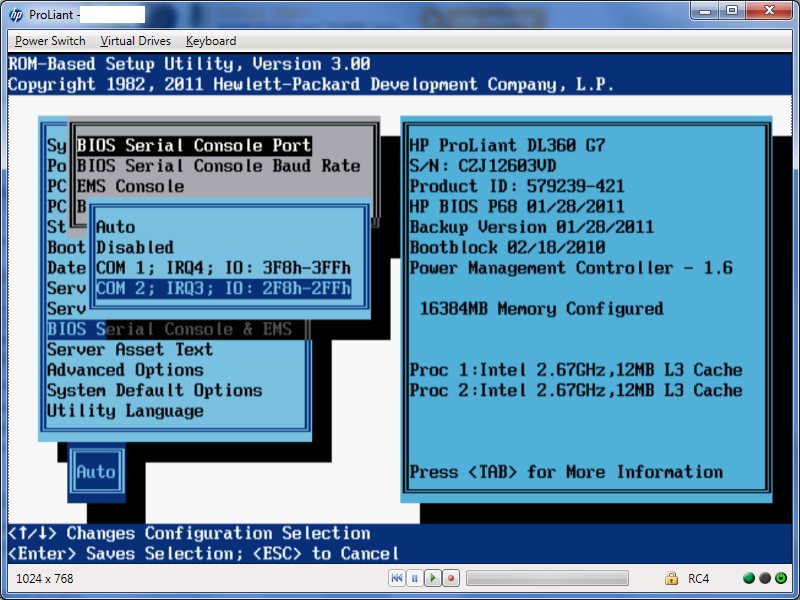
Press DEL, F1, F2, F10 or whatever the enter bios key combination is go through all the different menus (depending on the vios BENDOR) and make sure every occurance of ACPI is set to off / disable whatever it is called.

Below is a screenshot of menus with ACPI stuff on a motherboard equipped with Phoenix AwardBIOS:

BIOS ACPI Disable power Off Phoenix BIOS

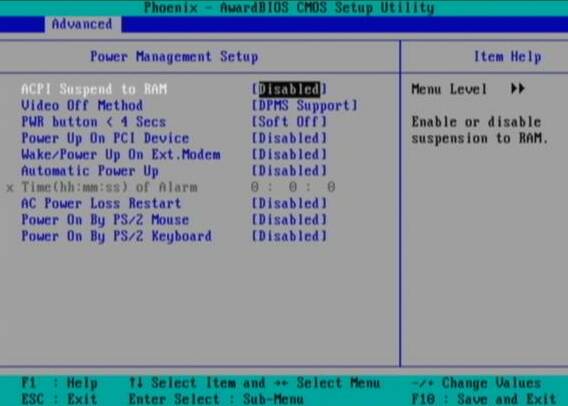
This is the in my opinon best and safest way to disable ACPI power saving, Unfortunately some newer PCs lack the functionality to disable ACPI; (probably due to the crazy "green" policy the whole world is nowdays mad of).

If that's the case with you, thanksfully there is a "software way" to disable ACPI via passing kernel options via GRUB and LILO boot loaders.

2. Disabling ACPI support on kernel boot level through GRUB boot loader config

There is a tiny difference in command to pass in order to disable  ACPI depending on the Linux installed  GRUB ver. 1.x or GRUB 2.x.

a) In GRUB 0.99 (GRUB version 1)

Edit file /etc/grub/menu.lst or /etc/grub/grub.conf (location differs across Linux distribution). Therein append:

acpi=off

to the end of kernel command line.

Here is an example of a kernel command line with ACPI not disabled (example taken from CentOS server grub.conf):

[root@centos ~]# grep -i title -A 4 /etc/grub/grub.conf
title Red Hat Enterprise Linux Server (2.6.18-36.el5)
root (hd0,0)
kernel /vmlinuz-2.6.18-36.el5 ro root=/dev/VolGroup00/LogVol00 console=ttyS0,115200n8
initrd /initrd-2.6.18-36.el5.img

The edited version of the file with acpi=off included should look like so:

title Red Hat Enterprise Linux Server (2.6.18-36.el5)
root (hd0,0)
kernel /vmlinuz-2.6.18-36.el5 ro root=/dev/VolGroup00/LogVol00 console=ttyS0,115200n8 acpi=off
initrd /initrd-2.6.18-36.el5.img

The kernel option root=/dev/VolGroup00/LogVol00 means the the server is configured to use LVM (Logical Volume Manager).

b) Disabling ACPI on GRUB version 1.99 +

This version is by default installed on newer Ubuntu and Debian Linux-es.

In grub 1.99 on latest Debian Squeeze, the file to edit is located in /boot/grub/grub.cfg. The file is more messy than with its predecessor menu.lst (grub 0.99).
Thanks God there is no need to directly edit the file (though this is possible), but on newer Linuces (as of time of writting the post), there is another simplied grub config file /etc/grub/config

Hence to add the acpi=off to 1.99 open /etc/grub/config find the line reading:

GRUB_CMDLINE_LINUX_DEFAULT="quiet"

and append the "acpi=off" option, e.g. the line has to change to:

GRUB_CMDLINE_LINUX_DEFAULT="quiet acpi=off"

On some servers it might be better to also disable APIC along with ACPI:

Just in case you don't know what is the difference between ACPI and APIC, here is a short explanation:

ACPI = Advanced Configuration and Power Interface

APIC = Advanced Programmable Interrupt Controllers

ACPI is the system that controls your dynamic speed fans, the power button behavior, sleep states, etc.

APIC is the replacement for the old PIC chip that used to come imbedded on motherboards that allowed you to setup interrupts for your soundcard, ide controllers, etc.

Hence on some machines experiencing still problems with even ACPI switched off, it is helpful  to disable the APIC support too, by using:

acpi=off noapic noacpi

Anyways, while doing the changes, be very very cautious or you might end up with un-boot-able server. Don't blame me if this happens :); be sure you have a backup option if server doesn't boot.

To assure faultless kernel boot, GRUB has ability to be configured to automatically load up a second kernel if 1st one fails to boot, if you need that read the grub documentation on that.

To load up the kernel with the new setting, give it a restart:

[root@centos ~]# shutdown -r now
....

3. Disable ACPI support on kernel boot time on Slackware or other Linuxes still booting kernel with LILO

Still, some Linux distros like Slackware, decided to keep the old way and use LILO (LInux LOader) as a default boot loader.

Disabling ACPI support in LILO is done through /etc/lilo.conf

By default in /etc/lilo.conf, there is a line:

append= acpi=on

it should be changed to:

append= acpi=off

Next to load up the new acpi disabled setting, lilo has to be reloaded:

slackware:~# /sbin/lilo -c /etc/lilo.conf
....

Finally a reboot is required:

slackware:~# reboot
....

(If you don't have a physical access or someone near the server you better not 🙂 )

4. Disable ACPI fan control support on a running Linux server without restart

This is the most secure work-around, to disabling the ACPI control over the machine CPU fan, however it has a downside that still the ACPI code will be loaded in the kernel and could cause kernel issues possibly in the long run – lets say the machine has uptime of more than 2 years…

The acpi support on a user level  is controlled by acpid or haldaemon (depending on the Linux distro), hence to disable the fan control on servers this services has to be switched off:

a) disabling ACPI on Debian and deb based Linux-es

As of time of writting on Debian Linux servers acpid (Advanced Configuration and Power Interface event daemon) is there to control how power management will be handled. To disable it stop it as a service (if running):

debian:~# /etc/init.d/acpid stop

To permanently remove acpid from boot up on system boot disable it with update-rc.d:

debian:~# update-rc.d acpid disable 2 3 4 5
update-rc.d: using dependency based boot sequencing
insserv: Script iptables is broken: incomplete LSB comment.
insserv: missing `Required-Start:' entry: please add even if empty.
insserv: warning: current start runlevel(s) (empty) of script `acpid' overwrites defaults (2 3 4 5).
insserv: warning: current stop runlevel(s) (2 3 4 5) of script `acpid' overwrites defaults (empty).
insserv: missing `Required-Start:' entry: please add even if empty.

b) disabling ACPI on RHEL, Fedora and other Redhat-s (also known as RedHacks 🙂 )

I'm not sure if this is safe,as many newer rpm based server system services,  might not work properly with haldaemon disabled.

Anyways you can give it a try if when it is stopped there are issues just bring it up again.

[root@rhel ~]# /etc/init.d/haldaemon stop

If all is fine with the haldaemon switched off (hope so), you can completely disable it to load on start up with:

[root@centos ~]# /sbin/chkconfig --level 2 3 4 5 haldaemon off

Disabling ACPI could increase a bit your server bills, but same time decrease losses from downtimes, so I guess it worths its costs 🙂


How to count lines of PHP source code in a directory (recursively)

Saturday, July 14th, 2012

Count PHP and other programming languages lines of source code (source code files count) recursively

Being able to count the number of PHP source code lines for a website is a major statistical information for timely auditting of projects and evaluating real Project Managment costs. It is inevitable process for any software project evaluation to count the number of source lines programmers has written.
In many small and middle sized software and website development companies, it is the system administrator task to provide information or script quickly something to give info on the exact total number of source lines for projects.

Even for personal use out of curiousity it is useful to know how many lines of PHP source code a wordpress or Joomla website (with the plugins) contains.
Anyone willing to count the number of PHP source code lines under one directory level, could do it with:::

serbver:~# cd /var/www/wordpress-website
server:/var/www/wordpress-website:# wc -l *.php
17 index.php
101 wp-activate.php
1612 wp-app.php
12 wp-atom.php
19 wp-blog-header.php
105 wp-comments-post.php
12 wp-commentsrss2.php
90 wp-config-sample.php
85 wp-config.php
104 wp-cron.php
12 wp-feed.php
58 wp-links-opml.php
59 wp-load.php
694 wp-login.php
236 wp-mail.php
17 wp-pass.php
12 wp-rdf.php
15 wp-register.php
12 wp-rss.php
12 wp-rss2.php
326 wp-settings.php
451 wp-signup.php
110 wp-trackback.php
109 xmlrpc.php
4280 total

This will count and show statistics, for each and every PHP source file within wordpress-website (non-recursively), to get only information about the total number of PHP source code lines within the directory, one could grep it, e.g.:::

server:/var/www/wordpress-website:# wc -l *.php |grep -i '\stotal$'
4280 total

The command grep -i '\stotal$' has \s in beginning and $ at the end of total keyword in order to omit erroneously matching PHP source code file names which contain total in file name; for example total.php …. total_blabla.php …. blabla_total_bla.php etc. etc.

The \s grep regular expression meaning is "put empty space", "$" is placed at the end of tital to indicate to regexp grep only for words ending in string total.

So far, so good … Now it is most common that instead of counting the PHP source code lines for a first directory level to count complete number of PHP, C, Python whatever source code lines recursively – i. e. (a source code of website or projects kept in multiple sub-directories). To count recursively lines of programming code for any existing filesystem directory use find in conjunction with xargs:::

server:/var/www/wp-website1# find . -name '*.php' | xargs wc -l
1079 ./wp-admin/includes/file.php
2105 ./wp-admin/includes/media.php
103 ./wp-admin/includes/list-table.php
1054 ./wp-admin/includes/class-wp-posts-list-table.php
105 ./wp-admin/index.php
109 ./wp-admin/network/user-new.php
100 ./wp-admin/link-manager.php
410 ./wp-admin/widgets.php
108 ./wp-content/plugins/akismet/widget.php
104 ./wp-content/plugins/google-analytics-for-wordpress/wp-gdata/wp-gdata.php
104 ./wp-content/plugins/cyr2lat-slugs/cyr2lat-slugs.php
,,,,
652239 total

As you see the cmd counts and displays the number of source code lines encountered in each and every file, for big directory structures the screen gets floated and passing | less is nice, e.g.:

find . -name '*.php' | xargs wc -l | less

Displaying lines of code for each file within the directories is sometimes unnecessery, whether just a total number of programming source code line is required, hence for scripting purposes it is useful to only get the source lines total num:::

server:/var/www/wp-website1# find . -name '*.php' | xargs wc -l | grep -i '\stotal$'

Another shorter and less CPU intensive one-liner to calculate the lines of codes is:::

server:/var/www/wp-website1# ( find ./ -name '*.php' -print0 | xargs -0 cat ) | wc -l

Here is one other shell script which displays all file names within a directory with the respective calculated lines of code

For more professional and bigger projects using pure Linux bash and command line scripting might not be the best approach. For counting huge number of programming source code and displaying various statistics concerning it, there are two other tools – SLOCCount
as well as clock (count lines of code)

Both tools, are written in Perl, so for IT managers concerned for speed of calculating projects source (if too frequent source audit is necessery) this tools might be a bit sluggish. However for most projects they should be of a great add on value, actually SLOCCount was already used for calculating the development costs of GNU / Linux and other projects of high importance for Free Software community and therefore it is proven it works well with ENORMOUS software source line code calculations written in programming languages of heterogenous origin.

sloccount and cloc packages are available in default Debian and Ubuntu Linux repositories, so if you're a Debilian user like me you're in luck:::

server:~# apt-cache search cloc$
cloc - statistics utility to count lines of code
server:~# apt-cache search sloccount$
sloccount - programs for counting physical source lines of code (SLOC)

Well that's all folks, Cheers en happy counting 😉

The lack of sharing in modern world – One more reason why sharing Movies and any data on the Internet should be always Legal

Saturday, July 7th, 2012

Importance of sharing in modern digital society, sharing should be legal, Sharing caring
 I've been thinking for a lot of time analyzing my already years ongoing passion for Free Software, trying to answer the question "What really made me be a keen user and follower of the ideology of the free software movement"?
I came to the conclusion it is the sharing part of free software that really made me a free software enthusiast. Let me explain ….

In our modern world sharing of personal goods (physical goods, love for fellows, money, resources etc.) has become critically low.The reason is probably the severely individualistic Western World modern culture model which seems to give good economic results.
Though western society might be successful in economic sense in man plan it is a big failure.
The high standard in social culture, the heavy social programming, high level of individualism and the collapsing spirituality in majority of people is probably the major key factors which influenced the modern society to turn into such a non-sharing culture that is almost ruling the whole world nations today.

If we go back a bit in time, one can easily see the idea and general philosophy of sharing is very ancient in nature. It was sharing that for years helped whole societies and culture grow and mature. Sharing is a fundamental part of Christian faith and many other religions as well and has been a people gathering point  for centuries.
However as modern man is more and more turning to the false fables of the materialistic origin of  man (Darwininsm), sharing is started seeing as unnecessary . Perhaps the decreased desire in people to share is also the reason why in large number people started being  self-interest oriented as most of us are nowadays.

As we share less and less of our physical and spiritual goods, our souls start being more and more empty day after day. Many people, especially in the western best developed societies; the masses attitude towards sharing is most evidently hostile.
Another factor which probably decreased our natural human desire to share is technocracy and changing of communication from physical as it used to be until few dacades to digital today.

The huge shift of communication from physical to digital, changes the whole essence of basic life, hence I believe at least the distorted sharing should be encouraged on the Internet (file movies and programs sharing) should be considered normal and not illegal..
I believe Using Free Software instead of non-free (proprietary) one is another thing through which we can stimulate sharing. If we as society appreciate our freedom at all  and  care for our children future, it is my firm conviction, we should do best to keep sharing as much as we can in both physical and digital sense.

Viewing JPEG,GIF and PNG in ASCII with cacaview on GNU / Linux – Review on caca-utils text mode graphics utilities

Thursday, May 17th, 2012

Stitch 80x45 libcaca mascot cacaview viewing JPG, PNG, GIF images as ASCII on Linux libcaca

Probably, many don't know that it is possible to view normal graphical pictures (JPG, PNG, GIF, BMP) etc. in plain console tty.

Being able to view pictures in ASCII is something really nice especially for console geeks like me.
The images produced sometimes are a bit unreadable, if compared to the original graphics, but anyways most of the pictures looks pretty decent 🙂

Viewing in console / terminal images on GNU / Linux is possible thanks to a library called libcaca, caca labs libcaca project official website here.
Below is a shot description of libcaca:
hipo@noah:~$ apt-cache show libcaca0|grep 'Description' -A 4
Description: colour ASCII art library
libcaca is the Colour AsCii Art library. It provides high level functions
for colour text drawing, simple primitives for line, polygon and ellipse
drawing, as well as powerful image to text conversion routines.

In Debian, Ubuntu and other deb Linux distros viewing GUI images with no need for Xserver or any kind of window manager in plain ASCII is possible with cacaview.

cacaview is part of a package called caca-utils. caca-utils is providing few other great utilities for ASCII freaks 🙂 along with cacaview console ascii viewer prog.
The package> is available for Debian distributins since many years, so even on a very old Debians like Debian – (Potato, Woody, Sarge) the package is available in default free package repositories ready to install via apt

To install apt-get it as usual:

noah:~# apt-get --yes install caca-utils

Here is a list of the binaries the package provides:

hipo@noah:~$ dpkg -L caca-utils|grep -i /usr/bin/
/usr/bin/cacaserver
/usr/bin/cacaplay
/usr/bin/cacafire
/usr/bin/cacademo
/usr/bin/cacaview
/usr/bin/img2txt

1. cacaserver a tiny program allowing network streaming of applications written in caca

Belkow is a chop, from man cacaserver
 

cacaserver reads libcaca animation files in its standard input and
serves them as ANSI art on network port 51914. These animations can be
created by any libcaca program by setting the CACA_DRIVER environment
variable to raw and piping the program's standard output to cacaserver.

Clients can then connect to port 51914 using telnet or netcat to see
the output.

The example section of the manual points 1 example use of cacaserver to stream the console output from cacademo.
cacademo binary is a short presentation ASCII DEMO in the spirit of the old school assembly demos (demoscene) .
To run it to bind on port 51914 one has to type in bash shell:
hipo@noah:~$ CACA_DRIVER=raw cacademo | cacaserver
initialised network, listening on port 51914

Then to check out how the demo looks, open telnet connection to the cacaserver host; In my case the cacaserver is binded and streamed over IP 192.168.0.2:

hipo@debian:~$ telnet 192.168.0.2 51914

Immediately you got the demo shining; Below are two screenshots of the demo played after succesful telnet connection:

Cacaserver - caca for the network screenshot Matrix cacademo

cacademo running over telnet network connection – Matrix

cacaserver running on Debian GNU / Linux drug addict like spots streamed via telnet

Blur spots cacademo shot of cacademo streamed via network

You see the demo looks quite awesome 🙂

2. Running cacafire to stream over network

Another possible example use of cacaserver is in conjunction with cacafire libcaca test application:

noah:~# CACA_DRIVER=raw cacafire | cacaserver
initialised network, listening on port 51914
cacafire is a short application written to render ASCII via libcaca and is just displaying a screen with ASCII (moving) burning fire.
It is quite spectacular if you, ask an unexpecting friend to connect to your host to 51914 🙂

Cacafire Screenshot Debian GNU / Linux cacaserver streaming ASCII demo via network port 51914

Besides that bored sys admins, could run cacafire in console to hypnotize themselves watching dumb the burning fire screen for few hoursor just use it as a screensaver 😉

3. cacaview a program to display a graphic images in console using ASCII art

cacaview takes just one argument – the picture to be displayed.

Below is a screenshot of cacaview ran from my gnome-terminal displaying a ASCII text version of the MySQL server logo

hipo@noah:~$ cd /disk/pictures
hipo@noah:/disk/pictures$ cacaview mysql_logo.png


cacaview displaying MySQL database logo in ASCII using caca for X

Whether cacaview is invoked in GUI, the libcaca X support is used, so the text image is visualized in new window with graphics, if however it is invoked in plain let's say tty1 libcaca displays the graphics pictures drawing it with only text characters.

Here is also a screenshot, I've made while viewing a GIF website logo in ASCII in plain tty console:

hipo@noah:~$ cacaview /disk/pictures/logo.gif

cacaview plain tty console screenshot of a website logo graphics pictures 17-05-2012

The logo is in cyrillic, so for latin speaking people some of the characters in the two words seen will be unreadable 🙂

cacaview even supports viewing, the next and previous picture in line, like in any modern graphics image viewer program.
To view a bunch of graphic pictures in ASCII with cacaview pass it *.*:

hipo@noah:~$ cacaview /disk/pictures/*.*

For simplicity the common unix * is also supported, so I find it quicker to do:

hipo@noah:~$ cacaview /disk/pictures/*

Showing pictures forward and backward (Previous / Next) picture is done with n and p kbd keys, whether;
n - next;
p - previous

cacaview doesn't crash or stop but skip unknown file formats – if for instance encounters filenames which are not images; lets say you have *.rar archive files along with other pictures.

The complete list of keys cacaview supports are:
br />

KEYS
? show the help screen

n, p switch to next image, previous image

Left, Right, Up, Down or h, l, k, j
scroll the image around

+, – zoom in and out

z reset the zoom level to normal

f switch fullscreen mode (hide/show menu and status bars)

d toggle the dithering mode (no dithering, 4×4 ordered dithering, 8×8 ordered dithering and random dithering)

q exit the program

4. Converting graphics images to ASCII art like (plain text pictures)

The tool that does "the trick" is img2txt. img2txt has a bit more options while compared to the rest of the aforementioned tools.The following list of arguments are recognized:

  • the size (font, height)
  • brightness
  • contrast
  • gamma and dither
  • format type of out the output pic

Anyways I found that the basic just in / out arguments passed are enough to produce pretty good results:

hipo@noah:~$ img2txt hipo_avatar.gif >hipo_avatar_pic.txt

The original hipo_avatar.gif file looks like so:

hipo avatar gif picture before img2txt convertion to text

After above img2txt command is run and hipo_avatar_pic.txt to see the colorful output ASCII art img2txt produces, cat it:

hipo@noah:~$ cat hipo_avatar_pic.txt

The image result if screenshot looks quite beautiful and even, can be considered or used as an ART effect image (filter) 🙂

Console Screenshot hipo avatar pic ASCII img2txt output picture

The picture colors are plain ANSI color, so in order to display properly the picture with colors on another computers or Operating System you will need at least basic support for ANSI colors.

Plenty of output file formats are supported by img2txt

Here is the complete list of supported output formats:
 

ansi : coloured ANSI
caca : internal libcaca format
utf8 : UTF8 with CR
utf8 : UTF8 with CRLF (MS Windows)
html : HTML with CSS and DIV support
html3 : Pure HTML3 with tables
irc : IRC with ctrl-k codes
bbfr : BBCode (French)
ps : Postscript
svg : Scalable Vector Graphics
tga : Targa Image

libcaca is available for FreeBSD too, but the caca-utils is not available as a port yet, though probably the deb or rpm packages can easily be ported to BSD.

Well that's all, Enjoy.

How to check the IP address of Skype (user / Contacts) on GNU / Linux with netstat and whois

Thursday, May 3rd, 2012

netstat check skype contact IP info with netstat Linux xterm Debian Linux

Before I explain how netstat and whois commands can be used to check information about a remote skype user – e.g. (skype msg is send or receved) in Skype. I will say in a a few words ( abstract level ), how skype P2P protocol is designed.
Many hard core hackers, certainly know how skype operates, so if this is the case just skip the boring few lines of explanation on how skype proto works.

In short skype transfers its message data as most people know in Peer-to-Peer "mode" (P2P)  – p2p is unique with this that it doesn't require a a server to transfer data from one peer to another. Most classical use of p2p networks in the free software realm are the bittorrents.

Skype way of connecting to peer client to other peer client is done via a so called "transport points". To make a P-to-P connection skype wents through a number of middle point destinations. This transport points (peers) are actually other users logged in Skype and the data between point A and point B is transferred via this other logged users in encrypted form. If a skype messages has to be transferred  from Peer A (point A) to Peer B (Point B) or (the other way around), the data flows in a way similar to:

 A -> D -> F -> B

or

B -> F -> D -> A

(where D and F are simply other people running skype on their PCs).
The communication from a person A to person B chat in Skype hence, always passes by at least few other IP addresses which are owned by some skype users who happen to be located in the middle geographically between the real geographic location of A (the skype peer sender) and B (The skype peer receiver)..

The exact way skypes communicate is way more complex, this basics however should be enough to grasp the basic skype proto concept for most ppl …

In order to find the IP address to a certain skype contact – one needs to check all ESTABLISHED connections of type skype protocol with netsat within the kernel network stack (connection) queue.

netstat displays few IPs, when skype proto established connections are grepped:

noah:~# netstat -tupan|grep -i skype | grep -i established| grep -v '0.0.0.0'
tcp 0 0 192.168.2.134:59677 212.72.192.8:58401 ESTABLISHED 3606/skype
tcp 0 0 192.168.2.134:49096 213.199.179.161:40029 ESTABLISHED 3606/skype
tcp 0 0 192.168.2.134:57896 87.120.255.10:57063 ESTABLISHED 3606/skype

Now, as few IPs are displayed, one needs to find out which exactly from the list of the ESTABLISHED IPs is the the Skype Contact from whom are received or to whom are sent the messages in question.

The blue colored IP address:port is the local IP address of my host running the Skype client. The red one is the IP address of the remote skype host (Skype Name) to which messages are transferred (in the the exact time the netstat command was ran.

The easiest way to find exactly which, from all the listed IP is the IP address of the remote person is to send multiple messages in a low time interval (let's say 10 secs / 10 messages to the remote Skype contact).

It is a hard task to write 10 msgs for 10 seconds and run 10 times a netstat in separate terminal (simultaneously). Therefore it is a good practice instead of trying your reflex, to run a tiny loop to delay 1 sec its execution and run the prior netstat cmd.

To do so open a new terminal window and type:

noah:~# for i in $(seq 1 10); do \
sleep 1; echo '-------'; \
netstat -tupan|grep -i skype | grep -i established| grep -v '0.0.0.0'; \
done

-------
tcp 0 0 192.168.2.134:55119 87.126.71.94:26309 ESTABLISHED 3606/skype
-------
tcp 0 0 192.168.2.134:49096 213.199.179.161:40029 ESTABLISHED 3606/skype
tcp 0 0 192.168.2.134:55119 87.126.71.94:26309 ESTABLISHED 3606/skype
-------
tcp 0 0 192.168.2.134:49096 213.199.179.161:40029 ESTABLISHED 3606/skype
tcp 0 0 192.168.2.134:55119 87.126.71.94:26309 ESTABLISHED 3606/skype
...

You see on the first netstat (sequence) exec, there is only 1 IP address to which a skype connection is established, once I sent some new messages to my remote skype friend, another IP immediatelly appeared. This other IP is actually the IP of the person to whom, I'm sending the "probe" skype messages.
Hence, its most likely the skype chat at hand is with a person who has an IP address of the newly appeared 213.199.179.161

Later to get exact information on who owns 213.199.179.161 and administrative contact info as well as address of the ISP or person owning the IP, do a RIPE  whois

noah:~# whois 213.199.179.161
% This is the RIPE Database query service.
% The objects are in RPSL format.
%
% The RIPE Database is subject to Terms and Conditions.
% See http://www.ripe.net/db/support/db-terms-conditions.pdf

% Note: this output has been filtered.
% To receive output for a database update, use the "-B" flag.
% Information related to '87.126.0.0 - 87.126.127.255'
inetnum: 87.126.0.0 - 87.126.127.255
netname: BTC-BROADBAND-NET-2
descr: BTC Broadband Service
country: BG
admin-c: LG700-RIPE
tech-c: LG700-RIPE
tech-c: SS4127-RIPE
status: ASSIGNED PA
mnt-by: BT95-ADM
mnt-domains: BT95-ADM
mnt-lower: BT95-ADM
source: RIPE # Filteredperson: Lyubomir Georgiev
.....

Note that this method of finding out the remote Skype Name IP to whom a skype chat is running is not always precise.

If for instance you tend to chat to many people simultaneously in skype, finding the exact IPs of each of the multiple Skype contacts will be a very hard not to say impossible task.
Often also by using netstat to capture a Skype Name you're in chat with, there might be plenty of "false positive" IPs..
For instance, Skype might show a remote Skype contact IP correct but still this might not be the IP from which the remote skype user is chatting, as the remote skype side might not have a unique assigned internet IP address but might use his NET connection over a NAT or DMZ.

The remote skype user might be hard or impossible to track also if skype client is run over skype tor proxy for the sake of anonymity
Though it can't be taken as granted that the IP address obtained would be 100% correct with the netstat + whois method, in most cases it is enough to give (at least approximate) info on a Country and City origin of the person you're skyping with.
 

Barcodes are dangerous for human freedom! Technology not trustable!

Monday, April 23rd, 2012

This post will be short as I'm starting to think long posts are mostly non-sense. Have you people all wondered of barcoding?
All world stores around the world have now barcoding. Barcode numbers regulations are being orchestrated by certain bodies, we people have no control over. Barcoding makes us dependent on technology as only technology can be used to read and store barcodes. It is technology that issues the barcodes. We have come to a point, where we humans trust more technology than our physical fellows. Trusting technology more than the close people to us is very dangerous. What if technology is not working as we expect it to?
What if there are hidden ways to control technology that we're not aware of?

Technology concepts are getting more and more crazy and abstract.
Thinks about the virtualization for a while. Virtualuzation is being praised loudly these days and everyone is turnning to it thinking it is cheap and realiable? The facts I've seen and the little of experience I had with it were way less than convicable.
Who came with this stupid idea, oh yes I remember IBM came with this insane idea some about 40 years ago … We had sanity for a while not massively adopting IBM's virtualization bulk ideas and now people got crazy again to use a number of virtualization technologies.
If you think for a while Virtualization is unreality (unexistence) of matter over another unreality. The programs that makes computers "runs" are not existent in practice, they only exist in some electricity form. Its just a sort of electric field if you think on it on a conceptual level …
As we trust all our lives nowdays on technology, how do we know this technological stored information is not altered by other fields, how we can be sure it always acts as we think it does and should? Was it tested for at least 40 years before adoption as any new advancement should be.
Well Of course not! Everything new is just placed in our society without too much thinking. Someone gives the money for production, someone else buys it and installs it and its ready to go. Or at least that's how the consumers thinks and we have become all consumers. This is a big LIE we're constantly being convinced in!
It is not ready to work, it is not tested and we don't know what the consequence of it will be!
Technology and Genetically Modified Food are not so different in this that they both can produce unexpected results in our lives. And they're already producing the bad fruits as you should have surely seen.
You can see more and more people are getting sick, more people go to doctor more people have to live daily with medication to live a miserable dishealthy I wouldn't say live but "poor" existence …
Next time they tell you new technology is good for you and will make your life better, Don't believe them! This is not necessery true.
Though todays technology can do you good, In my view the harm seriously exceeds the good.