Posts Tagged ‘log files’

How to Install and Use Grafana Loki on Linux for mupltiple server Log Metrics Monitoring

Tuesday, March 31st, 2026

how-to-install-and-use-grafana-loki-on-linux-for-log-metrics-monitoring-for-multiple-server-observability-logo
Grafana Loki
has become a popular choice for log management on Linux systems, nowadays, because free software like under AGPLv3 licence, it’s lightweight, cost-efficient, and integrates seamlessly with modern observability stacks. Unlike traditional log systems, Loki focuses on indexing metadata (labels) instead of full log content, which makes it especially attractive for Linux environments where logs can grow quickly.

Grafana Loki can be used to create fully featured logging stack. It has a small index and highly compressed chunks which simplifies the operation and significantly lowers the Storage expense of it.
Unlike other logging systems, Loki is built around the idea of only indexing metadata about your logs labels (just like Prometheus labels).
Log data itself is then compressed and stored in chunks in object stores such as Amazon Simple Storage Service (S3) or Google Cloud Storage (GCS), or even locally on the filesystem.

In this article will give you some real-world, practical usage of Loki on Linux, from its setup from zero to day-to-day use workflows.

Reasons why to use Loki on Linux ?

Linux systems generate logs mainly in /var/log but often used extra installed Apps tend to log in different locations for easier log distinguishment, e.g.
logs location might lack a good structure (be everywhere) :

Some common example locations, where logs are stored

  • /var/log/syslog
  • /var/log/auth.log
  • Application logs (/opt/app/logs/*.log)
  • Container logs, are kept within respective container ( Docker /  PodMan Kubernetes )

Sonner or later if you have to manage a large infrastructure of servers you end up, it is pretty easy to end up in a log mess.

This is exaclty where Loki helps you solve:

  • Centralize logs from multiple machines (within Grafana)
  • Search logs efficiently using log craeted labels
  • Correlate logs with metrics in Grafana

Loki Architecture Overview


loki-use-stack-chain-diagram-from-cloud-to-grafana

A typical Loki setup on Linux has 3 components:

  1. Loki server -> stores and queries logs
  2. Promtail -> collects logs from the around the system
  3. Grafana -> Use it to visualizes and queries logs

Promtail acts like a lightweight agent that tails log files and sends them to Loki.

I. Installing Loki on Linux

1. Download Loki

$ cd /usr/local/src
$ wget https://github.com/grafana/loki/releases/latest/download/loki-linux-amd64
$ chmod +x loki-linux-amd64
# mv loki-linux-amd64 /usr/local/bin/loki

2. Create a simple config like

auth_enabled: false

server:
  http_listen_port: 3100

ingester:
  lifecycler:
    address: 127.0.0.1
  chunk_idle_period: 5m

schema_config:
  configs:
    – from: 2020-10-24
      store: boltdb-shipper
      object_store: filesystem
      schema: v11
      index:
        prefix: index_
        period: 24h

storage_config:
  filesystem:
    directory: /var/lib/loki/chunks

3. Run Loki

# loki -config.file=loki.yaml


Hopefully if all is okay with loki.yaml config the service will start.

a. Installing Promtail (Log Collection)

Example  config (to modify to your preferences):

scrape_configs:
  – job_name: linux-logs
    static_configs:
      – targets:
          – localhost
        labels:
          job: syslog
          host: my-linux-server
          __path__: /var/log/*.log

This collects all logs in /var/log/ and labels them.

b. Run Promtail

# promtail -config.file=promtail.yaml

! Note that loki and promtail it is run as root (to have permissions to files which will be processed). This is not the best practice, so for security reasons,
if you have the necessery storage move out the files to a central log aggregator directory with a script set a unprevileged non-root user for it and run the services with those user.

c. Run loki / promtail as non-root user:

Once tested it runs, it is good idea to run two tools with non-root user, i.e.:
Run promtail as a dedicated user (e.g., promtail).

Add that user to groups like:

adm (for /var/log)

systemd-journal (for journal logs)
Adjust file permissions if needed

# useradd –system –no-create-home promtail
# usermod -aG adm promtail

$ loki -config.file=loki.yaml
$ promtail -config.file=promtail.yaml

II. Practical Use Cases of Loki on Linux

1. System Troubleshooting

One good use of Loki is to Search for errors in syslog:

{job="syslog"} |= "error"

By this you can Quickly diagnose:

  • Boot issues
  • Service failures
  • Kernel errors

2. SSH Login Monitoring

Track login attempts from /var/log/auth.log for many VM hosts:

{job="syslog"} |= "sshd"

You can detect:

  • Failed login attempts
  • Brute-force attacks
  • Unauthorized access

3. Application Debugging (look for exceptions)

If your app logs to /var/log/app.log and you App running it, to get a view on java thrown exceptions:

{job="app"} |= "exception"

This use case can Help developers to:

  • Trace bugs
  • Monitor runtime issues
  • Correlate logs with deployments

4. Multi-Server Log Aggregation

Once you run Promtail on multiple Linux servers:

labels:
  host: server1

Then you can do query to extract collected data for each one if it:

{job="syslog", host=~"server1|server2"}

This makes multiple machines behave like one unified log source.

5. Log-Based Metrics

You can extract metrics from logs:

count_over_time({job="syslog"} |= "error" [5m])

Use this for:

  • Alerting
  • Error rate tracking
  • Incident detection

III. Using Grafana for Visualization

In Grafana, you can:

  • View logs in real time
  • Build dashboards
  • Create alerts based on log patterns

Example use would be:

Create Grafana Panel showing error rate per host and Alert when errors exceed a threshold.

loki-log-drill-down-sample-in-grafana

Good Practices on Loki use

1. Always Use Meaningful Labels

Example for Good label should contain as many descriptory parameters as possible:

labels:
  app: nginx
  env: prod
  virtualization: vmware
  type: Middleware
  service:: proxy
  Customer: customerA

Bad obscure label:

labels:
  request_id: 123456  


2. Avoid Too many Unique labels

Keep in mind Too many unique labels leads to poor performance !.

3. Rotate Logs Properly and optimize with Secure Loki Endpoint

Loki won't manage your internal logs, as it can well complement ( but not replaces ), on Server / VM traditional tools like journalctl / grep / logrotate. but just give you a better overview of what is inside of service spit logs based on easy to give criterias from Grafana.
You will still need usually at best scenario to  setup of a Central Logging Server (to store all Infrastucture logs).
Consider also that sending data from your logs with Loki, like with a zabbix client it is always a idea to have reverse proxy like NGINX or Haproxy to reduce Network bandwith and for better management centralization of the infra.

4. Secure Loki Endpoint

  • Use reverse proxy (NGINX)
  • Enable authentication in production

Closure Summary

On Linux, Grafana Loki can help when:

  • You have multiple servers
  • Logs are growing fast
  • You need centralized  and relatively easy observability

Loki has its downtimes too as processing the logs to really extract data hits a high CPU use. Running it on a multiple machines is useful,
especially if your machines has high unutilized CPU IDLE time and you want to make the log data collection per server based being so to say partially duplicated and indepdendent from centralized logging. .
For high scale infrastructure, however sysadmins prefer to use an ELK OpenSearch Stack or log databases such as:
VictoriaLogs. With having infrastrcture of 100 servers or so perhaps setting up with some Ansible automation Loki makes sense.
Loki
is not meant to replace databases or full-text search engines, but great often for simple  log aggregation and analysis and of the simplistic tools available today.

Unlocking the Power of lnav: Logfile Navigator – ncurses text based tool guide to mutiple Logs on multiple servers easy analysis on Linux

Saturday, September 13th, 2025

lnav-syslog-screenshot-linux-virtual-machine

If you've ever found yourself buried under a mountain of log files, tailing multiple outputs, or grepping through endless lines trying to spot an error, it's time to meet your new best friend: lnav, the Logfile Navigator.

Lightweight, terminal-based, and surprisingly powerful, lnav is one of the most underrated tools for developers, sysadmins, and anyone who regularly digs into logs. It turns your chaotic logs into something that’s not only readable—but genuinely useful.

What is lnav and why use it ?

lnav (Logfile Navigator) is a command-line tool for viewing and analyzing log files. It goes beyond tail, less, or grep by:

  • Automatically detecting and merging log formats.
  • Highlighting timestamps, log levels, and errors.
  • Providing SQL-like queries over your logs.
  • Offering interactive navigation with a UI inside the terminal.

And yes, all of that without needing to set up a database or a server.

1. Installing lnav on Linux

Installation is straightforward. On most systems, you can install it via package managers:

On Ubuntu/Debian:

# apt install lnav

On Fedora:

# dnf install lnav

On Arch Linux:

# pacman -S lnav

Or build from source via GitHub if you want the latest version.

2. Use lnav Instead of Tail / Grep why?

Traditional tools are powerful, but they require manual work to chain together functionality. lnav gives you:

  • Automatic multi-log parsing: Drop multiple logs in, and it merges them chronologically.
  • Syntax highlighting: Errors and warnings stand out.
  • SQL querying: Run queries like SELECT * FROM syslog_log WHERE log_level = 'error';
  • Filtering and searching: Use intuitive filters and bookmarks to highlight specific entries.

3. Basic tool Usage is simple

Let’s say you want to inspect a system log:

# lnav /var/log/syslog

You'll immediately get:

  • Color-coded output (timestamps, levels, messages).
  • Scrollable view (arrow keys, PgUp, PgDn).
  • Real-time updates (like tail -f).
  • Search with /, filter with :filter-in, and even SQL queries.

Lets say you need to analyze Apache webserver logs recursively including the logs already rotated and gunzipped with *.gz extension on CentOS / Fedora / RHEL, you can do it with:

# lnav -r /var/log/httpd

You can parse the log file and get additional information about requests as well as you can print overall summary of log file.

Choose the line you want to parse. The selected line is always the one at the top of the window. Then press 'p' and you should see the following result:

https://pc-freak.net/images/lnav-get-extra-information-about-apache-query-with-P-press-key-screenshot-linux

Now, if you want to see a summary view of the logs by date and time, simply press 'i'.

lnav-linux-apache-log-review-summary-of-errors-warnings-normal-screenshot

To quit a screen you have chosen press 'q'.

4. LNAV helpful options and hotkeys

Once you've opened a log file/s for analyze you can use few hotkeys that will allow us to move through the output of lnav and the available views more easily:

e or E to jump to the next / previous error message.
w or W to jump to the next / previous warning message.
b or Backspace to move to the previous page.
Space to move to the next page.
g or G to move to the top / bottom of the current view.

To take a closer look at the way lnav operates, use -d option, the debug information is to be spit inside a .txt file:

# lnav /var/log/httpd -d lnav.txt

In this example, the debug information that is generated when lnav starts will be written to a file named lnav.txt inside the current working directory.

5. Real-World Use Cases

a. Troubleshooting application or system process Crashes

Open all relevant logs in one go:

# lnav /var/log/*.log

Errors are highlighted, and you can jump between them with n / N kbd keys.

b. Combining Multiple Logs

Working with an app that logs to different files and you need to combine:

# lnav /var/log/nginx/access.log /var/log/nginx/error.log


Or lets say you want to combine Apache Webserver with Haproxy log and get log summaries or filter out stuff:

lnav /var/log/apache2/access.log /var/log/haproxy.log


Now you will get a single, chronological timeline of events.


If you want to Search for a concrete occurance of Error / Warning or IP address inside a bunch of loaded combined logs you can do it with the same command like in simple vim by pressing / (slash) from kbd and type out what you want to filter out to get shown.

c. Analyze SQL Queries Logs

Yes, you can actually do this by passing it query in its command prompt :

:.schema
:SELECT log_time, log_level, log_message FROM syslog_log WHERE log_level = 'error';

You get a table of filtered logs, sortable by columns.
 

6. lnav more usage command tips

  • :help — Opens the help menu.
  • :filter-in <string> — Show only lines matching <string>.
  • :filter-out <string> — Hide lines matching <string>.
  • :export-to <filename> — Export current view to a file.
  • :tag <tagname> — Tag lines for later reference.
  • q — Quit (but why would you want to?).


7. Using lnav as a pager for systemd-journald

journalctl | lnav
# journalctl -f | lnav
# journalctl -u ssh.service | lnav

https://pc-freak.net/images/lnav_sshservice-log-view-screenshot-linux
 

8. Use lnav to review remote ssh logs

Newer versions after 0.10 supports ssh protocol as well and theoretically should work:

# lnav user@server-name-here:/var/log/file.log


To read all logs inside /var/log

# lnav root@server-name-here:/var/log/
# lnav root@server-name-here:/var/log/*.err

9. Using lnav to view docker container logs

# docker logs 811ab84aa95l | lnav
# docker logs -f application | lnav

The latest version of lnav supports even the following  simplified docker:// URL syntax:

# lnav docker://{container_id_or_name}/dir_path/to/log/file
# lnav docker://{container_id_or_name}/var/dir_path/log
# lnav docker://application/var/log/
# lnav docker://applcation/var/log/nginx/nginx.app.log

10. Monitoring compilation and command output useful for developers
 

Compilation from archived tar balls with ./configure && make etc. generate lot of outputs and logs while working. 
Here is where the tool can come handy. 
For example, here is how to watch the output of make command when compiling something:

# lnav -e './configure && make'

 11. Learning lnav tool through online ssh service availability via lnav.org

f you're lazy to install it and want to test it anyways:
 

# Start The Basic Tutorial:
ssh -o PubkeyAuthentication=no -o PreferredAuthentications=password tutorial1@demo.lnav.org


# Playground:
ssh -o PubkeyAuthentication=no -o PreferredAuthentications=password playground@demo.lnav.org


Closure

While tools like Kibana, Grafana, and ELK stacks are powerful, they can be overkill for many use cases—especially when you're SSHed into a box and just need to get answers fast. That’s where lnav shines as it is fast, lightweight, visual and can be used offline.

If you’re a developer, sysadmin, SRE (Site Reliability Engineer), or just someone who cares about logs, give lnav a spin. It might just become among your favorite sysadm tools on Linux and safe you pretty much of time if you have to do log reading and analyzing on daily basis (for example if you're admining 20+ or more Linux servers.


Zabbix Power Shell PS1 script to write zero or one if string is matched inside log file

Monday, December 2nd, 2024

How to Install and Configure Zabbix Server and Client on Rocky Linux 9 - Cộng Đồng Linux

At work we had setup zabbix log file processing for few servers for a service that is doing a Monitoring Health Checks for a a special application via an encrypted strong encrypted tunnel. The app based on the check reports whether the remote side has processed data or not.
As me and my team are not maintainers of the zabbix-server where the zabbix-agents are sending the data, there is a multiple content of data being sent in simply "" empty strings via a zabbix Item setup. Those empty strings however gets stored in the zabbix-server database and since this check is made frequently about 500 hundred records of empty string lines are being written to the zabbix server, we got complaint by the zabbix adminsitrators, that we have to correct our Monitoring setup to not flood the zabbix-server.

Since zabbix cannot catch up the "" empty string and we cannot supress the string from being written in the Item, we needed a way to change the monitoring so that the configured Application check returns 1 (on error) and 0 (on success).

Zabbix even though advanced has a strange when zabbix log[] function, e.g. 

log[/path/to/log,,,,skip]

log function, used to analyze a log file and cut out last or first lines of a file simmilar to UNIX's  head and tail over log files this is described in the zabbix log file monitoring here . If a string is matched it can return string 1, but if nothing gets matched the result is empty string "" and this empty string cannot be used in a way to analyze the data with Item is used.

There is plenty of discussions online for this weird behavior and many people do offer different approaches to solve the strange situation, but as we have tried with our colleagues sys admins  none of those really worked out.

Thus we decided to use the classical way to work around, e.g. to simply use a powershell script that would check a number of lines inside a provided log file analyze if a string gets found and print out value of "1" if the string is matched or "0" "if not and this PS1 script to be set to run via a standard zabbix userparameter script.

This worked well, as all of us are mainly managing Linux systems, and we don't have enough knowledge on powershell we have used our internal Aartificial Intelligence (AI) clone tool to LibreChat – A free and open source ChatGPT clone.

LibreChat includes OpenAI's models, but also others — both open-source and closed-source — and its website promises "seamless integration" with AI services from OpenAI, Azure, Anthropic, and Google — as well as GPT-4, Gemini Vision, and many others. ("Every AI in one place," explains LibreChat's home page.) Plugins even let you make requests to DALL-E or Stable Diffusion for image generations. (LibreChat also offers a database that tracks "conversation state" — making it possible to switch to a different AI model in mid-conversation…)

$logfile = "C:\path\to\your\logfile.log"
$searchString = "-1"
 
# Get the last 140 lines
$lines = Get-Content $logfile -Tail 140
 
# Filter lines containing the search string
$found = $lines | Where-Object { $_ -match [regex]::Escape($searchString) }
 
# Output found lines or 0 if none were found
if ($found) {
    $found | ForEach-Object { $_ }
} else {
    Write-Host 0
}

You can download and the return_zero_or_one-if-string-matches-in-log-powershell.ps1 script here

How to configure multiple haproxies and frontends to log in separate log files via rsyslog

Monday, September 5th, 2022

log-multiple-haproxy-servers-to-separate-files-log-haproxy-froentend-to-separate-file-haproxy-rsyslog-Logging-diagram
In my last article How to create multiple haproxy instance separate processes for different configuration listeners,  I've shortly explained how to create a multiple instances of haproxies by cloning the systemd default haproxy.service and the haproxy.cfg to haproxyX.cfg.
But what if you need also to configure a separate logging for both haproxy.service and haproxy-customname.service instances how this can be achieved?

The simplest way is to use some system local handler staring from local0 to local6, As local 1,2,3 are usually used by system services a good local handler to start off would be at least 4.
Lets say we already have the 2 running haproxies, e.g.:

[root@haproxy2:/usr/lib/systemd/system ]# ps -ef|grep -i hapro|grep -v grep
root      128464       1  0 Aug11 ?        00:01:19 /usr/sbin/haproxy -Ws -f /etc/haproxy/haproxy.cfg -p /run/haproxy.pid -S /run/haproxy-master.sock
haproxy   128466  128464  0 Aug11 ?        00:49:29 /usr/sbin/haproxy -Ws -f /etc/haproxy/haproxy.cfg -p /run/haproxy.pid -S /run/haproxy-master.sock

root      346637       1  0 13:15 ?        00:00:00 /usr/sbin/haproxy-customname-wrapper -Ws -f /etc/haproxy/haproxy_customname_prod.cfg -p /run/haproxy_customname_prod.pid -S /run/haproxy-customname-master.sock
haproxy   346639  346637  0 13:15 ?        00:00:00 /usr/sbin/haproxy-customname-wrapper -Ws -f /etc/haproxy/haproxy_customname_prod.cfg -p /run/haproxy_customname_prod.pid -S /run/haproxy-customname-master.sock


1. Configure local messaging handlers to work via /dev/log inside both haproxy instance config files
 

To congigure the separte logging we need to have in /etc/haproxy/haproxy.cfg and in /etc/haproxy/haproxy_customname_prod.cfg the respective handlers.

To log in separate files you should already configured in /etc/haproxy/haproxy.cfg something like:


global
        stats socket /var/run/haproxy/haproxy.sock mode 0600 level admin #Creates Unix-Like socket to fetch stats
        log /dev/log    local0
        log /dev/log    local1 notice

#       nbproc 1
#       nbthread 2
#       cpu-map auto:1/1-2 0-1
        nbproc          1
        nbthread 2
        cpu-map         1 0
        cpu-map         2 1
        chroot /var/lib/haproxy
        user haproxy
        group haproxy
        daemon
        maxconn 99999

defaults
        log     global
        mode    tcp


        timeout connect 5000
        timeout connect 30s
        timeout server 10s

    timeout queue 5s
    timeout tunnel 2m
    timeout client-fin 1s
    timeout server-fin 1s

    option forwardfor
        maxconn 3000
    retries                 15

frontend http-in
        mode tcp

        option tcplog
        log global


        option logasap
        option forwardfor
        bind 0.0.0.0:80

default_backend webservers_http
backend webservers_http
    fullconn 20000
        balance source
stick match src
    stick-table type ip size 200k expire 30m

        server server-1 192.168.1.50:80 check send-proxy weight 255 backup
        server server-2 192.168.1.54:80 check send-proxy weight 254
        server server-3 192.168.0.219:80 check send-proxy weight 252 backup
        server server-4 192.168.0.210:80 check send-proxy weight 253 backup
        server server-5 192.168.0.5:80 maxconn 3000 check send-proxy weight 251 backup

For the second /etc/haproxy/haproxy_customname_prod.cfg the logging configuration should be similar to:
 

global
        stats socket /var/run/haproxy/haproxycustname.sock mode 0600 level admin #Creates Unix-Like socket to fetch stats
        log /dev/log    local5
        log /dev/log    local5 notice

#       nbproc 1
#       nbthread 2
#       cpu-map auto:1/1-2 0-1
        nbproc          1
        nbthread 2
        cpu-map         1 0
        cpu-map         2 1
        chroot /var/lib/haproxy
        user haproxy
        group haproxy
        daemon
        maxconn 99999

defaults
        log     global
        mode    tcp


2. Configure separate haproxy Frontend logging via local5 inside haproxy.cfg
 

As a minimum you need a configuration for frontend like:


frontend http-in
        mode tcp

        option tcplog
        log /dev/log    local5 debug
…..
….

..
.

Of course the mode tcp in my case is conditional you might be using mode http etc. 


3. Optionally but (preferrably) make local5 / local6 handlers to work via rsyslogs UDP imudp protocol


In this example /dev/log is straightly read by haproxy instead of sending the messages first to rsyslog, this is a good thing in case if you have doubts that rsyslog might stop working and respectively you might end up with no logging, however if you prefer to use instead rsyslog which most of people usually do you will have instead for /etc/haproxy/haproxy.cfg to use config:

global
    log          127.0.0.1 local6 debug

defaults
        log     global
        mode    tcp

And for /etc/haproxy_customname_prod.cfg config like:

global
    log          127.0.0.1 local5 debug

defaults
        log     global
        mode    tcp

If you're about to send the haproxy logs directly via rsyslog, it should have enabled in /etc/rsyslog.conf the imudp module if you're not going to use directly /dev/log

# provides UDP syslog reception
module(load="imudp")
input(type="imudp" port="514")


4. Prepare first and second log file and custom frontend output file and set right permissions
 

Assumably you already have /var/log/haproxy.log and this will be the initial haproxy log if you don't want to change it, normally it is installed on haproxy package install time on Linux and should have some permissions like following:

root@haproxy2:/etc/rsyslog.d# ls -al /var/log/haproxy.log
-rw-r–r– 1 haproxy haproxy 6681522  1 сеп 16:05 /var/log/haproxy.log


To create the second config with exact permissions like haproxy.log run:

root@haproxy2:/etc/rsyslog.d# touch /var/log/haproxy_customname.log
root@haproxy2:/etc/rsyslog.d# chown haproxy:haproxy /var/log/haproxy_customname.log

Create the haproxy_custom_frontend.log file that will only log output of exact frontend or match string from the logs
 

root@haproxy2:/etc/rsyslog.d# touch  /var/log/haproxy_custom_frontend.log
root@haproxy2:/etc/rsyslog.d# chown haproxy:haproxy  /var/log/haproxy_custom_frontend.log


5. Create the rsyslog config for haproxy.service to log via local6 to /var/log/haproxy.log
 

root@haproxy2:/etc/rsyslog.d# cat 49-haproxy.conf
# Create an additional socket in haproxy's chroot in order to allow logging via
# /dev/log to chroot'ed HAProxy processes
$AddUnixListenSocket /var/lib/haproxy/dev/log

# Send HAProxy messages to a dedicated logfile
:programname, startswith, "haproxy" {
  /var/log/haproxy.log
  stop
}


Above configs will make anything returned with string haproxy (e.g. proccess /usr/sbin/haproxy) to /dev/log to be written inside /var/log/haproxy.log and trigger a stop (by the way the the stop command works exactly as the tilda '~' discard one, except in some newer versions of haproxy the ~ is no now obsolete and you need to use stop instead (bear in mind that ~ even though obsolete proved to be working for me whether stop not ! but come on this is no strange this is linux mess), for example if you run latest debian Linux 11 as of September 2022 haproxy with package 2.2.9-2+deb11u3.
 

6. Create configuration for rsyslog to log from single Frontend outputting local2 to /var/log/haproxy_customname.log
 

root@haproxy2:/etc/rsyslog.d# cat 48-haproxy.conf
# Create an additional socket in haproxy's chroot in order to allow logging via
# /dev/log to chroot'ed HAProxy processes
$AddUnixListenSocket /var/lib/haproxy/dev/log

# Send HAProxy messages to a dedicated logfile
#:programname, startswith, "haproxy" {
#  /var/log/haproxy.log
#  stop
#}
# GGE/DPA 2022/08/02: HAProxy logs to local2, save the messages
local5.*                                                /var/log/haproxy_customname.log


You might also explicitly define the binary that will providing the logs inside the 48-haproxy.conf as we have a separate /usr/sbin/haproxy-customname-wrapper in that way you can log the output from the haproxy instance only based
on its binary command and you can omit writting to local5 to log via it something else 🙂

root@haproxy2:/etc/rsyslog.d# cat 48-haproxy.conf
# Create an additional socket in haproxy's chroot in order to allow logging via
# /dev/log to chroot'ed HAProxy processes
$AddUnixListenSocket /var/lib/haproxy/dev/log

# Send HAProxy messages to a dedicated logfile
#:programname, startswith, "haproxy" {
#  /var/log/haproxy.log
#  stop
#}
# GGE/DPA 2022/08/02: HAProxy logs to local2, save the messages

:programname, startswith, "haproxy-customname-wrapper " {
 
/var/log/haproxy_customname.log
  stop
}


7. Create the log file to log the custom frontend of your preference e.g. /var/log/haproxy_custom_frontend.log under local5 /prepare rsyslog config for
 

root@haproxy2:/etc/rsyslog.d# cat 47-haproxy-custom-frontend.conf
$ModLoad imudp
$UDPServerAddress 127.0.0.1
$UDPServerRun 514
#2022/02/02: HAProxy logs to local6, save the messages
local4.*                                                /var/log/haproxy_custom_frontend.log
:msg, contains, "https-in" ~

The 'https-in' is my frontend inside /etc/haproxy/haproxy.cfg it returns the name of it every time in /var/log/haproxy.log therefore I will log the frontend to local5 and to prevent double logging inside /var/log/haproxy.log of connections incoming towards the same frontend inside /var/log/haproxy.log, I have the tilda symbol '~' which instructs rsyslog to discard any message coming to rsyslog with "https-in" string in, immediately after the same frontend as configured inside /etc/haproxy/haproxy.cfg will output the frontend operations inside local5.


!!! Note that for rsyslog it is very important to have the right order of configurations, the configuration order is being considered based on the file numbering. !!!
 

Hence notice that my filter file number 47_* preceeds the other 2 configured rsyslog configs.
 

root@haproxy2:/etc/rsyslog.d# ls -1
47-haproxy-custom-frontend.conf
48-haproxy.conf
49-haproxy.conf

This will make 47-haproxy-custom-frontend.conf to be read and processed first 48-haproxy.conf processed second and 49-haproxy.conf processed third.


8. Reload rsyslog and haproxy and test


root@haproxy2: ~# systemctl restart rsyslog
root@haproxy2: ~# systemctl restart haproxy
root@haproxy2: ~# systemctl status rsyslog

● rsyslog.service – System Logging Service
     Loaded: loaded (/lib/systemd/system/rsyslog.service; enabled; vendor preset: enabled)
     Active: active (running) since Thu 2022-09-01 17:34:51 EEST; 1s ago
TriggeredBy: ● syslog.socket
       Docs: man:rsyslogd(8)
             man:rsyslog.conf(5)
             https://www.rsyslog.com/doc/
   Main PID: 372726 (rsyslogd)
      Tasks: 6 (limit: 4654)
     Memory: 980.0K
        CPU: 8ms
     CGroup: /system.slice/rsyslog.service
             └─372726 /usr/sbin/rsyslogd -n -iNONE

сеп 01 17:34:51 haproxy2 systemd[1]: Stopped System Logging Service.
сеп 01 17:34:51 haproxy2 rsyslogd[372726]: warning: ~ action is deprecated, consider using the 'stop' statement instead [v8.210>
сеп 01 17:34:51 haproxy2 systemd[1]: Starting System Logging Service…
сеп 01 17:34:51 haproxy2 rsyslogd[372726]: [198B blob data]
сеп 01 17:34:51 haproxy2 systemd[1]: Started System Logging Service.
сеп 01 17:34:51 haproxy2 rsyslogd[372726]: [198B blob data]
сеп 01 17:34:51 haproxy2 rsyslogd[372726]: imuxsock: Acquired UNIX socket '/run/systemd/journal/syslog' (fd 3) from systemd.  [>
сеп 01 17:34:51 haproxy2 rsyslogd[372726]: [origin software="rsyslogd" swVersion="8.2102.0" x-pid="372726" x-info="https://www.

Do some testing with some tool like curl / wget / lynx / elinks etc. on each of the configured haproxy listeners and frontends and check whether everything ends up in the correct log files.
That's all folks enjoy ! 🙂

 

Tightening PHP Security on Apache 2.2 with ModSecurity2 on Debian Lenny Linux

Monday, April 26th, 2010

Tightening-PHP-Security-on-Apache-2.2-2.4-with-Apache-ModSecurity2
In this article you'll learn how I easily installed and configured the ModSecurity 2 on a Debian Lenny system.
First let me give you a few introductionary words to modsecurity, what is it and why it's a good idea to install and use it on your Apache Webserver.

ModSecurity is an Apache module that provides intrusion detection and prevention for web applications. It aims at shielding web applications from known and unknown attacks, such as SQL injection attacks, cross-site scripting, path traversal attacks, etc.

As you can see from ModSecurity’s description it’s a priceless module add on to Apache that is able to protect your PHP Applications and Apache server from a huge number of hacker attacks undertook against your Online Web Application or Webserver.
The only thing I don’t like about this module is that it is actually a 3rd party module (e.g. not officially part of Apache). Some time ago I remember there was even an exploit for one of the versions of the module.
So in some cases the ModSecurity could also pose a security risk, so beware!
However if you know what you'rre doing and you keep a regular track of security news on some major security websites, that shouldn’t be a concern for you.
Now let'ss proceed to the install of the ModSecurity module itself.
The install is a piece of cake on Debian though you'll be required to use the Debian Lenny backports

Here is the install of the module step by step:

1. First add the gpg key of the backports repository to your install

debian-server:~# gpg --keyserver pgp.mit.edu --recv-keys C514AF8E4BA401C3
# another possible way to add the repository as the website describes is through the command
debian-server:~# wget -O - http://backports.org/debian/archive.key | apt-key add -

2. Install the libapache-mod-security package from the backports Debian Lenny repository

debian-server~:~# apt-get -t lenny-backports install libapache2-mod-security2

Now as a last step of the install ModSeccurity install procedure you have to add some configuration directives to Apache and restart the server afterwards.

– Open your /etc/apache2/apache2.conf and place in it the following configurations


<IfModule mod_security2.c>
# Basic configuration options
SecRuleEngine On
SecRequestBodyAccess On
SecResponseBodyAccess Off

# Handling of file uploads
# TODO Choose a folder private to Apache.
# SecUploadDir /opt/apache-frontend/tmp/
SecUploadKeepFiles Off

# Debug log
SecDebugLog /var/log/apache2/modsec_debug.log
SecDebugLogLevel 0

# Serial audit log
SecAuditEngine RelevantOnly
SecAuditLogRelevantStatus ^5
SecAuditLogParts ABIFHZ
SecAuditLogType Serial
SecAuditLog /var/log/apache2/modsec_audit.log

# Maximum request body size we will
# accept for buffering
SecRequestBodyLimit 131072

# Store up to 128 KB in memory SecRequestBodyInMemoryLimit 131072
# Buffer response bodies of up to # 512 KB in length SecResponseBodyLimit 524288
</IfModule>

The ModSecurity2 module would be properly installed and configured as an Apache module.
3.All left is to restart Apache in order the new module and configurations to take effect.

debian-server:~# /etc/init.d/apache restart

Don’t forget to check the apache conf file for errors before restarting the Apache with the above command for that to happen issue the command:
debian-server:~# apache2ctl -t

If all is fine you should get as an output:

Syntax OK

4. Next to find out if the Apache ModSecurity2 module is enabled and already used by Apache as a mean of protection you,
you might want to check if the log files modsec_audit.log and modsec_debug.log files has grown and doesfeed a new content.
If they’re growing and you see messages concerning the operation of the ModSecurity2 Apache module that’s a sure sign all is fine.
5. As we have the Mod Security Apache module configured on our Debian Server, now we will need to apply some ModSecurity Core Rules .
In short ModSecurity Core Rules are some critical protection rules against attacks across almost every web architecture.
Another really neat thing about Core Rules (CRS) for ModSecurity is that they are written with a performance in mind.
So enabling this filter rules won’t be a too heavy load for your Apache server.

Here is how to install the core rules:

6. Download latest ModSecurity Code Rules

Download them from the following Code Rule url
At the time of writting this article the latest code rules are version modsecurity-crs_2.0.6.tar.gz

To download and install this rules issue some commands like:

debian-server:~# wget http://sourceforge.net/projects/mod-security/files/modsecurity-crs/0-CURRENT/modsecurity-crs_2.0.6.tar.gz/download
debian-server:~# cp -rpf ~/modsecurity-crs_2.0.6.tar.gz /etc/apache2/
debian-server:~# cd /etc/apache2/; tar -zxvvf modsecurity-crs_2.0.6.tar.gz

Besides physically storing the unarchived modsecirity-crs in your /etc/apache2 it’s also necessery to add to your Apache Ifmodule mod_security.c block of code the following two lines:

Include /etc/apache2/modsecurity-crs_2.0.6/*.conf
Include /etc/apache2/modsecurity-crs_2.0.6/base_rules/*.conf

Thus ultimately the configuration concerning ModSecurity in your Apache Server configuration should look like the following:

<IfModule mod_security2.c>
# Basic configuration options
SecRuleEngine On
SecRequestBodyAccess On
SecResponseBodyAccess Off

# Handling of file uploads
# TODO Choose a folder private to Apache.
# SecUploadDir /opt/apache-frontend/tmp/
SecUploadKeepFiles Off

# Debug log
SecDebugLog /var/log/apache2/modsec_debug.log
SecDebugLogLevel 0

# Serial audit log
SecAuditEngine RelevantOnly
SecAuditLogRelevantStatus ^5
SecAuditLogParts ABIFHZ
SecAuditLogType Serial
SecAuditLog /var/log/apache2/modsec_audit.log

# Maximum request body size we will
# accept for buffering
SecRequestBodyLimit 131072

# Store up to 128 KB in memory
SecRequestBodyInMemoryLimit 131072

# Buffer response bodies of up to
# 512 KB in length
SecResponseBodyLimit 524288
Include /etc/apache2/modsecurity-crs_2.0.6/*.conf
Include /etc/apache2/modsecurity-crs_2.0.6/base_rules/*.conf
</Ifmodule>

Once again you have to check if everything is fine with Apache configurations with:

debian-server:~# apache2ctl -t

If it’s showing once again an OK status. Then you’re ready to restart the Webserver.
debian-server:~# /etc/init.d/apache2 restart

One example goodness of setting up the ModSecurity + the Core rule sets are that after the above described installationis fully functional.

ModSecurity will be able to track if somebody tries to execute PHP Shell on your server .
ModSecurity will catch, log and block (forbid) requests to r99.txt, r59, safe0ver and possibly other hacked modifications of the php shell script

That’s it! Now Enjoy your tightened Apache Security and Hopefully catch the script kiddie trying to h4x0r yoU 🙂

Improve Website Apache Webserver SEO without Website source code moficitations with Google PageSpeed module on Debian, Ubuntu, CentOS, Fedora and SuSE Linux

Thursday, December 18th, 2014

Improve-website-apache-webserver-seo-without-website-source-code-modifications-with-Google-PageSpeed-Apache-module

For hosting companies and even personal website speed performance becomes increasingly important factor that gives higher and higher weight on overall PageRank and is one of the key things for Successful Site Search Engine Optimization (positioning) in Search Engines of a not specially SEO friendly crafted website.

Virtually all Google / Yahoo / Bing,  Yahoo  etc. Search Engines give better pagerank to websites which load faster and has little or no downtimes, for the reason a faster loading time of a website pages means better user experience and is indicator that the website is well maintained. 

Often websites deployed written for purpose of a business-es or just community CMS / Blog Website Open Source systems such as Joomla, Drupal and WordPress by default are not made to provide fantastic speed right after deploy without install of custom plugins and website tuning, i.e.:

  • Content size optimization (gzipping)
  • More efficient way to deliver CSS / Javascript (MinifyJS / CSS files into single ones
  • HTML optimization
  • Stripping (useful) page Comments
  • Adding <head> if missing on pages etc.

. Therefore as I said in many of my previous LAMP Optimization articles page  (opening) speed could make really Bad Users / Clients experience when the site grows too big or is badly optimized it gives degraded page speed times (often page loads 20 / 30 seconds waiting for the page to load!). Having Pages lagging on big information sites or EShos has both Ruining Company's Image on the market and quickly convinces the user to use another service from the already thosands available and thus drives out (potential) customers.

As Programming code maintainance and improvement is usually very costly, companies that want to save money or can't afford it (because of the shrinking budgets dictacted by the global economic crisis), the best thing to do is to ask your sysadmin to Squeeze the Best out of the WebService and Servers without major (Backend Code) infrastructural changes.

To  Speed up Apache and create Proper Page Caching without installing on server external PHP Caching modules such as Eaccelerator  / PHP APC caching and without
extra CMS modules
such as lets say WordPress W3 Total Cache there is Google Develop Apache Webserver external module – PageSpeed.

Here is Google Pagespeed Module overview :
 

PageSpeed speeds up your site and reduces page load time. This open-source webserver module automatically applies web performance best practices to pages and associated assets (CSS, JavaScript, images) without requiring that you modify your existing content or workflow.


What does Apache Google PageSpeed actually does?
 

  • Automatic website and asset optimization
  • Latest web optimization techniques
  • 40+ configurable optimization filters
  • Free, open-source, and frequently updated
  • Deployed by individual sites, hosting providers, CDNs


1. Install PageSpeed on Debian / Ubuntu, deb derivatives) Linux

a) Download and install module 

On 64 bit deb based Linux:

cd /usr/local/src
wget https://dl-ssl.google.com/dl/linux/direct/mod-pagespeed-stable_current_amd64.deb 
dpkg -i mod-pagespeed-stable_current_amd64.deb
apt-get -f install


On 32 bit Linux:

cd /usr/local/src
wget https://dl-ssl.google.com/dl/linux/direct/mod-pagespeed-stable_current_i386.deb
dpkg -i 
direct/mod-pagespeed-stable_current_i386.deb
apt-get -f install


b) Restart Apache
 

sudo /etc/init.d/apache2 restart

Important files and folders placed on server by deb installer are:

/usr/bin/pagespeed_js_minify – binary that does Javascript minification
/etc/apache2/mods-available/pagespeed.conf – Pagespeed config
/etc/apache2/mods-available/pagespeed.load – Load module directives in Apache
/etc/cron.daily/mod-pagespeed – mod_pagespeed cron script for checking and installing latest updates.
/var/cache/mod_pagespeed – Mod Pagespeed cahing folder (useful to install memcached to increase even further caching performance)
/var/log/pagespeed – Directory to store pagespeed log files


2. Install PageSpeed on (RPM based CentOS, Fedora, RHEL / SuSE Linux)


RPM 64 bit package install:
 

rpm -Uvh https://dl-ssl.google.com/dl/linux/direct/mod-pagespeed-beta_current_x86_64.rpm


32 bit pack version:
 

rpm -Uvh https://dl-ssl.google.com/dl/linux/direct/mod-pagespeed-stable_current_i386.rpm


Modify pagespeed mod config 

Restart Apache

sudo /etc/init.d/httpd restart


Important config files and folders created during RPM install are:

  • /etc/cron.daily/mod-pagespeed : mod_pagespeed cron script for checking and installing latest updates.
  • /etc/httpd/conf.d/pagespeed.conf : The main configuration file for Apache.
  • /usr/lib/httpd/modules/mod_pagespeed.so : mod_pagespeed module for Apache.
  • /var/www/mod_pagespeed/cache : File caching direcotry for web sites.
  • /var/www/mod_pagespeed/files : File generate prefix for web sites.

3. Configuring Google PageSpeed module


To configure PageSpeed you can either edit the package installed bundled pagespeed.conf (/etc/apache2/mods-available/pagspeed.conf,  /etc/httpd/conf.d/pagespeed.conf) or insert configuration items inside Apache VirtualHosts config files or even if you need flexibility and you don't have straight access to Apache config files (on shared hosting servers where module is available) through .htaccess.
Anyways try to avoid adding pagespeed directives to .htaccess as it will be too slow and inefficient.

Configuration is managed by setting different so-called "Rewrite Levels". Default behavior is to use Level of "Corefilters.", a set of filters (module behavior configs) which according to Google is safe for use. PageSpeed Filters is a set of actions applied to Web Delivered files.

Default config setting is hence:
 

ModPagespeedRewriteLevel CoreFilters

Disabling default set of filters is done with:
 

ModPagespeedRewriteLevel PassThrough

"Corefilters" default filter set as of time of writting this article:
 

add_head
combine_css
convert_jpeg_to_progressive
convert_meta_tags
extend_cache
flatten_css_imports
inline_css
inline_import_to_link
inline_javascript
rewrite_css
rewrite_images
rewrite_javascript
rewrite_style_attributes_with_url

Complete documentation on Configuring PageSpeed Filters is here.

If caching is turned on, default PageSped caching is configured in /var/cache/mod_pagespeed/
Enabling someof the non-Corefilters that sometimes are useful for SEO (reduce of served / returned pagesize) are:
 

ModPagespeedEnableFilters pedantic,remove_comments

By default pagespeed does some things (such as inline_css, inline_javascript and rewrite_images (Optimize, removing Excess pixels).  My litle experience with pagespeed shows in some cases this could break websites), so I found for my case useful to disable some of the filters:


vim /etc/apache2/mods-available/pagespeed.conf


ModPagespeedDisableFilters rewrite_images,convert_jpeg_to_progressive,inline_css,inline_javascript


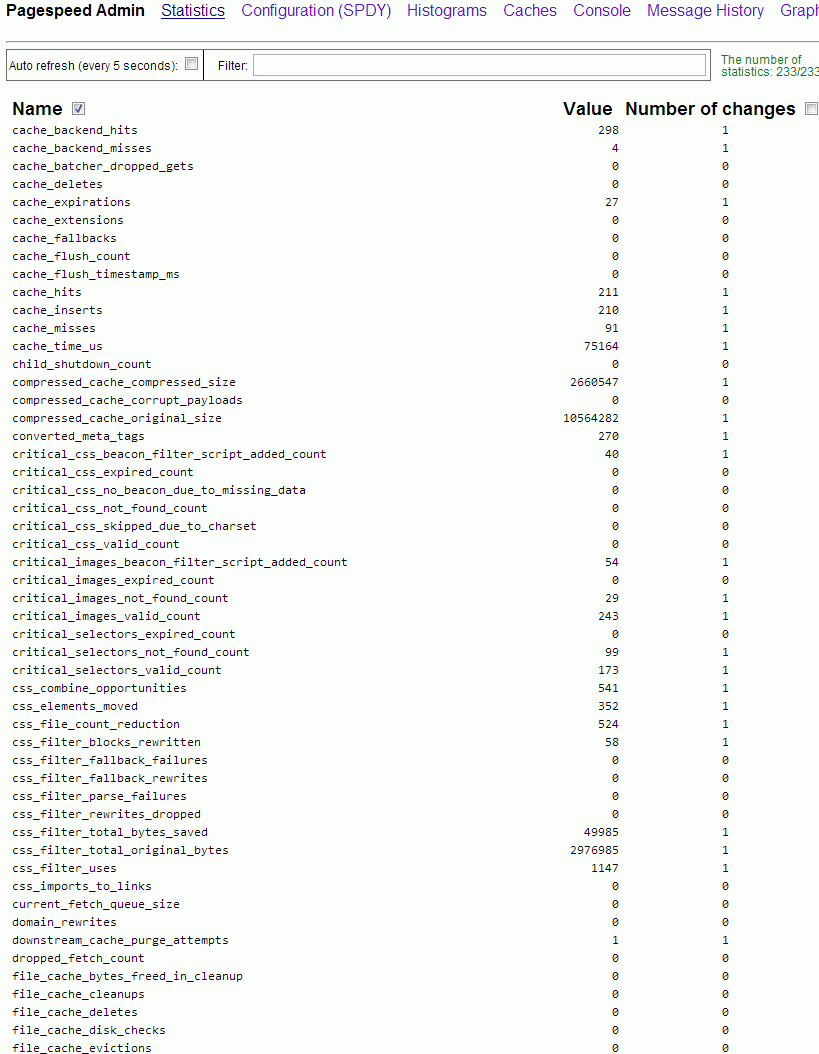
4. Testing if PageSpeed is Enabled pagespeed_admin

By default PageSpeed has Admin which by default is only allowed to be accessed from server localhost (127.0.0.1) to get basic statistics either install text browser like lynx / elinks or add more access IPs again in pagespeed config / vhosts pagespeed.conf include more Allow lines like below:


    <Location /pagespeed_admin>
        Order allow,deny
        Allow from localhost
        Allow from 127.0.0.1
        Allow from 192.168.1.1
        Allow from xxx.xxx.xxx.xxx

        #Allow from All
        SetHandler pagespeed_admin
    </Location>
    <Location /pagespeed_global_admin>
        Order allow,deny
        Allow from localhost
        Allow from 127.0.0.1

        Allow from 192.168.1.1
        Allow from xxx.xxx.xxx.xxx
        SetHandler pagespeed_global_admin
    </Location>


Once configured pagespeed_admin access it with favourite browser on:

http://127.0.0.1/pagespeed_admin
http://127.0.0.1/pagespeed_global_admin

improve-website-apache-webserver-seo-without-source-code-modifications-google-pagespeed_admin_panel

Other way to test it is enabled is by creating php file with good old <? phpinfo(); ?> – PHP stats enabled / disabled features code:

pagespeed-in-phpinfo-x-mod-pagespeed-output-screenshot-apache-webserver

I've also tested also pagespeed unstable release, but experienced some segmentation faults in both error.log and access.log so finally decided to keep using stable release.

PageSpeed is a great way to boost your server sites performance, however it comes on certain costs as expect your server CPU Load to jump drastically, (in my case it jumped more than twice), there are Linux servers where enabling the module could totally stone the servers, so before implementing the module on a Production system environment, always first test thouroughfully with loaded pagespeed on UAT (testing) environment with AB or Siege (Apache Benchmarking Tools).