Posts Tagged ‘report’

Get dmesg command kernel log report with human date / time timestamp on older Linux distributions

Friday, June 18th, 2021

how-to-get-dmesg-human-readable-timestamp-kernel-log-command-linux-logo

If you're a sysadmin you surely love to take a look at dmesg kernel log output. Usually on many Linux distributions there is a setup that dmesg keeps logging to log files /var/log/dmesg or /var/log/kern.log. But if you get some inherited old Linux servers it is quite possible that the previous machine maintainer did not enable the output of syslog to get logged in /var/log/{dmesg,kern.log,kernel.log}  or even have disabled the kernel log for some reason. Even though that in dmesg output you might find some interesting events reporting issues with Hard drives on its way to get broken / a bad / reads system processes crashing or whatever of other interesting information that could help you prevent severe servers downtimes or problems earlier but due to an old version of Linux distribution lets say Redhat 5 / Debian 6 or old CentOS / Fedora, the version of dmesg command shipped does not support the '-T' option that is present in util-linux package shipped with newer versions of  Redhat 7.X  / 8.X / SuSEs etc.  

 -T, –ctime
              Print human readable timestamps.  The timestamp could be inaccurate!

To illustrate better what I mean, here is an example from the non-human readable timestamp provided by older dmesg command

root@web-server~:# dmesg |tail -n 5
[4505913.361095] hid-generic 0003:1C4F:0002.000E: input,hidraw1: USB HID v1.10 Device [SIGMACHIP USB Keyboard] on usb-0000:00:1d.0-1.3/input1
[4558251.034024] Process accounting resumed
[4615396.191090] r8169 0000:03:00.0 eth1: Link is Down
[4615397.856950] r8169 0000:03:00.0 eth1: Link is Up – 100Mbps/Full – flow control rx/tx
[4644650.095723] Process accounting resumed

Thanksfully using below few lines of shell or perl scripts the dmesg -T  functionality could be added to the system , so you can easily get the proper timestamp out of the obscure default generated timestamp in the same manner as on newer distros.

Here is how to do with it with bash script:

#!/bin/sh paste in .bashrc and use dmesgt to get human readable timestamp
dmesg_with_human_timestamps () {
    FORMAT="%a %b %d %H:%M:%S %Y"


    now=$(date +%s)
    cputime_line=$(grep -m1 "\.clock" /proc/sched_debug)

    if [[ $cputime_line =~ [^0-9]*([0-9]*).* ]]; then
        cputime=$((BASH_REMATCH[1] / 1000))
    fi

    dmesg | while IFS= read -r line; do
        if [[ $line =~ ^\[\ *([0-9]+)\.[0-9]+\]\ (.*) ]]; then
            stamp=$((now-cputime+BASH_REMATCH[1]))
            echo "[$(date +”${FORMAT}” –date=@${stamp})] ${BASH_REMATCH[2]}"
        else
            echo "$line"
        fi
    done
}

Copy the script somewhere under lets say /usr/local/bin or wherever you like on the server and add into your HOME ~/.bashrc some alias like:
 

alias dmesgt=dmesg_with_timestamp.sh


You can get a copy dmesg_with_timestamp.sh of the script from here

Or you can use below few lines perl script to get the proper dmeg kernel date / time


#!/bin/perl
# on old Linux distros CentOS 6.0 etc. with dmesg (part of util-linux-ng-2.17.2-12.28.el6_9.2.x86_64) etc. dmesg -T not available
# workaround is little pl script below
dmesg_with_human_timestamps () {
    $(type -P dmesg) "$@" | perl -w -e 'use strict;
        my ($uptime) = do { local @ARGV="/proc/uptime";<>}; ($uptime) = ($uptime =~ /^(\d+)\./);
        foreach my $line (<>) {
            printf( ($line=~/^\[\s*(\d+)\.\d+\](.+)/) ? ( “[%s]%s\n", scalar localtime(time – $uptime + $1), $2 ) : $line )
        }'
}


Again to make use of the script put it under /usr/local/bin/check_dmesg_timestamp.pl

alias dmesgt=dmesg_with_human_timestamps

root@web-server:~# dmesgt | tail -n 20

[Sun Jun 13 15:51:49 2021] usb 2-1.3: USB disconnect, device number 9
[Sun Jun 13 15:51:50 2021] usb 2-1.3: new low-speed USB device number 10 using ehci-pci
[Sun Jun 13 15:51:50 2021] usb 2-1.3: New USB device found, idVendor=1c4f, idProduct=0002, bcdDevice= 1.10
[Sun Jun 13 15:51:50 2021] usb 2-1.3: New USB device strings: Mfr=1, Product=2, SerialNumber=0
[Sun Jun 13 15:51:50 2021] usb 2-1.3: Product: USB Keyboard
[Sun Jun 13 15:51:50 2021] usb 2-1.3: Manufacturer: SIGMACHIP
[Sun Jun 13 15:51:50 2021] input: SIGMACHIP USB Keyboard as /devices/pci0000:00/0000:00:1d.0/usb2/2-1/2-1.3/2-1.3:1.0/0003:1C4F:0002.000D/input/input25
[Sun Jun 13 15:51:50 2021] hid-generic 0003:1C4F:0002.000D: input,hidraw0: USB HID v1.10 Keyboard [SIGMACHIP USB Keyboard] on usb-0000:00:1d.0-1.3/input0
[Sun Jun 13 15:51:50 2021] input: SIGMACHIP USB Keyboard Consumer Control as /devices/pci0000:00/0000:00:1d.0/usb2/2-1/2-1.3/2-1.3:1.1/0003:1C4F:0002.000E/input/input26
[Sun Jun 13 15:51:50 2021] input: SIGMACHIP USB Keyboard System Control as /devices/pci0000:00/0000:00:1d.0/usb2/2-1/2-1.3/2-1.3:1.1/0003:1C4F:0002.000E/input/input27
[Sun Jun 13 15:51:50 2021] hid-generic 0003:1C4F:0002.000E: input,hidraw1: USB HID v1.10 Device [SIGMACHIP USB Keyboard] on usb-0000:00:1d.0-1.3/input1
[Mon Jun 14 06:24:08 2021] Process accounting resumed
[Mon Jun 14 22:16:33 2021] r8169 0000:03:00.0 eth1: Link is Down
[Mon Jun 14 22:16:34 2021] r8169 0000:03:00.0 eth1: Link is Up – 100Mbps/Full – flow control rx/tx
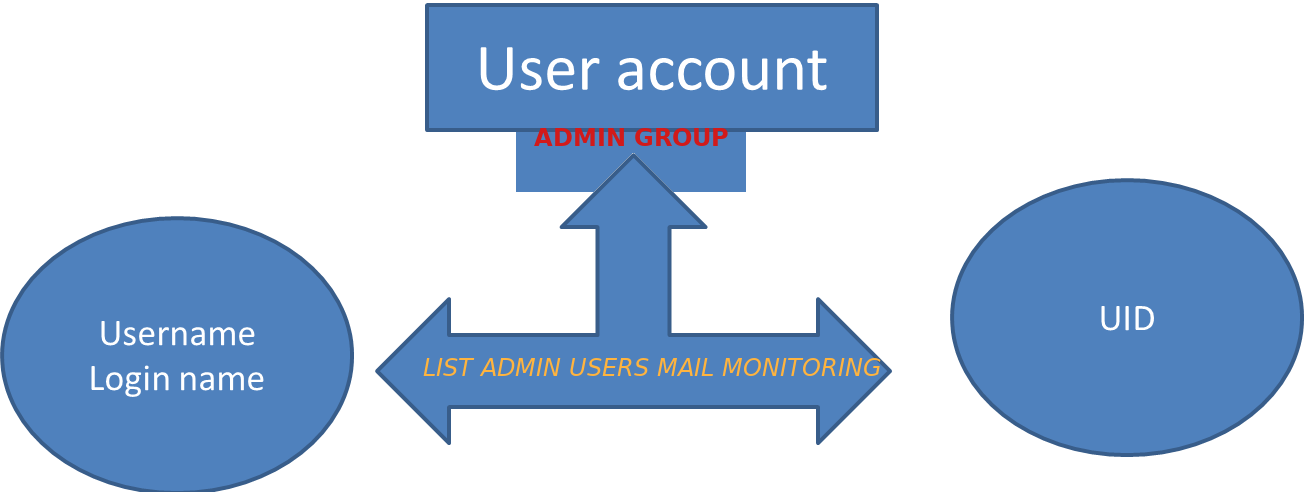
List all existing local admin users belonging to admin group and mail them to monitoring mail box

Monday, February 8th, 2021

local-user-account-creation-deletion-change-monitor-accounts-and-send-them-to-central-monitoring-mail

If you have a bunch of servers that needs to have a tight security with multiple Local users superuser accounts that change over time and you need to frequently keep an have a long over time if some new system UNIX local users in /etc/passwd /etc/group has been added deleted e.g. the /etc/passwd /etc/group then you might have the task to have some primitive monitoring set and the most primitive I can think of is simply routinely log users list for historical purposes to a common mailbox over time (lets say 4 times a month or even more frequently) you might send with a simple cron job a list of all existing admin authorized users to a logging sysadmin mailbox like lets say:
 

Local-unix-users@yourcompanydomain.com


A remark to make here is the common sysadmin practice scenario to have local existing non-ldap admin users group members of whom are authorized to use sudo su – root via /etc/sudoers  is described in my previous article how to add local users to admin group superuser access via sudo I thus have been managing already a number of servers that have user setup using the above explained admin group.

Thus to have the monitoring at place I've developed a tiny shell script that does check all users belonging to the predefined user group dumps it to .csv format that starts with a simple timestamp on when user admin list was made and sends it to a predefined email address as well as logs sent mail content for further reference in a local directory.

The task is a relatively easy but since nowadays the level of competency of system administration across youngsters is declinging -that's of course in my humble opinion (just like it happens in every other profession), below is the developed list-admin-users.sh


#!/bin/bash
# dump all users belonging to a predefined admin user / group in csv format 
# with a day / month year timestamp and mail it to a predefined admin
# monitoring address
TO_ADDRESS="Local-unix-users@yourcompanydomain.com";
HOSTN=$(hostname);
# root@server:/# grep -i 1000 /etc/passwd
# username:x:username:1000:username,,,:/home/username:/bin/bash
# username1:x:username1:1000:username1,,,:/home/username1:/bin/bash
# username5:x:username1:1000:username5,,,:/home/username5:/bin/bash

ADMINS_ID='4355';
#
# root@server # group_id_ID='4355'; grep -i group_id_ID /etc/passwd
# …
# username1:x:1005:4355:username1,,,:/home/username1:/bin/bash
# username5:x:1005:4355,,,:/home/username5:/bin/bash


group_id_ID='215';
group_id='group_id';
FIL="/var/log/userlist-log-dir/userlist_$(date +"%d_%m_%Y_%H_%M").txt";
CUR_D="$HOSTN: Current admin users $(date)"; >> $FIL; echo -e "##### $CUR_D #####" >> $FIL;
for i in $(cat /etc/passwd | grep -i /home|grep /bin/bash|grep -e "$ADMINS_ID" -e "$group_id_ID" | cut -d : -f1); do \
if [[ $(grep $i /etc/group|grep $group_id) ]]; then
f=$(echo $i); echo $i,group_id,$(id -g $i); else  echo $i,admin,$(id -g $i);
fi
done >> $FIL; mail -s "$CUR_D" $TO_ADDRESS < $FIL


list-admin-users.sh is ready for download also here

To make the script report you will have to place it somewhere for example in /usr/local/bin/list-admin-users.sh ,  create its log dir location /var/log/userlist-log-dir/ and set proper executable and user/group script and directory permissions to it to be only readable for root user.

root@server: # mkdir /var/log/userlist-log-dir/
root@server: # chmod +x /usr/local/bin/list-admin-users.sh
root@server: # chmod -R 700 /var/log/userlist-log-dir/


To make the script generate its admin user reports and send it to the central mailbox  a couple of times in the month early in the morning (assuming you have a properly running postfix / qmail / sendmail … smtp), as a last step you need to set a cron job to routinely invoke the script as root user.

root@server: # crontab -u root -e
12 06 5,10,15,20,25,1 /usr/local/bin/list-admin-users.sh


That's all folks now on 5th 10th, 15th, 20th 25th and 1st at 06:12 you'll get the admin user list reports done. Enjoy 🙂

Get daily E-Mail Reports statistics on postfix Linux mail server

Tuesday, July 14th, 2020

https://www.pc-freak.net/images/Postfix-email-server-logo.svg-1

I've had today a task at work to monitor a postfix mail send and received emails (MAIL FROM / RPCT TO) and get out a simple statistics on what kind of emails are coming and going out from the Postfix SMTP on a server?

Below is shortly explained how I did it plus you will learn how you can use something more advanced to get server mail count, delivery status, errors etc. daily.
 

1. Using a simple script to process /var/log/messages

For that I made a small script to do the trick, the script simply checks mail delivery logged information from /var/log/maillog process a bit sort and logs in a separate log daily.

#!/bin/sh
# Process /var/log/maillog extract from= and to= mails sort
# And log mails to $LOGF
# Author Georgi Georgiev 14.07.2020

DATE_FORM=$(date +'%m_%d_%y_%H_%M_%S_%h_%m');
LOG='/home/gge/mail_from_to-mails';
LOGF="$LOG.$DATE_FORM.log";
CUR_DATE=$(date +'%m_%d_%y_%T');
echo "Processing /var/log/maillog";
echo "Processing /var/log/maillog" > $LOGF;
echo >>$LOGF
echo "!!! $CUR_DATE # Sent MAIL FROM: addresses: !!!" >> $LOGF;
grep -E 'from=' /var/log/maillog|sed -e 's#=# #g'|awk '{ print $8 }'|sed -e 's#<# #g' -e 's#># #g' -e 's#\,##'|sort -rn|uniq >> $LOGF;

echo "!!! $CUR_DATE # Receive RCPT TO: addresses !!!" >>$LOGF;
grep -E 'to=' /var/log/maillog|sed -e 's#=# #g'|awk '{ print $8 }'|sed -e 's#<# #g' -e 's#># #g' -e 's#\,##'|sort -rn|uniq >> $LOGF;


You can get a copy of the mail_from_to_collect_mails_postfix.sh script here.

I've set the script to run via a crond scheduled job once early in the mornthing and I'll leave it like that for 5 days or so to get a good idea on what are the mailboxes that are receiving incoming mail.

The cron I've set to use is as follows:

# crontab -u root -l 
05 03 * * *     sh /home/gge/mail_from_to.sh >/dev/null 2>&1


This will be necessery later for a Email Server planned migration to relay its mail via another MTA host.


2. Getting More Robust Postifx Mail Statistics from logs


My little script is of course far from best solution to get postfix mail statistics from logs.

If you want something more professional and you need to have a daily report on what mails sent to mail server and mails sent from the MTA to give you information about the Email delivery queue status, number of successful and failed emails from a mail sender / recipient and a whole bunch of useful info you can use something more advanced such as pflogsumm perl script to get daily / weekly monthly mail delivery statistics.

What can pflogsumm do for you ?


Pflogsumm is a log analyzer/summarizer for the Postfix MTA. It is
designed to provide an overview of Postfix activity, with just enough
detail to give the administrator a “heads up” for potential trouble
spots and fixing any SMTP and email related issues.

Pflogsumm generates summaries and, in some cases, detailed reports of
mail server traffic volumes rejected and bounced email and server
warnings, errors, and panics.

At the time of writting this article it is living on jimsun.linxnet.com just in case if pflogsumm.pl's official download location disappears at some time in future here is pflogsumm-1.1.3.tar.gz mirror stored on www.pc-freak.net

– Install pflogsumm

Use of pflogsumm is pretty straight forward, you download unarchive the script to some location such as /usr/local/bin/pflogsumm.pl  add the script executable flag and you run it to create a Postfix Mail Log statistics report for you

wget http://jimsun.linxnet.com/downloads/pflogsumm-1.1.3.tar.gz -O /usr/local/src/pflogsumm-1.1.3.tar.gz


# mkdir -p /usr/local/src/
# cd /usr/local/src/
# tar -zxvf pflogsumm-1.1.3.tar.gz
# cd pflogsumm-1.1.3/

# mv /usr/local/pflogsumm-1.1.3/pflogsumm.pl /usr/local/bin/pflogsumm
# chmod a+x /usr/local/bin/pflogsumm


That's all, assuming you have perl installed on the system with some standard modules, we're now good to go: 

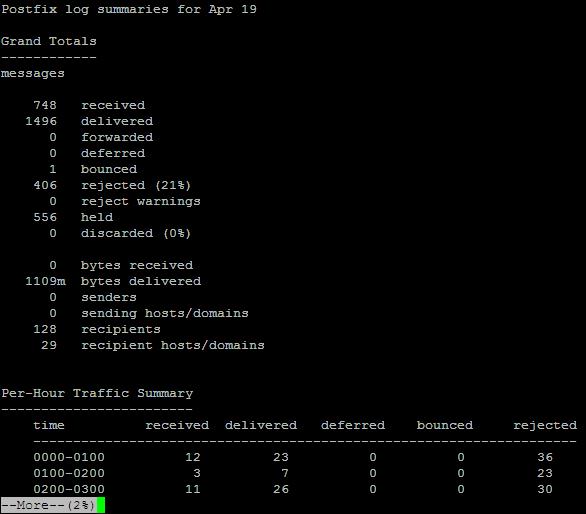
To give it a test report to the command line:

# /usr/local/bin/pflogsumm -d today /var/log/maillog

pflogsumm-log-summary-screenshot-linux-received-forwarded-bounced-rejected

To generate mail server use report and launch to some email of choice do:

# /usr/local/bin/pflogsumm -d today /var/log/maillog | mail -s Mailstats your-mail@your-domain.com


To make pflogsumm report everyday various interesting stuff such as (message deferrals, message bounce, details, smtp delivery failures, fatal errors, recipients by message size etc. add some cronjob like below to the server:

# /usr/sbin/pflogsumm -d yesterday /var/log/maillog | mail -s Mailstats | mail -s Mailstats your-mail@your-domain.com

If you need a GUI graphical mail monitoring in a Web Browser, you will need to install a webserver with a perl / cgi support,  RRDTools and MailGraph.

linux-monitoring-mail-server-with-mailgraph.cgi

Getting Console and Graphical hardware system information on Linux with cpuinfo, neofetch, CPU-X (CPU-Z Unix alternative), I-nex and inxi

Tuesday, September 17th, 2019

getting-console-information-and-graphical-hardware-system-information-Linux-cpuinfo-neofetch-cpu-x-i-nex-1

Earlier I've wrote extensive article on how to get hardware information on Linux using tools such as dmidecode, hardinfo, lshw, hwinfo, x86info and biosdecode but there are few other hardware reporting tools for Linux worthy to mention that has been there for historical reasons such as cpuinfo as we as some new shiny ones such as neofetch (a terminal / console hardware report tool as well the CPU-X and I-Nex  which is Linux equivalent to the all known almost standard for Windows hardware detection CPU-Z worthy to say few words about.
 

1. cpuinfo


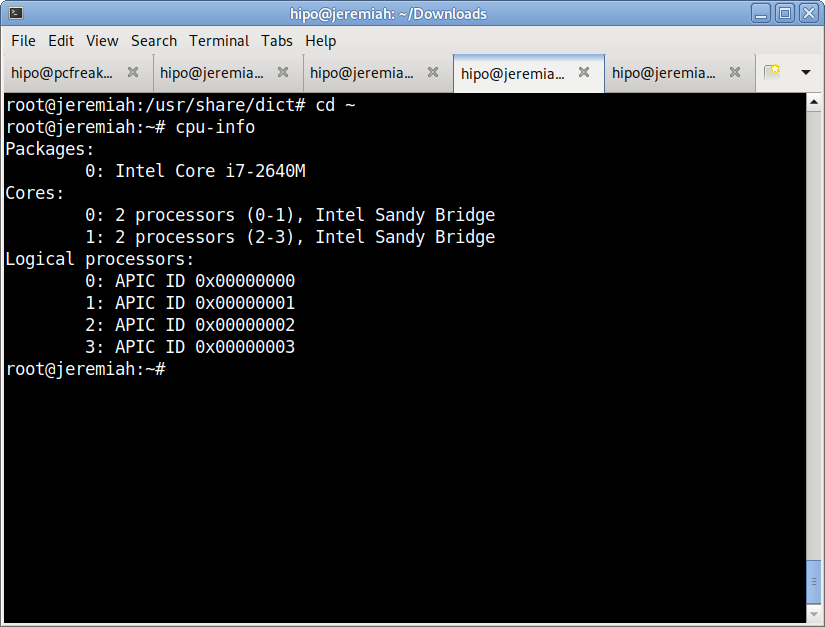
Perhaps the most basic tool to give you a brief information about your Processor type (model) number of Cores and Logical Processors is cpuinfo

I remember cpuinfo has been there since the very beginning on almost all Linux distributions's repository, nowadays its popularity of the days when the kings on the Linux OS server scenes were Slackware, Caldera OpenLinux and Redhat 6.0 Linux and Debian 3.0  declined but still for scripting purposes it is handy small proggie.

To install and run it in Debian  / Ubuntu / Mint Linux etc.:


aptitude install -y cpuinfo

/usr/bin/cpu-info


Linux-get-processor-system-info-in-console-cpu-info


2. neofetch


The next one worthy to install and check is neofetch (a cross-platform and easy-to-use system information
 command line script that collects your Linux system information and display it on the terminal next to an image, it could be your distributions logo or any ascii art of your choice.)

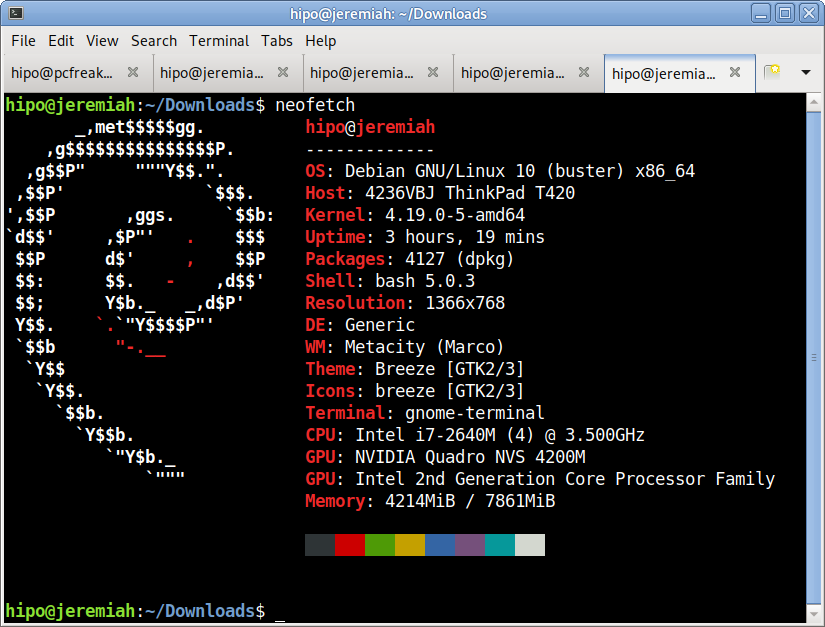
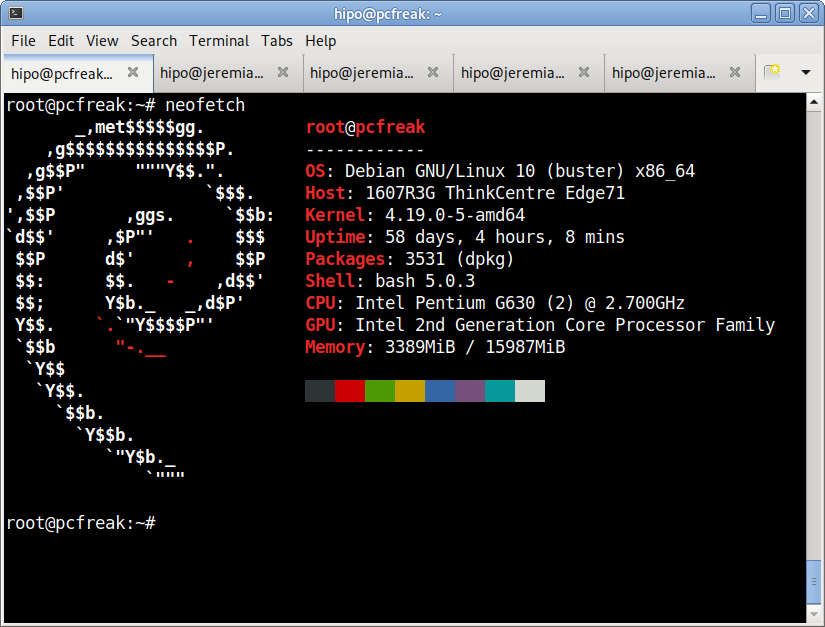
The cool thing about neofetch is besides being able to identify the System server / desktop hardware parameters, it gives some basic info about number of packages installed on the system, memory free and in use, used kernel and exact type of System (be it Dell PowerEdge Model XX, IBM eSeries Model / HP Proliant Model etc.

neofetch-OS-hardware-information-Linux-ascii-system-info-desktop-notebook

neofetch info generated on my home used Lenovo Thikpad T420

neofetch-OS-hardware-information-Linux-ascii-system-info-pcfreak-home-server
neofetch info from www.pc-freak.net running current machine

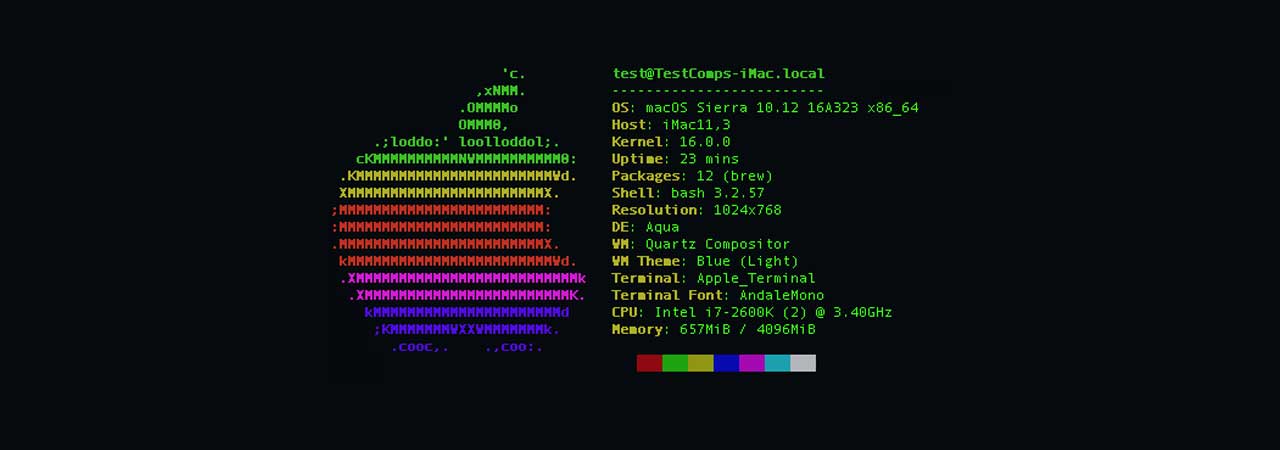
neofetch even supports Mac OS X and Windows OS ! 🙂

To install neofetch on Mac OS X:
 

/usr/bin/ruby -e "$(curl -fsSL https://raw.githubusercontent.com/Homebrew/install/master/install)"


or via Mac ported packages using brew

brew install neofetch


neofetch-screenshot-from-Mac-OS-X

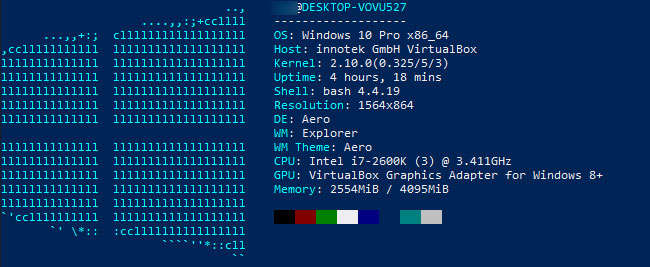
neofetch is even installable on Windows OS that has the scoop command line installer tool installer manager with below PowerShell code in cmd.exe (Command line):

powershell Set-ExecutionPolicy RemoteSigned -scope CurrentUser
iex (new-object net.webclient).downloadstring('https://get.scoop.sh')
scoop install git
scoop install neofetch

neofetch-microsoft-windows-hardware-command-line-report-tool-screenshot


By the way Scoop was quite a finding for me and it is pretty handy to install plenty of useful command line Linux / UNIX tools, such as curl, wget, git etc. in the same easy straight forward way as a standard yum or apt-get on Windows (without explicitly installing things as GnuWin and CygWin).
 

3. CPU-X graphical user interface hardware report Linux GUI alternative to Windows CPU-Z


The packages for CPU-X are a bit outdated and even though there are rpm packages for Fedora, OpenSuSE and .deb package for Debian for Debian, Ubuntu and ArchLinux (pacman), there is no up to date version for Debian 10 and the package builds distributed for different Linux distros are a bit outdated.

Thus to install CPU-X on any Linux distribution it is perhaps best to use the portable version (static binary) of CPU-X.
It is currently available on https://github.com/X0rg/CPU-X/releases

To install latest portable version of CPU-X

wget https://github.com/X0rg/CPU-X/releases/download/v3.2.4/CPU-X_v3.2.4_portable.tar.gz

mkdir CPU-X
cd CPU-X

tar -zxvvf CPU-X_v3.2.4_portable.tar.gz
-rwxr-xr-x yohan/users 4563032 2019-01-13 22:15 CPU-X_v3.2.4_portable.bsd64
-rwxr-xr-x yohan/users 5484968 2019-01-13 22:15 CPU-X_v3.2.4_portable.linux64


cp -rpf CPU-X_v3.2.4_portable.linux64 /usr/local/bin/
ln -sf /usr/local/bin/CPU-X_v3.2.4_portable.linux64 /usr/local/bin/cpu-x


Next run as superuser (root)
 

hipo@jeremiah:~$ su -c 'cpu-x'


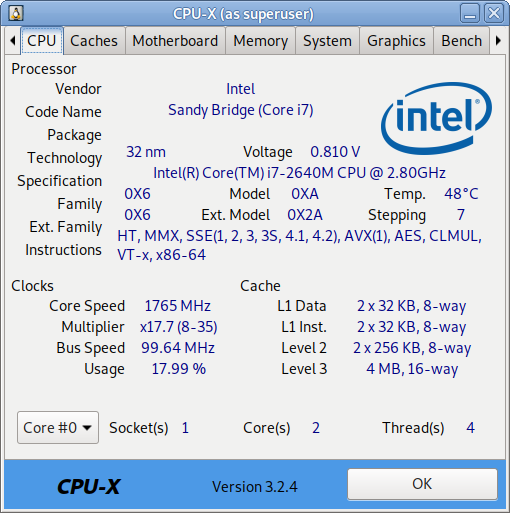
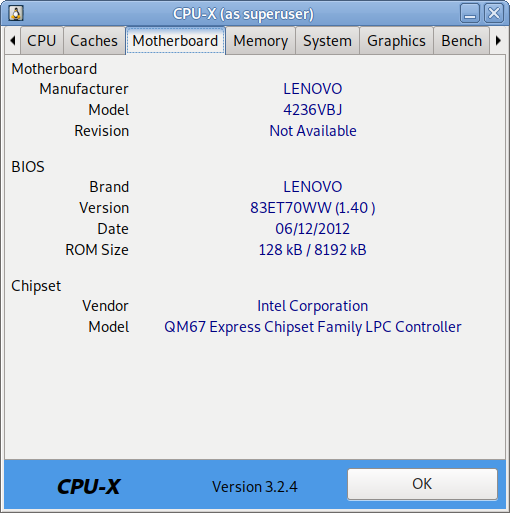
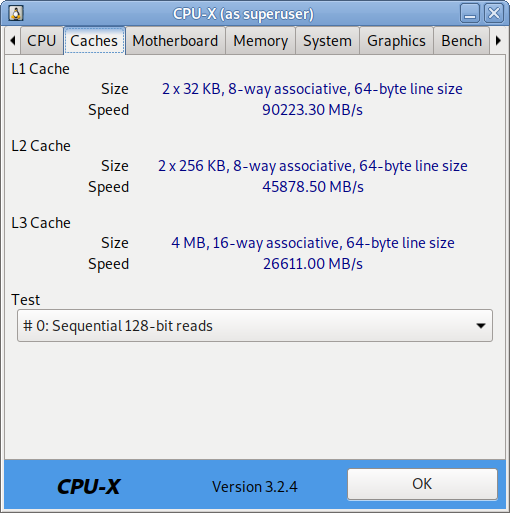
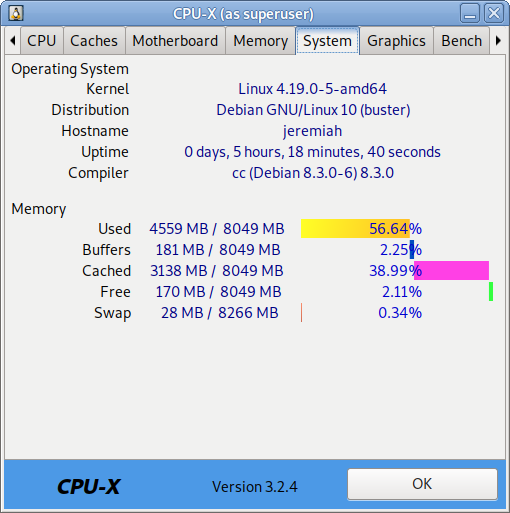
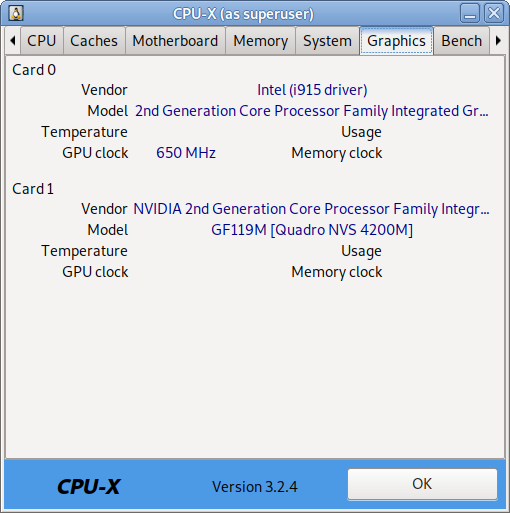
As seen from below screenshots cpu-x reports a lot of concrete specific hardware data on:

  • Processor
  • Motherboard
  • Memory
  • System
  • Graphic card
  • Performance

cpu-x-cpu-cpu-z-alternative-linux-screenshot-CPU-info

cpu-x-cpu-cpu-z-alternative-linux-screenshot-caches-info

cpu-x-cpu-cpu-z-alternative-linux-screenshot-Motherboard-info

cpu-x-cpu-cpu-z-alternative-linux-screenshot-memory-info

cpu-x-cpu-cpu-z-alternative-linux-screenshot-system-info

cpu-x-cpu-cpu-z-alternative-linux-screenshot-graphics-info

CPU-X can be installed also on FreeBSD very easily by just installing from BSD port tree sysutils/cpu-x/
It is also said to work on other *BSDs, NetBSD, OpenBSD Unixes but I guess this will require a manual compilation based on FreeBSD's port Makefile.

4. I-Nex another GUI alternative to CPU-Z for UNIX / Linux

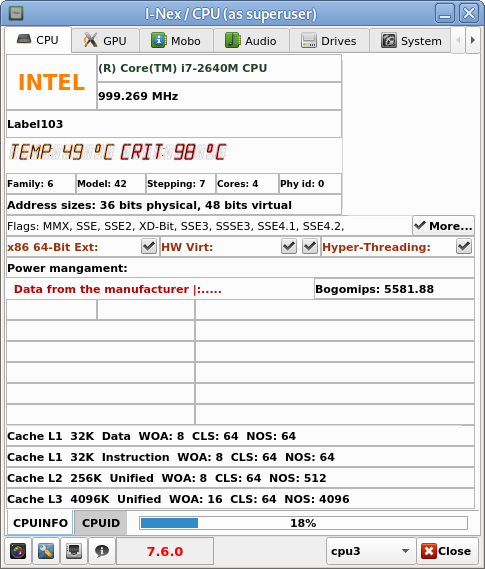
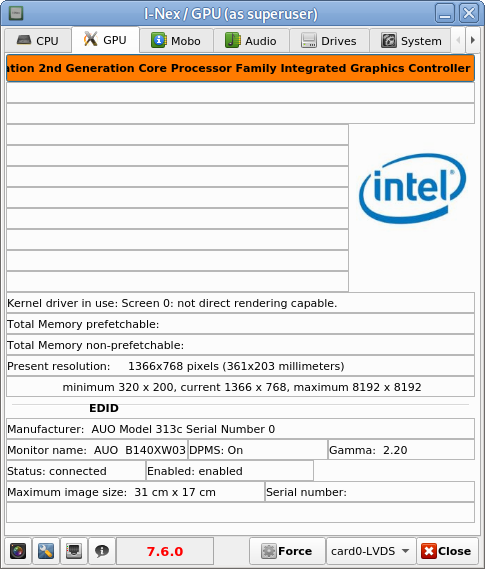
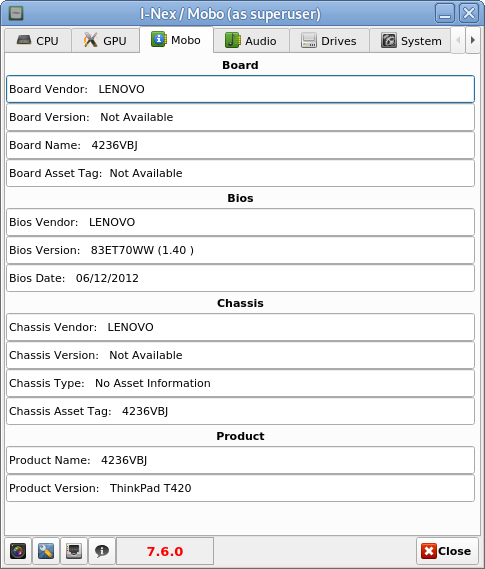
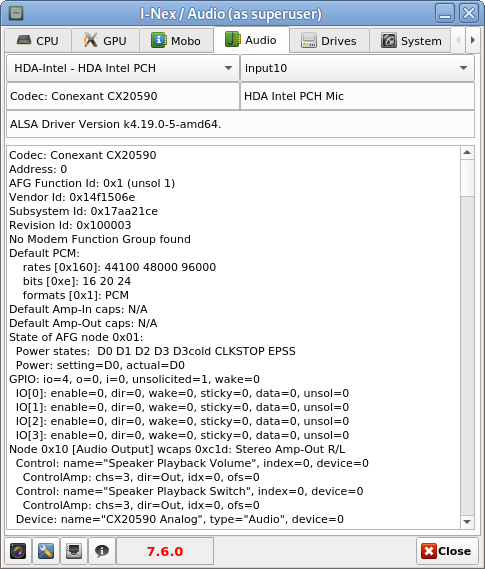
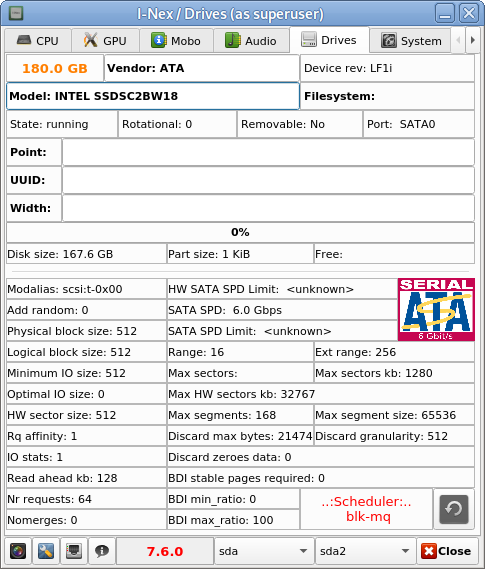
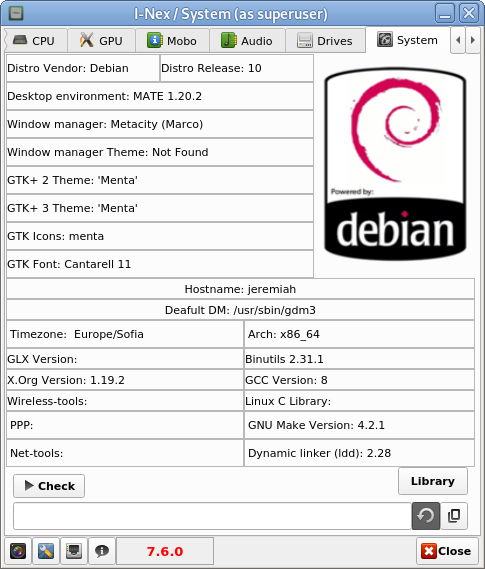
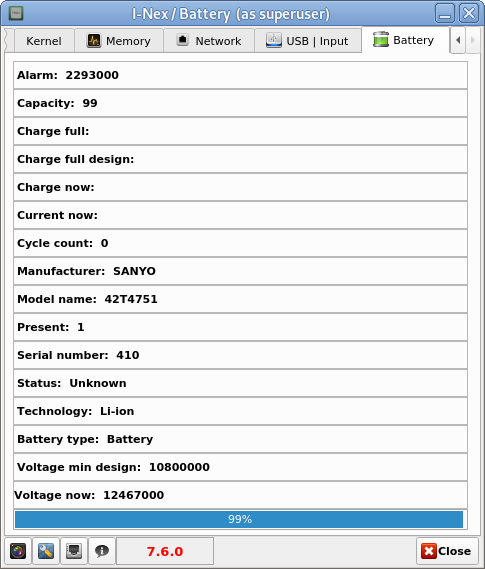
I-Nex is even more useful for general hardware reporting as it reports many hardware specifications not reported by CPU-X such as Battery type and Model Name  (if the hardware report is on a laptop), info on USB devices slots or plugged USB devices brand and specifications, the available Network devices on the system (MAC Addresses) of each of it, Installed and used drivers on Hard Disk (ATA / SATA / SCSI / SSD), HW Sector size, Logical Block size, HDD Sectors count and other specific Hard Drive data as well as information on available Audio (Sound Blaster) devices (HDA-Intel), used Codecs, loaded kernel ALSA driver, Video card used and most importantly indicators on Processor reported CPU (temperature).


To install I-nex

Go to https://launchpad.net/i-nex or any of the mirror links where it resides and install the respective package, in my case, I was doing the installation on Debian Linux, so fetched current latest amd64 package which as of moment of writting this article is i-nex_7.6.0-0-bzr977-20161012-ubuntu16.10.1_amd64.deb , next installed it with dpkg
 

dpkg -i i-nex_7.6.0-0-bzr977-20161012-ubuntu16.10.1_amd64.deb


As the package was depending on some other .deb packages, which failed to install to install the missing ones I had to further run
 

apt –fix-broken install

i-nex-cpu-info-linux-hardware-info-program


hre

I-Nex thermal indicators about CPU temperature on a Linux Desktop notebook

i-nex-gpu-info-linux-hardware-info-program

i-nex-mobo-info-linux-hardware-info-program

i-nex-audio-info-linux-hardware-info-program

i-nex-drivers-info-linux-hardware-info-program

i-nex-system-info-linux-hardware-info-program

i-nex-battery-info-linux-hardware-info-program


There are other Hardware identification report tools such as CUDA-Z that are useful to check if you have Nvidia Video Card hardware Installed on the PC to check the status of CUDA enabled GPUs, useful if working with nVidia Geforce, Quadro, Tesla cards and ION chipsets.

If you use it however be aware that CUDA-Z is not compatible with 3rd-party linux drivers for NVidia so make sure you have the current official Nvidia version.


5. Inxi full featured system information script


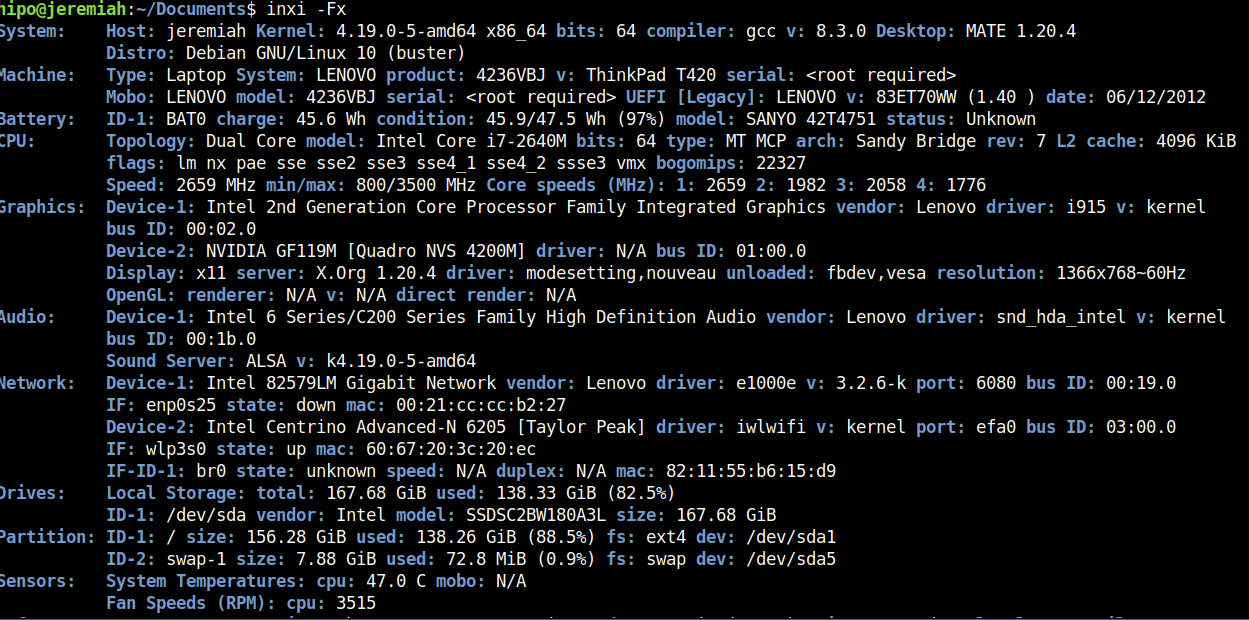
Inxi is a 10000 lines mega bash script that fetches hardware details from multiple different sources in /proc /sys and from commands on the system, and generates a beautiful looking console report that non technical users can read easily.

inxi-10-k-mega-bash-shell-script-reporting-on-installed-system-computer-hardware


inxi -Fx


inxi-report-on-installed-hardware-on-my-lenovo-thinkpad-home-laptop

Each of the pointed above tools has different method of collection of Hardware information from various resources e.g. – kernel loaded modules, dmesg, files like /proc/meminfo /proc/version /proc/scsi/scsi /proc/partitions.
Hence some of the tools are likely to report more info than otheres, so in case if some information you need regarding the system plugged in hardware is missing you can perhaps obtain it from another program. Most Linux distribution desktop provided GNOME package are including Hardinfo gui tool, but in many cases above mentioned tools are likely to add even more on info on what is inside your PC Box.
If you're aware of others tools that are useful not mentioned here please share it.

Why saint George is depicted on icons killing a Dragon (an ancient story of saint George killing the last dragon) – A Collection of 7 icons of Saint Martyr George

Friday, July 6th, 2012

saint_Georgios-killing-the-dragon-in-cave
Saint George is one of the most venerated Orthodox Christian saints in the Eastern Orthodox Church. My interest in saint George is cause of the reason, I myself bear the name Georgi (the Bulgarian equivalent of George). Saint George is mostly venerated in the Slavonic Christian-dome.In almost all Church icons depicting st. George in Orthodox and Roman Catholic christiandome saint George is piercing killing a dragon.
One of the reasons, st. George is depicted piercing the dragon is a reference of st. George victory over satan, through his martyrdom.

The Beast (Dragon) on the iconi is a straight reference to the Holy Bible; Chapter Revelation also known under the name Apocalypse.

In revelation, we read humanity and our saviour Jesus Christ will finally once and for all will kill the "ancient beast" = (satan)

In same logic, as Saint Martyr George has been victorious over Satan by his unshakable confession of faith in Jesus Christ in early 5th century A.D. , we believe in the Orthodox Church he is given the crown of (eternal) life as a prize for bearing un-human tortures in the name of the of Christ.

To illustrate visually the victory of saint George over Satan through his immesurable faith confession with which he become, there is a an early tradition in iconography in the Church to depict st. George killing a dragon.

The other reason why saint George is depicted to kill a Dragon is due to a Lebanon / Palestinian ancient story saying; There was a huge Dragon living somewhere in nowdays Lebanon / Palestinian lands.
The beast created a huge havoc killing many people and systematically torturing people in the area.

As the Eastern Orthodox Christian tradition continues …. the Dragon is said to have inhabited one of the caves near some village.
Interesting, the story tells these very same dragon was the last Dragon crawling the earth before the final disappearance of dragons.

Many brave local people tried to kill the beast but many died as the beast was unbeatable.
Being unable to beat-up the dragon with a physical (human) force the local population turnted to God for help – saying continously prayers to Saint George to help them defeat their dragon mischief.

Soon after, Saint George appeared on a white horse and pierced the "old dragon / snake". The dragon liberation miracle is said to be evidenced by local people and according to Orthodox monk books is one of the many great miracles occuring in past times.
The report of the miracle has quickly spread around all Lebanon / Palestinian lands and soon, being confirmed as real spread along all Russia as well as the rest of the Slavonic and Orthodox Christian world (Bulgaria, Serbia), Greece, Egypt (Alexandria) etc..
To illustrate saint George's appearance miracle, monastic iconographers started depicting saint George as we see him until this very day – Riding a horse and slaughtering a monstrous beast.

Below are seven 12-th century early icons of saint Saint Great-Martyr George killing the dragon;;
I've collected the icons from various website online. Hope this collection will be blessing for all Christ brother and sisters and generally anyone reading this post:

12-th century mosaic icon of st. George the Great Martyr Xenophontos Monastery

12-th century mosaic icon of st. George the Great Martyr Xenophontos Monastery

Orthodox Christian icon saint George dated to 1130 - 1150 A.D.

Orthodox Christian icon saint George dated to 1130 – 1150 A.D.

Saint Georgius the Dragon Slayer icon XII century orth icon

Saint Georgius the Dragon Slayer icon XII century orth icon

St. George Enamel icon Georgia 12th century

St. George Enamel icon Georgia 12th century

saint George Christian icon Yuriev Monastery Novgorod 12th century

saint George Christian icon Yuriev Monastery Novgorod 12th century

st. George Staraya Ladoga Orthodox Christian icon

st. George Staraya Ladoga Orthodox Christian icon

sv. Georgius 12th century Aios

sv. Georgius 12th century Aios

Nowdays saint George Holy Relics particles are kept for veneration in many Orthodox Christian countries monasteries. Here in Bulgaria saint George Holy Relics are kept in a Monastery nearby the seacoast in Pomorie. Any Christian visiting Bulgaria have the opportunity to venerate the Holy in (Pomorie's Monastery – St. Great Martyr Georgi.
 

Fix “Secure Connection Failed” – An error occured SSL received a record that exceeded the maximum permissible length howto

Monday, September 14th, 2015

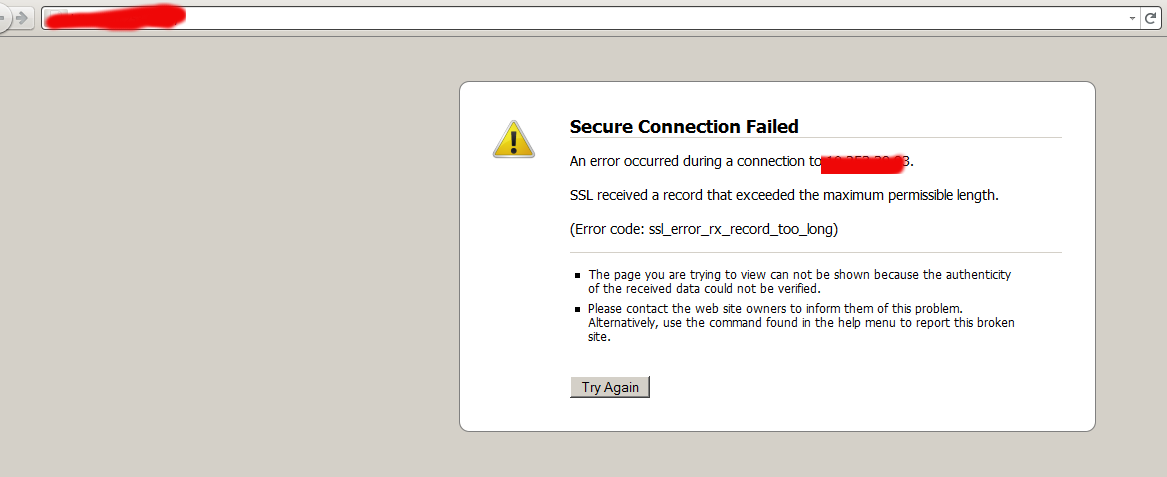
secure-connection-failed-an-error-occured-during-connection-ssl-received-a-record-that-exceeds-the-maximum-permissible-length-fix-howto
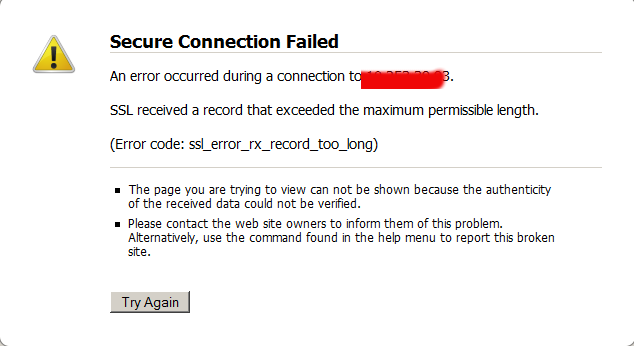
When I was trying to establish a new Internal Business SSL certificate on one of the 6 months planned SPLIT projects (e.g. duplicate a range systems environment to another one), I've stumbled a very odd SSL issue. Once I've setup all the virtualhost SSL configurations properly (identical SSL configuration directives and Apache Webserver version to another host and testing in a browser I was getting the following error:
 

Secure Connection Failed

An error occurred during a connection to 10.253.39.93.

SSL received a record that exceeded the maximum permissible length.

(Error code: ssl_error_rx_record_too_long)


Below is a screenshot:

https://www.pc-freak.net/images/secure-connection-failed-an-error-occured-during-connection-ssl-received-a-record-that-exceeds-the-maximum-permissible-length.png

The page you are trying to view can not be shown because the authenticity of the received data could not be verified. Please contact the web site owners to inform them of this problem. Alternatively, use the command found in the help menu to report this broken site.

The first logical thing to do was to check the error.log but there was no any errors there that point me to anything meaningful, besides that the queries I was making to the Domain doesn't show off as requests neither in Apache access.log nor in error.log so this was puzzling.
I thought I might have messed up something during Key file / CSR generation time so I revoked old certificate and reissued it.


$ openssl x509 -text -in test-pegasusgas-eon.intranet.eon-vertrieb.com.crt |less ertificate: Data: Version: 3 (0x2) Serial Number:

Shows that all is fine with certificate Then when trying to test remote certificate with SSL command:


openssl s_client -CApath test-pegasusgas-eon.intranet.eon-vertrieb.com.crt -connect test-pegasusgas-eon.intranet.eon-vertrieb.com:443


: There was an error After plenty of research in Google I come to conclusion something is either wrong with Listen httpd.conf directive or NameVirtualHost is binded to port 80 or some other port different from 443, however surprisingly I did not used the NameVirtualHost at all in my apache config. After a lot of pondering I finally spot it. The whole certificate isseus were caused by:

< – Less than sign

which I missaw and forget to clean up from template during IP paste (obtained from /sbin/ifconfig |grep -i xx.xx.xx.xx). So finally in order to fix the SSL error I had to just delete <, e.g.:
 

<VirtualHost <10.253.39.35:443>

had to become:


<Virtualhost 10.253.39.35:443>

Such a minor thing took me 3 hours of pondering to resolve and thanksfully it is finally fixed! Then of course had to restart Apache to make fixed Vhost settings working:
 

# apachectl stop; sleep 2; apachectl start

So now the SSL works again, thanks God!

Top AIX UNIX Performance tracking commands every Linux admin / user should know

Monday, March 16th, 2015

IBM_AIX_UNIX-Performance-Tracking-every-commands-Linux-sysadmin-and-user-should-know-AIX_logo

Though IBM AIX is basicly UNIX OS and many of the standard Linux commands are same or similar to AIX's if you happen to be a Linux sysadmin and you've been given some 100 AIX servers,  you will have to invest some time to read on AIX, however as a starter you should be aware to at least be able to do performance tracking on system to prevent system overloads. If that's the case I advise you check thoroughfully below commands documentation.

fcstat – Displays statistics gathered by the specified Fibre Channel device driver

filemon – Performance statistics for files, logical/physical volumes and virtual memory segments

fileplace – Displays the placement of file blocks within logical or physical volumes.

entstat – Displays the statistics gathered by the specified Ethernet device driver

iostat – Statistics for ttys, disks and cpu ipcs – Status of interprocess communication facilities

lsps – Statistics about paging space

netstat – Shows network status

netpmon – Performance statistics for CPU usage, network device-driver I/O, socket calls & NFS

nfsstat – Displays information about NFS and RPC calls

pagesize – Displays system page size ps – Display status of current processes

pstat – Statistics about system attributes

sar – System Activity Recorder

svmon – Captures a snapshot of the current contents of both real and virtual memory

traceroute – intended for use in network testing, measurement, and management.

tprof – Detailed profile of CPU usage by an application vmstat – Statistics about virtual memory and cpu/hard disk usage

topas – AIX euqivalent of Linux top command

Here are also useful examples use of above AIX performance tracking commands

To display the statistics for Fiber Channel device driver fcs0, enter:

fcstat fcs0

To monitor the activity at all file system levels and write a verbose report to the fmon.out file, enter:

filemon -v -o fmon.out -O all

To display all information about the placement of a file on its physical volumes, enter:

fileplace -piv data1

To display a continuous disk report at two second intervals for the disk with the logical name disk1, enter the following command:

iostat -d disk1 2

To display extended drive report for all disks, enter the following command:

iostat -D

To list the characteristics of all paging spaces, enter:

lsps -a

List All Ports (both listening and non listening ports)

netstat -a | more

The netpmon command uses the trace facility to obtain a detailed picture of network activity during a time interval.

netpmon -o /tmp/netpmon.log -O all;

netpfmon is very much like AIX Linux equivalent of tcpdump To print all of the supported page size with an alphabetical suffix, enter:

pagesize -af

To display the i-nodes of the system dump saved in the dumpfile core file

pstat -i dumpfile

To report current tty activity for each 2 seconds for the next 40 seconds, enter the following command:

sar -y -r 2 20

To watch system unit for 10 minutes and sort data, enter the following command:

sar -o temp 60 10

To report processor activity for the first two processors, enter the following command:

sar -u -P 0,1

To display global statistics for virtual memory in a one line format every minute for 30 minutes, enter the following command:

svmon -G -O summary=longreal -i 60 30

The traceroute command is intended for use in network testing, measurement, and management. While the ping command confirms IP network reachability, you cannot pinpoint and improve some isolated problems

traceroute aix1

Basic global program and thread-level summary / Reports processor usage

prof -x sleep 10

Single process level profiling

tprof -u -p workload -x workload

Reports virtual memory statistics

vmstat 10 10

To display fork statistics, enter the following command:

vmstat -f

To display the count of various events, enter the following command: vmstat -s To display the count of various events, enter the following command:

vmstat -s

To display time-stamp next to each column of output of vmstat, enter the following command:

vmstat -t

To display the I/O oriented view with an alternative set of columns, enter the following command:

vmstat -I

To display all the VMM statistics available, enter the following command:

vmstat -vs


If you already have some experience with some BSD (OpenBSD or FreeBSD) you will feel much more confortable with AIX as both operating system share common ancestor OS (UNIX System V), actually IBM AIX is U. System V with 4.3 BSD compatible extensions. As AIX was the first OS to introduce file system journalling, journalling capabilities on AIX are superb. AIX was and is still widely used by IBM for their mainframes, on IBM RS/6000 series (in 1990s), nowdays it runs fine on PowerPC-based systems and IA-64 systems.
For GUI loving users which end up on AIX try out SMIT (System Management Interface tool for AIX). AIX was using bash shell in prior versions up to AIX 3 but in recent releases default shell is Korn Shell (ksh88).
Nowdays AIX just like HP-UX and rest of commercial UNICes are loosing ground as most of functionalities is provided by commercial Linux distributions like RHEL so most of clients including Banks and big business clients are migrating to Linux.


Happy AIX-ing ! 🙂

My Business Ethics assignment at HAN (A Report on The DeepWater Horizon BP oil spill from a Business Ethics perspective)

Wednesday, November 10th, 2010

bp-logo-dripping-oil-business-ethics-assignment-report-cleaning-the-rp-pollution
For my Business Ethics module I follow at HAN (Hogelschool van Arnhem and Nijmegen – Arnhem Business School) I was assigned to work on a group project on the recent scandal of the huge oil spill caused by an accident on the DeepWater Horizon platform in the Gulf of Mexico.
In my assignment I was assigned to work of a group of 4 students initially, however after the first week one of the students decided to just quit the work group and we were left with a group of 3.

I had quite a struggle in the beginning and somewhere in the middle of the project because one of my group members were not showing on the first 2 or 3 meetings. Luckily with time that was managed and he started showing and parcipated actively and I even can say was quite happy with his input.
The guys I’ve worked on the project were: Ervan (Indonesian) and Miguel (Spanish). It took us about 4 weeks to complete the project but at the end the report become a good one.
The report was graded by the Business Ethics teachers Stephan and Silvia. The report was graded with the mark of 8.0 on the scale of 10 maximum, which btw is quite a good mark if it’s matched to the normal grading standards here in the Netherlands.

Deepwater-Horizon-oil-spill-business-ethics-perspective

The aim of the report was to define a Problem Statement based on the oil spilling issue in terms of:

1. Problem owner
2. How the problem owner should act
3. The Moral Nature of the Problem
4. Overall Problem Analysis
5. Possible options for actions to solve the BP Deepwater Horizon catastrophe
6. A cooperating strategy way as a mean to solve the Mexico Gulf contamination
7. Solution in terms of Black & White Strategy
8. Using a creative middle way solution to solve the BP problem
9. Ethivcal Evaluation
9.1 Ethical evaluation baesd on intuition
9.2 Ethical evaluation in light of Utilitarianism
9.3 Ethical evaluation of the problem according to John Stuart Mill's freedom principle
9.4 Case study in light of Kantian's categorical imperative
9.5 Case evaluation in terms of Aristotle's virtual ethics
9.6 Problem from Care Ethics perspective
10 Criticism on major ethical theories
11 Moral acceptable action to solve the BP Deepwater Horizon problem

Here I also post for download the Business Ethics report on British Petroleum in a PDF
and
Business Ethics report on Deepwater Horizon oil spill

I hope this report will be an interesting learning point for Business Ethics students for the upcoming years in Arnhem Business School and will be an example report on how to write and structure their Business Ethics group assignment reports.

What’s going around Lately

Saturday, April 19th, 2008

Nothing special. Last week went just fine thanks to the Lord ! Of Course :). It was mostly peaceful. What was interesting was a method our teacher at management choose to use to make us better understand ourselves. She said I want all of you to draw me a picture of how do you foresee yourself ten years from now :). We all was surprised but just as she requested we did draw the pictures. My picture had 4 possibly futures. In one of them I was with my wife and a kid in front of our house, on the other I was owning and leading an IT company. On one of them I was helping to get out of the terrible pit of depression, addiction to drug, alcoholism, telling them “Stop there is a reason to live, God Loves you!”. In the other case I was a Senior SysAdmin in a middle size/big company managing servers/clusters. Now we had to make a report explaining our picture. I just did make my report hope the teacher would like it. Yesterday, Bino came home and proposed to go out, we went out we saw Stoyan (who btw is a Brother in Christ). Later we saw Dancho a friend of mine (a communist). First we started a normal talk later the talk just transformed into a terrible and useless argue I did a mistake not stopping whenever I had to. And in the end we decided not to see each other because it’s bad for both of us. Later Alex (an ex class-mate) called me and we went we had a walk in the central park and talked ’bout if I can say it like this “the life, the universe, and everything else” :). The next few weeks outline to be a tough one. We are going to have a lot of exams 8 or 9 ! We had a lot of projects and assignments but still I trust on the Holy one to help me make all of them and do just fine on the exams just like he helped me the last semester and the previous year.END—–

Debian (Unstable) Squeeze / Sid /usr/lib32/alsa-lib/libasound_module_pcm_pulse.so linked to missing libraries

Thursday, September 10th, 2009

While playing with my installed programs on my recently updated Debian I stepped into a problem with /usr/lib32/alsa-lib/libasound_module_pcm_pulse.so. It seems the library was linked to two non-existing libraries: /emul/ia32-linux/lib/libwrap.so.0 as well as /emul/ia32-linux/usr/lib/libgdbm.so.3. A temporary solution to the issue is pointed out in Debian of the Debian Bug reports . As the report reads to solve that it’s required to:

1. Download libwrap0_7.6.q-18_i386.deb and libgdbm3_1.8.3-6+b1_i386.deb.

2. Extract the packages:dpkg -X libwrap0_7.6.q-18_i386.deb /emul/ia32-linux/dpkg -X libgdbm3_1.8.3-6+b1_i386.deb /emul/ia32-linux/

3. echo /emul/ia32-linux/lib >> /etc/ld.so.conf.d/ia32.conf

4. Execute /sbin/ldconfig

5. Check if all is properly linkedExecute ldd /usr/lib32/alsa-lib/libasound_module_pcm_pulse.so|grep -i “not found”Hopefully all should be fixed now.