Posts Tagged ‘rpm’

How to SSH client Login to server with password provided from command line as a script argument – Running same commands to many Linux servers

Friday, March 6th, 2015

ssh-how-to-login-with-password-provided-from-command-line-use-sshpass-to-run-same-command-to-forest-of-linux-servers

Usually admins like me who casuanlly need to administer "forests" (thousands of identicallyconfigured services Linux servers) are generating and using RSA / DSA key authentication for passwordless login, however this is not always possible as some client environments does prohibit the use of RSA / DSA non-pass authentication, thus in such environments to make routine server basic package rpm / deb upgrades or do other maintanance patching its necessery to use normal ssh user / pass login but as ssh client doesn't allow password to be provided from prompt for security reasons and therefore using some custom bash loop to issue single command to many servers (such as explained in my previous article) requires you to copy / paste password on password prompt multiple times. This works its pretty annoying so if you want to run single command on all your 500 servers with specifying the password from password prompt use sshpass tool (for non-interactive ssh password auth).

SSHPASS official site description:
 

sshpass is a utility designed for running ssh using the mode referred to as "keyboard-interactive" password authentication, but in non-interactive mode.


Install sshpass on Debian / Ubuntu (deb based) Linux

sshpass is installable right out of regular repositories so to install run:
 

apt-get install —yes sshpass


Install sshpass on CentOS / Fedora (RPM based) Linux


sshpass is available also across most RPM based distros too so just use yum package manager


yum -y install sshpass


If its not available across standard RPM distro provided repositories, there should be RPM on the net for distro just download latest one and use wget and rpm to install:

 wget -q http://dl.fedoraproject.org/pub/epel/6/x86_64/sshpass-1.05-1.el6.x86_64.rpm

 rpm -ivh sshpass-1.05-1.el6.x86_64.rpm


How Does SshPass Works?


Normally openssh (ssh) client binary uses direct TTY (/dev/tty)= an abbreviation for PhyTeleTYpewriter or (the admin jargon call Physical Console access)  instead of standard remotely defined /dev/ptsVirtual PTY.
To get around this Sshpass runs ssh in a dedicated TTY to emulate the password is indeed issues by interactive keyboard user thus  fooling remote sshd server to thinking password
is provided by interactive user.


SSHPass use

Very basic standard use which allows you to pass the password from command line is like this:
 

sshpass -p 'Your_Password_Goes_here123' ssh username@server.your-server.com


Note that the server you're working is shared with other developers they might be able to steal your username / password by using a simple process list command such as:
 

 ps auxwwef


In my case security is not a hot issue, as I'm the only user on the server (and only concern might be if someone hacks into the server 🙂 


Then assuming that you have a plain text file with all your administered servers, you can easily use sshpass in a Bash Script loop in order to run, lets say a package upgrade across all identical Linux version machines:
 

while read line; do
sshpass -p 'Your_Password_Goes_here123' ssh username@$line "apt-get update && apt-get upgrade && apt-get dist-upgrade" < /dev/null;
done < all_servers_list.txt

Change the command you like to issue across all machines with the string "apt-get …"
Above command can be used to keep up2date all Debian stable server packages. What you will do on servers is up to your imaginations, very common use of above line would be if you want to see uptime /netstat command output across all your network servers.


while read line; do
sshpass -p 'Your_Password_Goes_here123' ssh username@$line "uptime; who; netstat -tunlp; " < /dev/null;
done < all_servers_list.txt


As you can guess SshPass is swiss army knife tool for admins whoneed to automate things with scripts simultaneously across number of servers.
 

Happy SSH-ing 🙂


Monitor General Server / Desktop system health in console on Linux and FreeBSD

Tuesday, October 4th, 2011

slurm-output-monitoring-networking
saidar
is a text based ncurses program to display live statistics about general system health.

It displays in one refreshable screen (similar to top) statistics about server state of:
CPU, Load, Memory, Swap, Network, I/O disk operations
Besides that saidar supports a ncurses console colors, which makes it more funny to look at.
Saidar extracts the statistics for system state based on libgstrap cross platform statistics library about pc system health.

On Debian, Ubuntu, Fedora, CentOS Linuxes saider is available for install straight from distribution repositories.
On Debian and Ubuntu saidar is installed with cmd:

debian:~# apt-get install saidar
...

On CentOS and Fedora saidar is bundled as a part of statgrab-tools rpm package.
Installing it on 64 bit CentOS with yum is with command:

[root@centos ~]# yum install statgrab-tools.x86_64

Saidar is also available on FreeBSD as a part of the /usr/ports/devel/libgstrab, hence to use on my FreeBSD I had to install the libgstrab port:

freebsd# cd /usr/ports/devel/libstatgrab
freebsd# make install clean

Here is saidar running on my Desktop Debian on Thinkpad in color output:

debian:~# saidar -c

Saidar Linux General statistics Screenshot

I've seen many people, who use various shell scripts to output system monitoring information, this scripts however are often written to just run without efficiency in mind and they put some let's say 1% extra load on the system CPU. This is not the case with saidar which is written in C and hence the program is optimized well for what it does.

Update: Next to saidar I recommend you check out Slurm (Real Time Network Interface Monitor) it can visualizes network interface traffic using ascii graph such as on top of the article. On Debian and Ubuntu Slurm is available and easily installable via simple:
 

apt-get install –yes slurm


luckyBackup Linux GUI back-up and synchronization tool

Wednesday, May 14th, 2014

luckybackup_best-linux-graphical-tool-for-backup_linux_gui-defacto-standard-tool
If you're a using GNU / Linux  for Desktop and you're already tired of creating backups by your own hacks using terminal and you want to make your life a little bit more easier and easily automate your important files back up through GUI program take a look at luckyBackup.

Luckibackup is a GUI frontend to the infamous rsync command line backup  tool. Luckibackup is available as a package in almost all modern Linux distributions its very easy to setup and can save you a lot of time especially if you have to manage a number of your Workplace Desktop Office Linux based computers.
Luckibackup is an absolute must have program for Linux Desktop start-up users. If you're migrating from Microsoft Windows realm and you're used to BackupPC, Luckibackup is probably the defacto Linux BackupPC substitute.

The sad news for Linux GNOME Desktop users is luckibackup is written in QT and it using it will load up a bit your notebook.
It is not installed by default so once a new Linux Desktop is installed you will have to install it manually on Debian and Ubuntu based Linux-es to install Luckibackup apt-get it.

debian:~# apt-get install --yes luckibackup
...

On Fedora and CentOS Linux install LuckiBackup via yum rpm package manager

[root@centos :~]# yum -y install luckibackup
.

Luckibackup is also ported for OpenSuSE Slackware, Gentoo, Mandriva and ArchLinux. In 2009 Luckibackup won the prize of Sourceforge Community Choice Awards for "best new project".

luckyBackup copies over only the changes you've made to the source directory and nothing more.
You will be surprised when your huge source is backed up in seconds (after the first backup).

Whatever changes you make to the source including adding, moving, deleting, modifying files / directories etc, will have the same effect to the destination.
Owner, group, time stamps, links and permissions of files are preserved (unless stated otherwise).

Luckibackup creates different multiple backup "snapshots".Each snapshot is an image of the source data that refers to a specific date-time.
Easy rollback to any of the snapshots is possible. Besides that luckibackup support Sync (just like rsync) od any directories keeping the files that were most recently modified on both of them.

Useful if you modify files on more than one PCs (using a flash-drive and don't want to bother remembering what did you use last. Luckibackup is capable of excluding certain files or directories from backupsExclude any file, folder or pattern from backup transfer.

After each operation a logfile is created in your home folder. You can have a look at it any time you want.

luckyBackup can run in command line if you wish not to use the gui, but you have to first create the profile that is going to be executed.
Type "luckybackup –help" at a terminal to see usage and supported options.
There is also TrayNotification – Visual feedback at the tray area informs you about what is going on.


Installing Virtualbox Guest Additions Vboxadditions on CentOS 7, Fedora 19 / 20 and RHEL 6.5 / 5.10 on Windows host

Thursday, July 17th, 2014

Virtualbox_guest_additions-on-centos-7-howto-virtualbox-logo
If you decided to use Redhat based Linux distribution inside Virtualbox Virtual Machine on Windows 7 / 8, first thing to do right after installing the Linux guest OS is to install Virtualbox Guest Additions. Earlier I've blogged How to enable virtualbox VM Windows XP fullscreen mode on Virtualbox running on Ubuntu now I need it vice versa a Linux OS living inside Virtual Machine running on top of Windows 7 Enterprise. need to enable Full-screen mode. Another reason why Vboxadditions should be installed right after Linux install is complete is for performance reasons and better integration between host OS and guest OS. Virtualbox Guest Additions enables mouse's copy / paste functions to work between Win and Virtualized Linux as well as enables arbitrary screen resolutions (resizing VM guest window) etc. On Windows versions of Virtualbox to install Vbox Guest Additions it is no longer necessery to download and mount a separate vbox-guest-additions ISO file, this is handled by Virtualbox itself.

The steps described here for installation of VirtualBox Guest Additions are tested and prooved as working on current latest CentOS 6.5, however they should be working (with or without minor modifications) in rest of RPM based Linux distributions

Fedora 20, 19, 18, 17, 16, 15, 14, 13, 12, CentOS 6.5, 6.4, 6.3, 6.2, 6.1, 6.0, 5.10 and Redhat Enterprise Linux (RHEL) 6.5, 6.4, 6.3, 6.2, 6.1, 6, 5.10 VirtualBox version installed on Windows 7 host is 4.3.14 build.


Devices -> Drag'n'Drop (Bidirectional)

Devices -> Share Clipboard (Bidirectional)


1. Installing VirtualBox GuestAdditions on CentOS 7, Redhat, Fedora

a) become superuser

su root
[root@centos~:]#

b) Mount Virtualbox provided Guest additions into virtual cdrom /dev/cdrom

From VirtualBox click on
 

Devices -> Install Guest Additions

centos7-install-guest-additions-cd-screenshot-microsoft-windows-virtualbox

mkdir /media/VirtualBoxGuestAdditions
mount -r /dev/cdrom /media/VirtualBoxGuestAdditions

c) Update to the latest Linux kernel with yum

yum -y update kernel*

Then to boot up into the updated kernel – restart the system

shutdown -r now


d) Install Kernel headers bzip dkms bzip2

yum install -y gcc kernel-devel kernel-headers dkms make bzip2 perl

If you're installing VirtualBox Guest Additions on CentOS 6 or RHEL 5, you will have to install also below 2 rpms:
 

## CentOS 6 and Red Hat (RHEL) 5 ##
rpm -Uvh http://dl.fedoraproject.org/pub/epel/6/i386/epel-release-6-8.noarch.rpm
 
## CentOS 5 and Red Hat (RHEL) 5 ##
rpm -Uvh http://dl.fedoraproject.org/pub/epel/5/i386/epel-release-5-4.noarch.rpm


e) export KERN_DIR to just installed kernel source


For CentOS 7 export following KERN_DIR


## Current running kernel on Fedora, CentOS 7 and Red Hat (RHEL) 7 ##
KERN_DIR=/usr/src/kernels/`uname -r`
export KERN_DIR

For older CentOS and RHEL 5 export
## Current running kernel on CentOS 5 and Red Hat (RHEL) 5 ##

KERN_DIR=/usr/src/kernels/`uname -r`-`uname -m`
export KERN_DIR

f) Download VBoxAdditions 4.3.14 iso from Virtualbox website

I've made mirror of VBoxGuestAdditions_4.3.14.iso for download here:
 

mkdir /usr/share/virtualbox
cd /usr/share/virtualbox

wget http://dlc.sun.com.edgesuite.net/virtualbox/4.3.14/VBoxGuestAdditions_4.3.14.iso

g) Mount the iso
 

mount -t iso9660 VBoxGuestAdditions_4.3.14.iso /media/VirtualBoxGuestAdditions/


h) Compile and Install Virtualbox GuestAdditions kernel modules
For both 32-bit and 64-bit systems run one and the same shell script:

cd /media/VirtualBoxGuestAdditions
./VBoxLinuxAdditions.run

Verifying archive integrity… All good.
Uncompressing VirtualBox 4.3.14_RC1 Guest Additions for Linux…………
VirtualBox Guest Additions installer
Removing installed version 4.3.14_RC1 of VirtualBox Guest Additions…
Copying additional installer modules …
Installing additional modules …
Removing existing VirtualBox non-DKMS kernel modules       [  OK  ]
Building the VirtualBox Guest Additions kernel modules
Building the main Guest Additions module                   [  OK  ]
Building the shared folder support module                  [  OK  ]
Building the OpenGL support module                         [  OK  ]
Doing non-kernel setup of the Guest Additions              [  OK  ]
You should restart your guest to make sure the new modules are actually used

Installing the Window System drivers
Installing X.Org Server 1.15 modules                       [  OK  ]
Setting up the Window System to use the Guest Additions    [  OK  ]
You may need to restart the hal service and the Window System (or just restart
the guest system) to enable the Guest Additions.

Installing graphics libraries and desktop services componen[  OK  ]

l) Restart the CentOS Virtual Machine
 

reboot

Now get a beer and celebrate the full-screen / USB / Webcamera enabled support ! 🙂

This article is possible thanks to earlier article called Virtualbox guest additions on Fedora CentOS and Redhat.

http://www.if-not-true-then-false.com/2010/install-virtualbox-guest-additions-on-fedora-centos-red-hat-rhel/


Extracting pages and page ranges, protect with password and remove password from PDF on GNU / Linux with QPDF – Linux Manipulating PDF files from command line

Friday, August 8th, 2014

qpdf-logo-extract-pages-page-ranges-protect-pdf-with-password-remove-password-from-pdf-linux-qpdf-manipulating-pdf-files-on-gnu-linux-and-bsd
If're a Linux user and you need to script certain page extraction from PDF files, crypt protect with password a PDF file or decrypt (remote password protection from PDF) or do some kind of structural transformation of existing PDF file you can use a QPDF command line utility. qpdf is in active development and very convenient tool for Website developers (PHP / Perl / Python), as often on websites its necessery to write code to cut / tailer / restructure PDFs.

1. Install QPDF from deb / rpm package

qpdf is instalalble by default in deb repositories on Debian / Ubuntu GNU / (deb derivative) Linux-es to install it apt-get it

apt-get install –yes qpdf

On RPM based distribution CentOS / SuSE / RHEL / Fedora Linux to install qpdf, fetch the respective distribution binary from rpmfind.net or to install latest version of qpdf build it from source code.

2. Install QPDF from source

To build latest qpdf from source

  • on RPM based distributions install with yum fullowing packages:

yum -y install zlib-devel pcre-devel gcc gcc-c++

  • on Deb based Linuces, you will need to install

apt-get install –yes build-essential gcc dpkg-dev g++ zlib1g-dev


Then to build gather latest qpdf source from here


cd /usr/local/src
wget -q https://www.pc-freak.net/files/qpdf-5.1.2.tar.gz
tar -zxvf qpdf-5.1.2.tar.gz
cd qpdf-5.1.2/
./configure
make
make install


Once it is installed, if you get error on qpdf runtime:
 

/usr/local/bin/qpdf: error while loading shared libraries: libqpdf.so.13: cannot open shared object file: No such file or directory

To solve the error find in your compile directory libqpdf.so.13 and copy it to /usr/lib or /usr/local/lib

 cp -rpf ./libqpdf/build/.libs/libqpdf.so.13 /usr/local/lib


3. Decrypt password encrypted (protected) PDF file

if you have time and you like reading be sure to check the extensive qpdf-manual.

To remove password from a PDF file protected with a password with qpdf

qpdf –password=SECRET-PASSWORD –decrypt input-file.pdf output-file.pdf

QPDF has a vast range of split and merge features. It can combine all the files in a folder (*.pdf), you can use it to try to recover damaged pdf files, extract individual pages from PDF, dump and reverse page range, make new created PDF with old PDF's reversed pages (pages 1,2,3,4 to become in order 4,3,2,1), apply some single pdf file metadata to multiple files.

4. Try to Recover damaged PDF file


To try to recover some damaged file with qpdf:
 

qpdf file-to-repair.pdf repaired-file.pdf

5. Extract certain pages or page range from PDF

It is recommended to use the version built from source to extract certain page range from PDF
 

/usr/local/bin/qpdf –empty –pages input-file.pdf 1-5 — outfile-file.pdf


If you wanted to take pages 1–5 from file1.pdf and pages 11–15 from file2.pdf in reverse, you would run
 

qpdf file1.pdf –pages file1.pdf 1-5 file2.pdf 15-11 — outfile.pdf


Monitoring Disk use, CPU Load, Memory use and Network in one console ncurses interface – Glance

Thursday, August 14th, 2014

monitoring-disk-use-memory-cpu-load-and-network-in-one-common-interfaces-with-glances-Linux-BSD-UNIX
If you're Linux / UNIX / BSD system administrator you already have experience with basic admin's system monitoring:

  •     CPU load
  •     OS Name/Kernel version
  •     System load avarage and Uptime
  •     Disk and Network Input/Output I/O operations by interface
  •     Process statistics / Top loading processes etc.
  •     Memory / SWAP usage and free memory
  •     Mounted partitions


Such info is provided by command line tools such as:

top, df, free, sensors, ifconfig, iotop, hddtemp, mount, nfsstat, nfsiostat, dstat, uptime, nethogs iptraf

etc.

There are plenty of others advanced tools also Web based server monitoring visualization  tools, such as Monit, Icanga, PHPSysInfo, Cacti which provide you statistics on computer hardware and network utilization

So far so good, if you already are used to convenience of web *NIX based monitoring but you don't want to put load on the servers with such and you're lazy to write custom scripts that show most important monitoring information – necessery for daily system administration monitoring and prevention from downtimes and tracking bottlenecks you will be glad to hear about Glances
 

Glances is a free (LGPL) cross-platform curses-based monitoring tool which aims to present a maximum of information in a minimum of space, ideally to fit in a classical 80×24 terminal or higher to have additionnal information. Glances can adapt dynamically the displayed information depending on the terminal size. It can also work in a client/server mode for remote monitoring.


1. Installing Glances curses-based monitoring tool on Debian 7 / Ubuntu 13+ / Mint  Linux

We have to install python-pip (python package installer tool) to later install Glances

apt-get install –yes 'python-dev' 'python-jinja2' 'python-psutil'
                        'python-setuptools' 'hddtemp' 'python-pip' 'lm-sensors'


Before proceeding to install Glances to make Thermal sensors working (if supported by hardware) run:


 sensors-detect

Glances is written in Python and uses psutil library to obtain monitoring statistic values, thus it is necessery to install few more Python libraries:

pip install 'batinfo' 'pysensors'

If you're about to use pip – Python package installer tool, behind a proxy server use instead:
 

pip install –proxy=http://your-proxy-host.com:8080 'batinfo' 'pysensors'

Then install Glances script itself again using pip
 

pip install 'Glances'

Downloading/unpacking Glances
  Downloading Glances-2.0.1.tar.gz (3.3Mb): 3.3Mb downloaded
  Running setup.py egg_info for package Glances
    
Downloading/unpacking psutil>=2.0.0 (from Glances)
  Downloading psutil-2.1.1.tar.gz (216Kb): 216Kb downloaded
  Running setup.py egg_info for package psutil

Successfully installed Glances psutil


Then run glances from terminal
 

glances -t 3

-t 3 option tells glances to refresh collected statistics every 3 seconds

glances-console-monitoring-tool-every-systemad-ministrator-should-know-and-use-show-memory-disk-cpu-mount-point-statistics-in-common-shared-screen-linux-freebsd-unix


2. Installing Glances monitoring console tool on CentOS / RHEL / Fedora / Scientific Linux

Installing glances on CentOS 7 / Fedora and rest of RPM based distributions can be done by adding external RPM repositories, cause glances is not available in default yum repositories.

To enable Extra-packages repositories:
 

rpm -ivh http://dl.fedoraproject.org/pub/epel/6/x86_64/epel-release-6-8.noarch.rpm


Then update yum to include new repository's packages into package list and install python-pip and python-devel rpms
 

yum update
yum install python-pip python-devel


Glances-console-server-stateScreenhot-on-CentOS-Linux-monitoring-in-ncurses-Linux-BSD

There is also FreeBSD port to install Glances on FreeBSD:
 

cd /usr/sysutils/py-glances
make install


Enjoy 🙂 !


Text Monitoring of connection server (traffic RX / TX) business in ASCII graphs with speedometer / Easy Monitor network traffic performance

Friday, May 4th, 2012

While reading some posts online related to MS-Windows TcpViewnetwork traffic analyzing tool. I've came across very nice tool for tracking connection speed for Linux (Speedometer). If I have to compare it, speedometer is somehow similar to nethogs and iftop bandwidth network measuring utilities .

What differentiates speedometer from iftop / nethogs / iptraf is it is more suitable for visualizing a network file or data transfers.
The graphs speedometer draws are way easier to understand, than iftop graphs.

Even complete newbies can understand it with no need for extraordinary knowledge in networking. This makes Speedometer, a top tool to visually see the amount of traffic flowing through server network interface (eth0) … (eth1) etc.

What speedometer shows is similar to the Midnight Commander's (mc) file transfer status bar, except the statistics are not only for a certain file transfer but can show overall statistics over server passing network traffic amount (though according to its manual it can be used to also track individual file transfers).

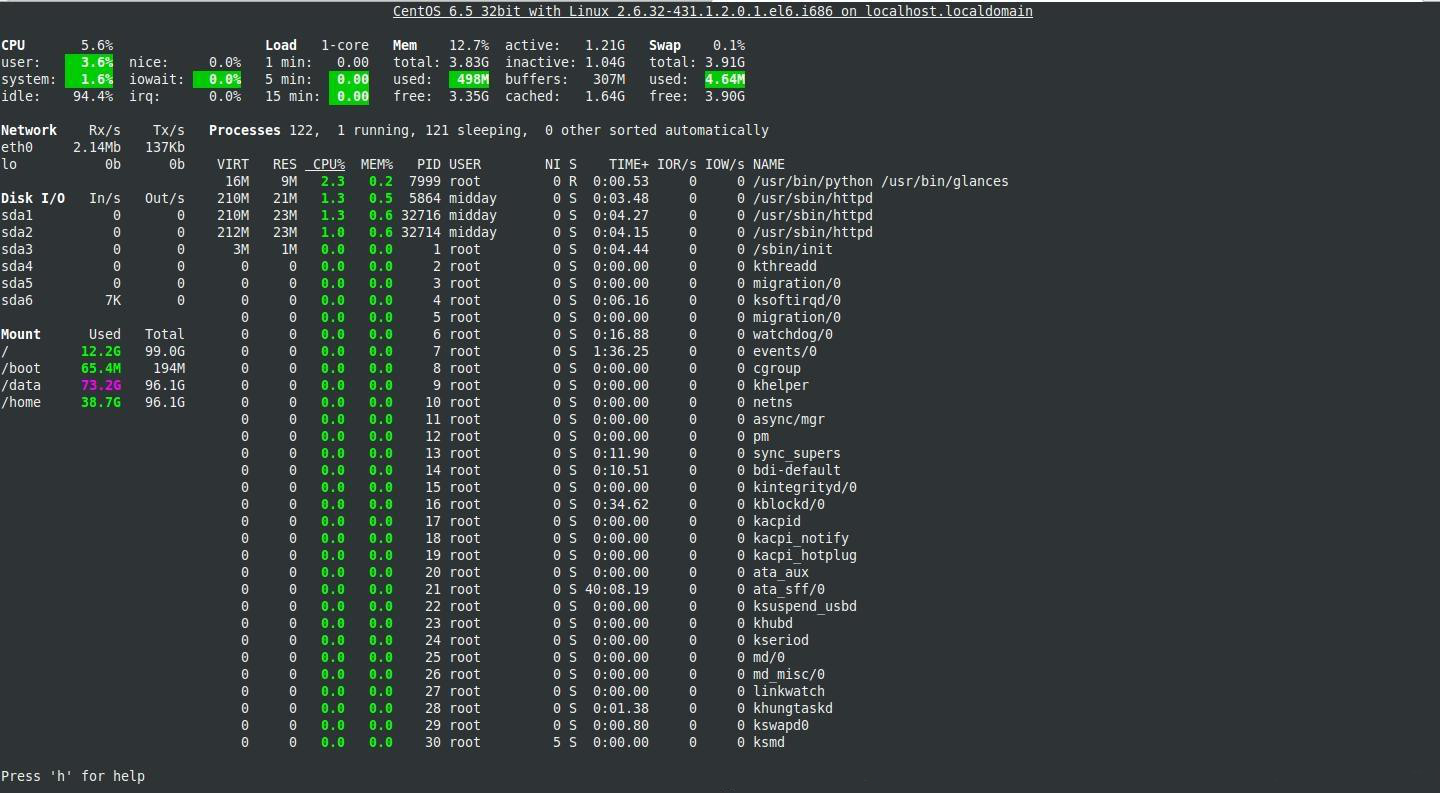
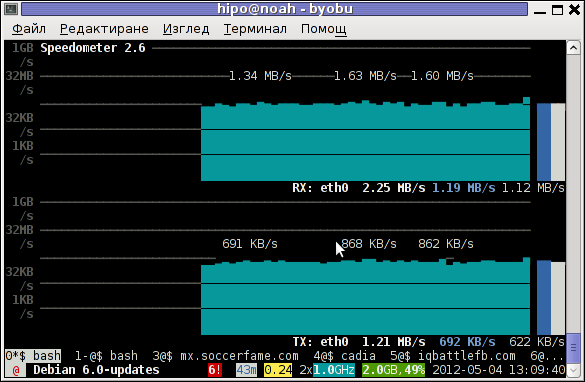
The simplicity for basic use makes speedometer nice tool to track for network congestion issues on Linux. Therefore it is a  must have outfit for every server admin. Below you see a screenshot of my terminal running speedometer on a remote server.

Speedometer ascii traffic track server network business screenshot in byobu screen like virtual terminal emulator

1. Installing speedometer on Debian / Ubuntu and Debian derivatives

For Debian and Ubuntu server administrators speedometer is already packaged as a deb so its installation is as simple as:

debian:~# apt-get --yes install speedometer
....

2. Installing speedometer from source for other Linux distributions CentOS, Fedora, SuSE etc.

Speedometer is written in python programming language, so in order to install and use on other OS Linux platforms, it is necessery to have installed (preferably) an up2date python programming language interpreter (python ver. 2.6 or higher)..
Besides that it is necessary to have installed the urwid -( console user interface library for Python) available for download via excess.org/urwid/


Hence to install speedometer on RedHat based Linux distributions one has to follow these steps:

a) Download & Install python urwid library

[root@centos ~]# cd /usr/local/src
[root@centos src]# wget -q http://excess.org/urwid/urwid-1.0.1.tar.gz
[root@centos src]# tar -zxvvf urwid-1.0.1.tar.gz
....
[root@centos src]# cd urwid-1.0.1
[root@centos urwid-1.0.1]# python setup.py install
running install
running build
running build_py
creating build
creating build/lib.linux-i686-2.4
creating build/lib.linux-i686-2.4/urwid
copying urwid/tests.py -> build/lib.linux-i686-2.4/urwid
copying urwid/command_map.py -> build/lib.linux-i686-2.4/urwid
copying urwid/graphics.py -> build/lib.linux-i686-2.4/urwid
copying urwid/vterm_test.py -> build/lib.linux-i686-2.4/urwid
copying urwid/curses_display.py -> build/lib.linux-i686-2.4/urwid
copying urwid/display_common.py -> build/lib.linux-i686-2.4/urwid
....

b) Download and install python-setuptools

python-setuptools is one other requirement of speedometer, happily on CentOS and Fedora the rpm package is already there and installable with yum:

[root@centos ~]# yum -y install python-setuptools
....

c) Download and install Speedometer

[root@centos urwid-1.0.1]# cd /usr/local/src/
[root@centos src]# wget -q http://excess.org/speedometer/speedometer-2.8.tar.gz
[root@centos src]# tar -zxvvf speedometer-2.8.tar.gz
.....
[root@centos src]# cd speedometer-2.8
[root@centos speedometer-2.8]# python setup.py install
Traceback (most recent call last):
File "setup.py", line 26, in ?
import speedometer
File "/usr/local/src/speedometer-2.8/speedometer.py", line 112
n = n * granularity + (granularity if r else 0)
^

While running the CentOS 5.6 installation of speedometer-2.8, I hit the
"n = n * granularity + (granularity if r else 0)
error.

After consultation with some people in #python (irc.freenode.net), I've figured out this error is caused due the outdated version of python interpreter installed by default on CentOS Linux 5.6. On CentOS 5.6 the python version is:

[root@centos ~]# python -V
Python 2.4.3

As I priorly said speedometer 2.8's minimum requirement for a python to be at v. 2.6. Happily there is quick way to update python 2.4 to python 2.6 on CentOS 5.6, as there is an RPM repository maintained by Chris Lea which contains RPM binary of python 2.6.

To update python 2.4 to python 2.6:

[root@centos speedometer-2.8]# rpm -Uvh http://yum.chrislea.com/centos/5/i386/chl-release-5-3.noarch.rpm[root@centos speedometer-2.8]# rpm --import /etc/pki/rpm-gpg/RPM-GPG-KEY-CHL[root@centos speedometer-2.8]# yum install python26

Now the newly installed python 2.6 is executable under the binary name python26, hence to install speedometer:

[root@centos speedometer-2.8]# python26 setup.py install
[root@centos speedometer-2.8]# chown root:root /usr/local/bin/speedometer
[root@centos speedometer-2.8]# chmod +x /usr/local/bin/speedometer

[root@centos speedometer-2.8]# python26 speedometer -i 1 -tx eth0

The -i will instruct speedometer to refresh the screen graphs once a second.

3. Using speedometer to keep an eye on send / received traffic network congestion

To observe, the amount of only sent traffic via a network interface eth0 with speedometer use:

debian:~# speedometer -tx eth0

To only keep an eye on received traffic through eth0 use:

debian:~# speedometer -rx eth0

To watch over both TX and RX (Transmitted and Received) network traffic:

debian:~# speedometer -tx eth0 -rx eth0

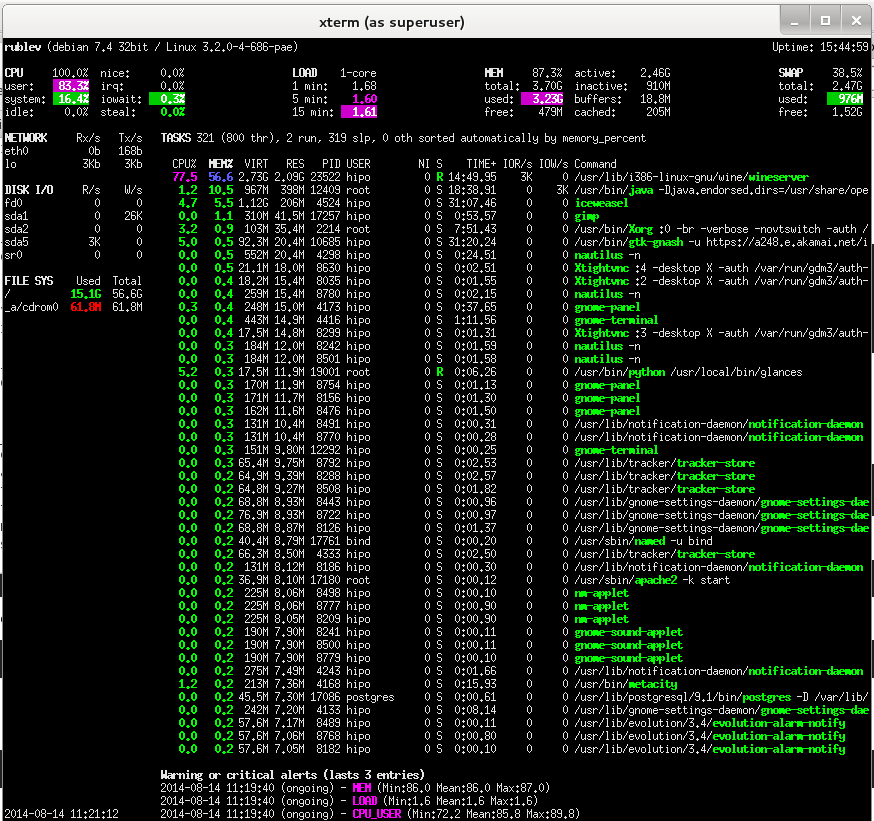
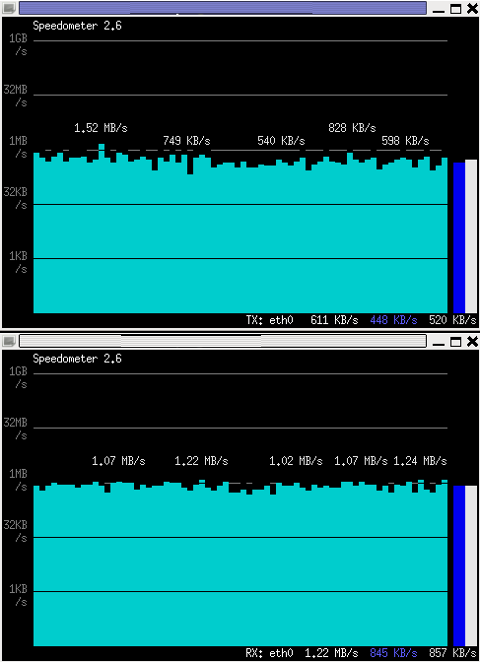
If you want to watch in separate windows TX and RX traffic while  running speedometer you can run in separate xterm windows speedometer -tx eth0 and speedometer -rx eth0, like in below screenshot:

Monitor Received and Transmitted server Network traffic in two separate xterm windows with speedometer ascii graphs

4. Using speedometer to test network maximum possible transfer speed between server (host A) and server (host B)

The speedometer manual suggests few examples one of which is:

How fast is this LAN?

host-a$ cat /dev/zero | nc -l -p 12345
host-b$ nc host-a 12345 > /dev/null
host-b$ speedometer -rx eth0

When I red this example in speedometer's manual, it wasn't completely clear to me what the author really meant, but a bit after when I thought over the example I got his point.

The idea behind this example is that a constant stream of zeros taken from /dev/zero will be streamed over via a pipe (|) to nc which will bind a port number 12345, anyone connecting from another host machine, lets say a server with host host-b to port 12345 on machine host-a will start receiving the /dev/zero streamed content.

Then to finally measure the streamed traffic between host-a and host-b machines a speedometer is started to visualize the received traffic on network interface eth0, thus measuring the amount of traffic flowing from host-a to host-b

I give a try to the exmpls, using for 2 test nodes my home Desktop PC, Linux running  arcane version of Ubuntu and my Debian Linux notebook.

First on the Ubuntu PC I issued
 

hipo@hip0-desktop:~$ cat /dev/zero | nc -l -p 12345
 

Note that I have previously had installed the netcat, as nc is not installed by default on Ubuntu and Debian. If you, don't have nc installed yet, install it with:

apt-get –yes install netcat

"cat /dev/zero | nc -l -p 12345" will not produce any output, but will display just a blank line.

Then on my notebook I ran the second command example, given in the speedometer manual:
 

hipo@noah:~$ nc 192.168.0.2 12345 > /dev/null

Here the 192.168.0.2 is actually the local network IP address of my Desktop PC. My Desktop PC is connected via a normal 100Mbit switch to my routing machine and receives its internet via  NAT. The second test machine (my laptop), gets its internet through a WI-FI connection received by a Wireless Router connected via a UTP cable to the same switch to which my Desktop PC is connected.

Finally to test / get my network maximum thoroughput I had to use:

hipo@noah:~$ speedometer -rx wlan0

Here, I  monitor my wlan0 interface, as this is my (laptop) wireless card interface over which I have connectivity to my local network and via which through the the WI-FI router I get connected to the internet.

Below is a snapshot captured showing approximately what is the max network thoroughput from:

Desktop PC -> to my Thinkpad R61 laptop

Using Speedometer to test network thorougput between two network server hosts screenshot Debian Squeeze Linux

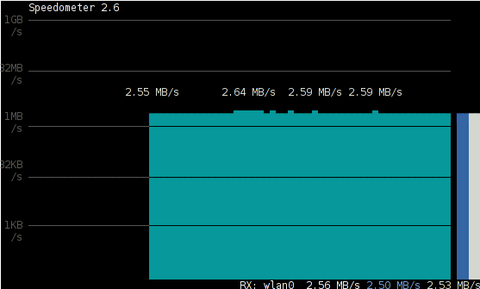
As you can see in the shot approximately the maximum network thoroughput is in between:
2.55MB/s min and 2.59MB/S max, the speed is quite low for a 100 MBit local network, but this is normal as most laptop wireless adapters hardly transfer traffic in more than 10 to 20 MBits per sec.

If the same nework thoroughput test is conducted between two machines both connected to a same 100 M/bit switch, the traffic should be at least a 8 MB/sec.

There is something, else to take in consideration that probably makes the provided example network thoroughput measuring a bit inaccurate. The fact that the /dev/zero content is stremed over is slowing down the zeroes sent over network because of the  pipe ( | ) use slows down the stream.

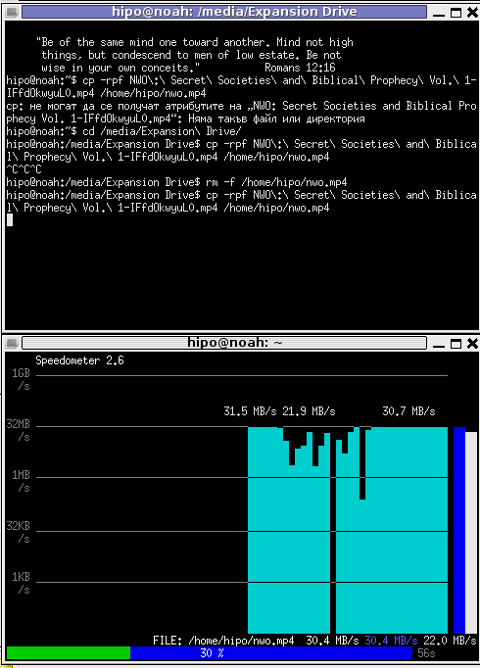
5. Using speedometer to visualize maximum writting speed to a local hard drive on Linux

In the speedometer manual, I've noticed another interesting application of this nifty tool.

speedometer can be used to track and visualize the maximum writing speed a hard disk drive or hard drive partition can support on Linux OS:

A copy paster from the manual text is as follows:

How fast can I write data to my filesystem? (with at least 1GB free)
dd bs=1000000 count=1000 if=/dev/zero of=bigfile &
speedometer bigfile

However, when I tried copy/pasting the example in terminal, to test the maximum writing speed to an external USB hard drive, only dd command was started and speedometer failed to initialize and display graphs of the file creation speed.

I've found a little "hack" that makes the man example work by adding a 3 secs sleep like so:

debian:/media/Expansion Drive# dd bs=1000000 count=1000 if=/dev/zero of=bigfile & sleep 3; speedometer bigfile

Here is a screenshot of the bigfile created by dd and tracked "in real time" by speedometer:

How fast is writting data to local USB expandable hard disk Debian Linux speedometer screenshot

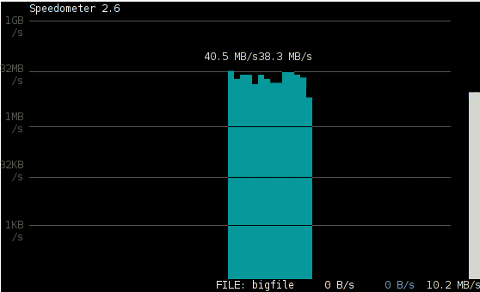
Actually the returned results from this external USB drive are, quite high, the possible reason for that is it is connected to my laptop over an USB protocol verion 3.

6. Using Speedometer to keep an eye on file download in progress

This application of speedometer is mostly useless especially on Linux where it is used as a Desktop.

However in some occasions if files are transferred over ssh or in non interactive FTP / Samba file transfers between Linux servers it can come handy.

To visualize the download and writing speed of lets say FTP transferred .AVI movie (during the actual file transfer) on the download host issue:

# speedometer Download-Folder/What-goes-around-comes-around.avi

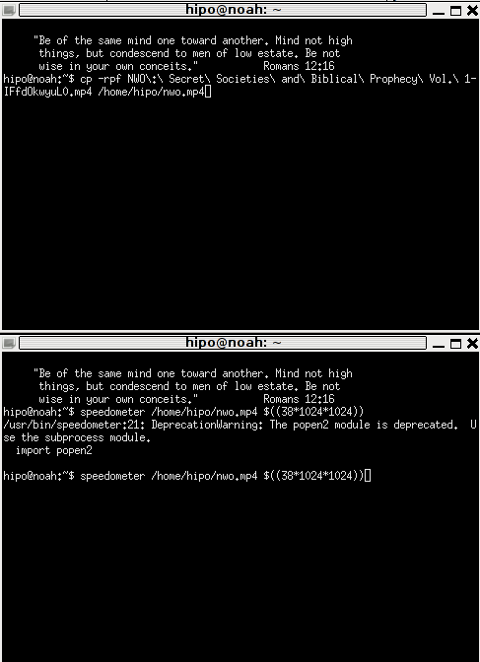
7. Estimating approximate time for file transfer

There is another section in the speedometer manual pointing of the program use to calculate the time remaining for a file transfer.

The (man speedometer) provided example text is:

How long it will take for my 38MB transfer to finish?
speedometer favorite_episode.rm $((38*1024*1024))

At first glimpse it hard to understand (like the other manual example). A bit of reasoning and I comprehend what the man author meant by the obscure calculation:

$((38*1024*1024))

This is a formula used in which 38 has to be substituted with the exact file size amount of the transferred file. The author manual used a 38MB file so this is why he put $((38* … in the formula.

I give it a try – (just for the sake to see how it works) with a file with a size of 2500MB, in below two screenshot pictures I show my preparation to copy the file and the actual copying / "real time" transfer tracking with speedometer's status percentage completion bar.

xterm terminal copy file and estimate file copying operation speed on linux with speedometer preparation

Two xterm terminals one is copying a file the other one uses speedometer to estimate the time remaining to complete the file transfer from expansion USB hard drive to my laptop harddrive


Monitoring MySQL server queries and debunning performance (slow query) issues with native MySQL commands and with mtop, mytop

Thursday, May 10th, 2012

If you're a Linux server administrator running MySQL server, you need to troubleshoot performance and bottleneck issues with the SQL database every now and then. In this article, I will pinpoint few methods to debug basic issues with MySQL database servers.

1. Troubleshooting MySQL database queries with native SQL commands

a)One way to debug errors and get general statistics is by logging in with mysql cli and check the mysql server status:

# mysql -u root -p
mysql> SHOW STATUS;
+-----------------------------------+------------+
| Variable_name | Value |
+-----------------------------------+------------+
| Aborted_clients | 1132 |
| Aborted_connects | 58 |
| Binlog_cache_disk_use | 185 |
| Binlog_cache_use | 2542 |
| Bytes_received | 115 |
.....
.....
| Com_xa_start | 0 |
| Compression | OFF |
| Connections | 150000 |
| Created_tmp_disk_tables | 0 |
| Created_tmp_files | 221 |
| Created_tmp_tables | 1 |
| Delayed_errors | 0 |
| Delayed_insert_threads | 0 |
| Delayed_writes | 0 |
| Flush_commands | 1 |
.....
.....
| Handler_write | 132 |
| Innodb_page_size | 16384 |
| Innodb_pages_created | 6204 |
| Innodb_pages_read | 8859 |
| Innodb_pages_written | 21931 |
.....
.....
| Slave_running | OFF |
| Slow_launch_threads | 0 |
| Slow_queries | 0 |
| Sort_merge_passes | 0 |
| Sort_range | 0 |
| Sort_rows | 0 |
| Sort_scan | 0 |
| Table_locks_immediate | 4065218 |
| Table_locks_waited | 196 |
| Tc_log_max_pages_used | 0 |
| Tc_log_page_size | 0 |
| Tc_log_page_waits | 0 |
| Threads_cached | 51 |
| Threads_connected | 1 |
| Threads_created | 52 |
| Threads_running | 1 |
| Uptime | 334856 |
+-----------------------------------+------------+
225 rows in set (0.00 sec)

SHOW STATUS; command gives plenty of useful info, however it is not showing the exact list of queries currently processed by the SQL server. Therefore sometimes it is exactly a stucked (slow queries) execution, you need to debug in order to fix a lagging SQL. One way to track this slow queries is via enabling mysql slow-query.log. Anyways enabling the slow-query requires a MySQL server restart and some critical productive database servers are not so easy to restart and the SQL slow queries have to be tracked "on the fly" so to say.
Therefore, to check the exact (slow) queries processed by the SQL server (without restarting it), do
 

mysql> SHOW processlist;
+——+——+—————+——+———+——+————–+——————————————————————————————————+
| Id | User | Host | db | Command | Time | State | Info |
+——+——+—————+——+———+——+————–+——————————————————————————————————+
| 609 | root | localhost | blog | Sleep | 5 | | NULL |
| 1258 | root | localhost | NULL | Sleep | 85 | | NULL |
| 1308 | root | localhost | NULL | Query | 0 | NULL | show processlist |
| 1310 | blog | pcfreak:64033 | blog | Query | 0 | Sending data | SELECT comment_author, comment_author_url, comment_content, comment_post_ID, comment_ID, comment_aut |
+——+——+—————+——+———+——+————–+——————————————————————————————————+
4 rows in set (0.00 sec)
mysql>

SHOW processlist gives a good view on what is happening inside the SQL.

To get more complete information on SQL query threads use the full extra option:

mysql> SHOW full processlist;

This gives pretty full info on running threads, but unfortunately it is annoying to re-run the command again and again – constantly to press UP Arrow + Enter keys.

Hence it is useful to get the same command output, refresh periodically every few seconds. This is possible by running it through the watch command:

debian:~# watch "'show processlist' | mysql -u root -p'secret_password'"

watch will run SHOW processlist every 2 secs (this is default watch refresh time, for other timing use watch -n 1, watch -n 10 etc. etc.

The produced output will be similar to:

Every 2.0s: echo 'show processlist' | mysql -u root -p'secret_password' Thu May 10 17:24:19 2012

Id User Host db Command Time State Info
609 root localhost blog Sleep 3 NULL1258 root localhost NULL Sleep 649 NULL1542 blog pcfreak:64981 blog Query 0 Copying to tmp table \
SELECT p.ID, p.post_title, p.post_content,p.post_excerpt, p.pos
t_date, p.comment_count, count(t_r.o
1543 root localhost NULL Query 0 NULL show processlist

Though this "hack" is one of the possible ways to get some interactivity on what is happening inside SQL server databases and tables table. for administering hundred or thousand SQL servers running dozens of queries per second – monitor their behaviour few times aday using mytop or mtop is times easier.

Though, the names of the two tools are quite similar and I used to think both tools are one and the same, actually they're not but both are suitable for monitoring sql database execution in real time.

As a sys admin, I've used mytop and mtop, on almost each Linux server with MySQL server installed.
Both tools has helped me many times in debugging oddities with sql servers. Therefore my personal view is mytop and mtop should be along with the Linux sysadmin most useful command tools outfit, still I'm sure many administrators still haven't heard about this nice goodies.

1. Installing mytop on Debian, Ubuntu and other deb based GNU / Linux-es

mytop is available for easy install on Debian and across all debian / ubuntu and deb derivative distributions via apt.

Here is info obtained with apt-cache show

debian:~# apt-cache show mytop|grep -i description -A 3
Description: top like query monitor for MySQL
Mytop is a console-based tool for monitoring queries and the performance
of MySQL. It supports version 3.22.x, 3.23.x, 4.x and 5.x servers.
It's written in Perl and support connections using TCP/IP and UNIX sockets.

Installing the tool is done with the trivial:

debian:~# apt-get --yes install mytop
....

mtop used to be available for apt-get-ting in Debian Lenny and prior Debian releases but in Squeeze onwards, only mytop is included (probably due to some licensing incompitabilities with mtop??).

For those curious on how mtop / mytop works – both are perl scripts written to periodically connects to the SQL server and run commands similar to SHOW FULL PROCESSLIST;. Then, the output is parsed and displayed to the user.

Here how mytop running, looks like:

MyTOP showing queries running on Ubuntu 8.04 Linux - Debugging interactively top like MySQL

2. Installing mytop on RHEL and CentOS

By default in RHEL and CentOS and probably other RedHat based Linux-es, there is neither mtop nor mytop available in package repositories. Hence installing the tools on those is only available from 3rd parties. As of time of writting an rpm builds for RHEL and CentOS, as well as (universal rpm distros) src.rpm package is available on http://pkgs.repoforge.org/mytop/. For the sake of preservation – if in future those RPMs disappear, I made a mirror of mytop rpm's here

Mytop rpm builds depend on a package perl(Term::ReadKey), my attempt to install it on CentOS 5.6, returned following err:

[root@cenots ~]# rpm -ivh mytop-1.4-2.el5.rf.noarch.rpm
warning: mytop-1.4-2.el5.rf.noarch.rpm: Header V3 DSA signature: NOKEY, key ID 6b8d79e6
error: Failed dependencies:
perl(Term::ReadKey) is needed by mytop-1.4-2.el5.rf.noarch

The perl(Term::ReadKey package is not available in CentOS 5.6 and (probably other centos releases default repositories so I had to google perl(Term::ReadKey) I found it on http://rpm.pbone.net/ package repository, the exact url to the rpm dependency as of time of writting this post is:

ftp://ftp.pbone.net/mirror/yum.trixbox.org/centos/5/old/perl-Term-ReadKey-2.30-2.rf.i386.rpm

Quickest, way to install it is:

[root@centos ~]# rpm -ivh ftp://ftp.pbone.net/mirror/yum.trixbox.org/centos/5/old/perl-Term-ReadKey-2.30-2.rf.i386.rpmRetrieving ftp://ftp.pbone.net/mirror/yum.trixbox.org/centos/5/old/perl-Term-ReadKey-2.30-2.rf.i386.rpmPreparing... ########################################### [100%]
1:perl-Term-ReadKey ########################################### [100%]

This time mytop, install went fine:

[root@centos ~]# rpm -ivh mytop-1.4-2.el5.rf.noarch.rpm
warning: mytop-1.4-2.el5.rf.noarch.rpm: Header V3 DSA signature: NOKEY, key ID 6b8d79e6
Preparing... ########################################### [100%]
1:mytop ########################################### [100%]

To use it further, it is the usual syntax:

mytop -u username -p 'secret_password' -d database

CentOS Linux MyTOP MySQL query benchmark screenshot - vpopmail query

3. Installing mytop and mtop on FreeBSD and other BSDs

To debug the running SQL queries in a MySQL server running on FreeBSD, one could use both mytop and mtop – both are installable via ports:

a) To install mtop exec:

freebsd# cd /usr/ports/sysutils/mtop
freebsd# make install clean
....

b) To install mytop exec:

freebsd# cd /usr/ports/databases/mytop
freebsd# make install clean
....

I personally prefer to use mtop on FreeBSD, because once run it runs prompts the user to interactively type in the user/pass

freebsd# mtop

Then mtop prompts the user with "interactive" dialog screen to type in user and pass:

Mtop interactive type in username and password screenshot on FreeBSD 7.2

It is pretty annoying, same mtop like syntax don't show user/pass prompt:

freebsd# mytop
Cannot connect to MySQL server. Please check the:

* database you specified "test" (default is "test")
* username you specified "root" (default is "root")
* password you specified "" (default is "")
* hostname you specified "localhost" (default is "localhost")
* port you specified "3306" (default is 3306)
* socket you specified "" (default is "")
The options my be specified on the command-line or in a ~/.mytop
config file. See the manual (perldoc mytop) for details.
Here's the exact error from DBI. It might help you debug:
Unknown database 'test'

The correct syntax to run mytop instead is:

freebsd# mytop -u root -p 'secret_password' -d 'blog'

Or the longer more descriptive:

freebsd# mytop --user root --pass 'secret_password' --database 'blog'

By the way if you take a look at mytop's manual you will notice a tiny error in documentation, where the three options –user, –pass and –database are wrongly said to be used as -user, -pass, -database:

freebsd# mytop -user root -pass 'secret_password' -database 'blog'
Cannot connect to MySQL server. Please check the:

* database you specified "atabase" (default is "test")
* username you specified "ser" (default is "root")
* password you specified "ass" (default is "")
* hostname you specified "localhost" (default is "localhost")
* port you specified "3306" (default is 3306)
* socket you specified "" (default is "")a
...
Access denied for user 'ser'@'localhost' (using password: YES)

Actually it is interesting mytop, precededed historically mtop.
mtop was later written (probably based on mytop), to run on FreeBSD OS by a famous MySQL (IT) spec — Jeremy Zawodny .
Anyone who has to do frequent MySQL administration tasks, should already heard Zawodny's name.
For those who haven't, Jeremy used to be a head database administrators and developer in Yahoo! Inc. some few years ago.
His website contains plenty of interesting thoughts and writtings on MySQL server and database management
 

AEWAN – a nice advanced GNU / Linux console ASCII art text editor

Saturday, May 19th, 2012

I'm a guy fascinated by ASCII art, since the very early days I saw a piece of this awesome digital art.

As time passed and computers went to be used mostly  graphics resolution, ASCII art loose its huge popularity from the early DOS and BBS (internet primordial days).

However, this kind  of art is still higly valued by true computer geeks.
In that manner of thoughts, lately I'm researching widely on ASCII art tools and ASCII art open source tools available for Linux.
Last time I check what is available for 'ASCII job' was before 5 years time. Recently I decided to review once again and see if there are new software for doing ascii manipulations on Linux and this is how this article got born.

My attention was caught by aewan (ASCII-art Editor Without A Name), while searching for ASCII keyword description packages with:

apt-cache search ascii

Aewan project official website is on sourceforge check it out here

Here is the complete description of the Debian package:

hipo@noah:~$ apt-cache show aewan|grep -i description -A 5
Description: ASCII-art Editor Without A Name
aewan is an ASCII art editor with support for multiple layers that can be
edited individually, colors, rectangular copy and paste, and intelligent
horizontal and vertical flipping (converts '\' to '/', etc). It produces
both stand-alone art files and an easy-to-parse format for integration
into your terminal applications.

I installed it to give it a try:

noah:~# apt-get --yes install aewan
Selecting previously deselected package aewan.
(Reading database ... 388522 files and directories currently installed.)
Unpacking aewan (from .../aewan_1.0.01-3_amd64.deb) ...
Processing triggers for man-db ...
Setting up aewan (1.0.01-3) ...

aewan package provides three executable binaries:

noah:~# dpkg -L aewan|grep -i /bin/ /usr/bin/aecat
/usr/bin/aewan
/usr/bin/aemakeflic

1. aewan binary is the ascii-art editor itself

2. aecat is utility to display an aewan documents (aewan format saved files)3. aemakeflictool to produce an animation from an aewan document

Next I ran it in plain console tty  to check how it is like:

hipo@noah:~$ aewan

Below are screenshots to give you an idea how powerful aewan ASCII art editor is:

AEWAN ASCII art editor entry information screen Debian GNU / Linux shot

Aewan immediate entry screen after start up

Aewan ASCII art editor Linux showing the major functionality of aewan on Debian GNU / Linux Squeeze

Aewan ASCII art editor – all of the supported tool functions

As you can see from the shot the editor is very feature rich. I was stunned to find out it even supports layers (in ASCII!!) (w0w!). 
It even has a Layers Manager (like GIMP) 🙂

To create my first ASCII art I used the:

New

menu.

This however didn't immediately show the prompt, where I can type  the ascii characters to draw my picture. In order to be able to draw inside the editor, its necessary to open at least one layer, through using the menu:

Add Layer (defaults)

then the interactive ASCII art editor appeared.

While an ASCII art is created with the editor you can select the color of the input characters by using Drawing Color menu seen in the above screenshot.

aewan drawing color choose color Linux shot

I've played few minutes and created a sample ascii art, just to test the color and editor "look & feel", my conclusions are the editor chars drawing is awesome.

Aewan ascii art produced on my Debian GNU / Linux host

All the commands available via menus are also accessible via a shortcut key combinations:

Aewan Linux Ascii art editor quick key shortcut commands

aewan controls are just great and definitely over-shadows every other text editor I used to draw an ASCII art so far.
Once saved the ASCII art, are by default saved in a plain gzipped ascii text. You can therefore simply zcat the the saves;
Don't expect zcat to show you the ascii as they're displayed in aewan, zcat-ing it will instead  display just the stored meta data; the meta data is interpreted and displayed properly only with aecat command.

aewan aecat displaying properly previously saved ascii art picture

I've checked online for rpm builds too and such are available, so installing on Fedora, CentOS, SuSE etc. is up to downloading the right distro / hardware architecture rpm package and running:

# rpm -ivh aewan*.rpm

On the official website, there are also instructions to compile from source, Slackware users and users of other distros which doesn't have a package build should compile manually with the usual:

$ tar -zxf aewan-1.0.01.tar.gz
$ cd aewan-1.0.01
$ ./configure
$ make
$ su -c "make install"

For those inrested to make animations with aemakeflic you need to first save a multiple layers of pictures. The idea of creating ASCII art video is pretty much like the old school way to make animation "draw every scene" and movie it. Once all different scene layers of the ASCII art animation are prepared one could use  aemakeflic to export all the ASCII layers as common video.

aemakeflic has the ability to export the ASCII animation in a runnable shell script to display the animation. The other way aemakeflic can be used is to produce a picture in kind of text format showing the video whether seen with  less cmd.
Making ASCII animation takes a lot of time and effort. Since i'm too lazy and I lack the time I haven't tested this functionality. Anyways I've seen some ascii videos on telnet  to remote hosts (some past time); therefore I guess they were made using aewan and later animated with aemakeflic.

I will close this post with a nice colorful ASCII art, made with aewan (picture is taken from the project page):

Aewan Flipping Selection Screenshot