Posts Tagged ‘Useful’

How to Install and Use Kibana for Log Visualization

Wednesday, February 18th, 2026

/images/kibana-logo how to install it on linux
I saw Kibana in my professional career and I find it a very interesting tool for sysadmins, so I thought it might be helpful to someone out there to write a small article on how to install and use to to visualize data inside some elasticsearch software.

Kibana is an open-source data visualization and exploration tool used to analyze large volumes of data, especially logs. It is part of the ELK Stack (Elasticsearch, Logstash, Kibana), and is commonly used for centralized log management, security monitoring, and observability.

Kibana is often used in the so-called ELK pipeline for log file collection, analysis and visualization:

  • Elasticsearch is for searching, analyzing, and storing your data
  • Logstash (and Beats) is for collecting and transforming data, from any source, in any format
  • Kibana is a portal for visualizing the data and to navigate within the elastic stack
     

In this article, you'll learn how to:

  • Install Kibana
  • Connect it to Elasticsearch
  • Visualize log data
  • Use its basic features

Prerequisites

Before installing Kibana, make sure you have the following:

  • A Linux server running (Ubuntu / Debian / CentOS / RHEL)
  • Elasticsearch installed and running
  • Root or sudo access

Install Kibana

I. On Debian/Ubuntu
 

  1. Import the Elastic GPG key:

# wget -qO – https://artifacts.elastic.co/GPG-KEY-elasticsearch | sudo apt-key add –

  1. Add the repository:

# echo "deb https://artifacts.elastic.co/packages/8.x/apt stable main" | sudo tee -a /etc/apt/sources.list.d/elastic-8.x.list

  1. Update and install:


# apt update

# apt install kibana

II. On RHEL/CentOS Linux

  1. Create repo file:

# tee /etc/yum.repos.d/elastic.repo <<EOF

[elastic-8.x]

name=Elastic repository for 8.x packages

baseurl=https://artifacts.elastic.co/packages/8.x/yum

gpgcheck=1

gpgkey=https://artifacts.elastic.co/GPG-KEY-elasticsearch

enabled=1

autorefresh=1

type=rpm-md

EOF

  1. Install Kibana:

# yum install kibana

2. Configure Kibana

The configuration file is located at:

/etc/kibana/kibana.yml

Edit the file:

# vim /etc/kibana/kibana.yml

Update or add the following:
 

# Server settings
server.port: 5601
server.host: "0.0.0.0"

# Elasticsearch connection
elasticsearch.hosts: [“http://localhost:9200”]

# Logging
logging.level: info

# Security (only if Elasticsearch security is enabled)
# elasticsearch.username: "kibana_system"
# elasticsearch.password: "your_password_here"

Optional: Set basic auth or SSL settings if needed.


3. Start and Enable Kibana

# systemctl enable kibana

# systemctl start kibana

Check status:

# systemctl status kibana


4. Access Kibana Web Interface

Open your browser and go to:

http://<your-server-ip>:5601

You’ll be welcomed with the Kibana dashboard.

5. Import and Visualize Logs

Option A: Use Filebeat to Send Logs

Install Filebeat on the server with logs and configure it to send data to Elasticsearch. Kibana will then be able to visualize it.

# apt install filebeat

# filebeat modules enable system

# filebeat setup

# systemctl start filebeat

Option B: Ingest Logs via Logstash or Elasticsearch API

If you already have data in Elasticsearch, Kibana will automatically detect indices.
 

6. Create Index Pattern

  1. In Kibana, go to Stack Management -> Index Patterns
  2. Click Create Index Pattern
  3. Enter the name (e.g., filebeat-*)
  4. Select the timestamp field (usually @timestamp)
  5. Save

Now Kibana knows how to query and visualize your data.

7. Create Visualizations and Dashboards

  1. Go to Visualize -> Create visualization
  2. Choose a type (bar, pie, line, etc.)
  3. Select an index pattern
  4. Configure metrics and buckets

You can then save visualizations and add them to dashboards.

8. Secure Kibana

  • Configure TLS/SSL for Kibana / ElasticSearch (such as Logstash)
  • Use additional Elastic Security features like RBAC (Role Based Access Control, SSO (Single Sign On)
  • Secure Kibana with a reverse proxy (e.g., Nginx + Basic Auth or Apache / Haproxy infront)

Example Nginx config simple snippet:

location / {

  proxy_pass http://localhost:5601;

  auth_basic "Restricted";

  auth_basic_user_file /etc/nginx/.htpasswd;

}


What is Kibana used for and what it can do for you?

Use Case

Description

Log Monitoring

Visualize system and application logs in real time

Security Analytics

Detect anomalies, failed logins, suspicious activity

DevOps Dashboards

Track uptime, error rates, and system performance

SIEM

Use Elastic Security for threat detection


Once Kibana is installed on a server, you typically use it to visualize and explore data stored in Elasticsearch. Here’s a practical guide with sample usage scenarios:

Access Kibana

After installation, Kibana usually runs on port 5601 by default.

http://<your-server-ip>:5601

  • Open this URL in a browser.
  • You should see the Kibana dashboard.

Connect to Elasticsearch

Kibana automatically connects to your Elasticsearch instance if installed locally.
You can verify the connection:

GET /_cluster/health

  • Go to Dev ToolsConsole in Kibana.
  • Run the above query to check cluster status.

Visualize Data

Kibana allows multiple types of visualizations:

  • Bar/line chart: trends over time.
  • Pie chart: distribution of values.
  • Data table: top IP addresses or most visited URLs.
  • Maps: geolocation of IP addresses.

Create Dashboards

  • Combine multiple visualizations in a Dashboard.
  • Useful for monitoring logs, metrics, or application performance.
  • Example: Create a dashboard with:


    • Requests per URL (bar chart)
    • Requests over time (line chart)
    • Top client IPs (data table)
    • Errors by type (pie chart)

 Search & Query Logs

  • Use Discover to search logs interactively.
  • Example KQL query:

status:500 AND url:"/login"

This finds all failed login requests.

Set Alerts (Optional)

  • Kibana’s Alerts and Actions can trigger notifications (email, Slack, etc.) when certain thresholds are crossed.
  • Example: alert if error responses exceed 100 in 5 minutes.

Once Kibana is installed on a server, you typically use it to visualize and explore data stored in Elasticsearch. Here’s a practical guide with sample usage scenarios:

Access Kibana

After installation, Kibana usually runs on port 5601 by default.

http://<your-server-ip>:5601

  • Open this URL in a browser.
  • You should see the Kibana dashboard.

Connect to Elasticsearch

Kibana automatically connects to your Elasticsearch instance if installed locally.
You can verify the connection:

GET /_cluster/health

  • Go to Dev ToolsConsole in Kibana.
  • Run the above query to check cluster status.

Visualize Data

Kibana allows multiple types of visualizations:

  • Bar/line chart: trends over time.
  • Pie chart: distribution of values.
  • Data table: top IP addresses or most visited URLs.
  • Maps: geolocation of IP addresses.

Create Dashboards

  • Combine multiple visualizations in a Dashboard.
  • Useful for monitoring logs, metrics, or application performance.
  • Example: Create a dashboard with:
     

    • Requests per URL (bar chart)
    • Requests over time (line chart)
    • Top client IPs (data table)
    • Errors by type (pie chart)

 Search & Query Logs

  • Use Discover to search logs interactively.
  • Example KQL query:

status:500 AND url:"/login"

This finds all failed login requests.

Set Alerts (Optional)

  • Kibana’s Alerts and Actions can trigger notifications (email, Slack, etc.) when certain thresholds are crossed.
  • Example: alert if error responses exceed 100 in 5 minutes.

Once Kibana is installed on a server, you typically use it to visualize and explore data stored in Elasticsearch. Here’s a practical guide with sample usage scenarios:

Access Kibana

After installation, Kibana usually runs on port 5601 by default.

http://your-server-ip:5601

  • Open this URL in a browser.
  • You should see the Kibana dashboard.

Connect to Elasticsearch

Kibana automatically connects to your Elasticsearch instance if installed locally.
You can verify the connection:

GET /_cluster/health

  • Go to Dev ToolsConsole in Kibana.
  • Run the above query to check cluster status.

Visualize Data

Kibana allows multiple types of visualizations:

  • Bar/line chart: trends over time.
  • Pie chart: distribution of values.
  • Data table: top IP addresses or most visited URLs.
  • Maps: geolocation of IP addresses.

Create Dashboards

  • Combine multiple visualizations in a Dashboard.
  • Useful for monitoring logs, metrics, or application performance.
  • Example: Create a dashboard with:

    • Requests per URL (bar chart)
    • Requests over time (line chart)
    • Top client IPs (data table)
    • Errors by type (pie chart)

 Search & Query Logs

  • Use Discover to search logs interactively.
  • Example KQL query:

status:500 AND url:"/login"

This finds all failed login requests.

Set Alerts (Optional)

  • Kibana’s Alerts and Actions can trigger notifications (email, Slack, etc.) when certain thresholds are crossed.
  • Example: alert if error responses exceed 100 in 5 minutes.

kibana-sample-dashboard-screenshot

Sample Kibana dashboard
 

kibana-geo-kibana-web-traffic-by-location

Kibana with connected servers to find out Geo Location
 

Summary closing words (what we did)

Step

Action

 1

Install Kibana from Elastic repo

2

Configure to connect to Elasticsearch

3

Start and enable the service

4

Access it via http://<ip>:5601

5

Ingest log data

6

Define index pattern

7

Create dashboards and visualizations

The idea of this article was just to introduce you to the existence of Elasticsearch / kibana and filebeat and logstack and not to give you a fully fine tuned install guide. The usual way to deploy Kibana on multiple servers of course is using a dockerized container version of it. There is plenty to learned on how to use kibana to do a monitoring of your machines. But most simple use is to directly access the locally visible kibana on a server and check the status of processes on the host instead of logging via SSH. Kibana can do pretty much


Some further useful Reading Resources


How to Make Easy Backups on Linux Using a GUI tools Deja Dup, TimeShift, BackinTime, Grsync, Vorta

Monday, February 2nd, 2026

Backing up your data on Linux doesn’t have to involve complex terminal commands or custom scripts. While the command line is powerful, many users prefer a simple graphical interface (GUI) that just works.

Luckily, Linux offers several excellent GUI-based backup tools that are easy, reliable, and beginner-friendly.

In this article, we’ll look at why backups matter, and then walk through some of the best GUI backup tools for Linux, along with basic setup tips.

Why Backups Are Important (Even on Linux)

Linux systems are known for stability, but unfortunately, no system is immune to:

  • Hard drive failures
  • Accidental file deletion
  • System updates gone wrong
  • Malware or ransomware
  • Laptop theft or damage

A proper backup ensures you can restore your files or even your entire system in minutes instead of losing everything.

What Makes a Good GUI Backup Tool?

For most desktop users, a good backup tool should :

  • Be easy to use (no terminal required)
  • Supports automatic scheduled backups
  • Allow restoring individual files
  • Work with different types of external drives or network storage
  • Be relatively actively maintained
     

Let’s look at the few tools to create backups with lesser effort.

1. Déjà Dup – The Simplest Backup Tool

Best for: Beginners and home users
Available on: Ubuntu, Linux Mint, Fedora, and others

Déjà Dup is one of the most user-friendly backup tools on Linux. It comes preinstalled on Ubuntu and integrates perfectly with the GNOME desktop.

Key Features

  • Very simple interface
  • Automatic scheduled backups
  • Supports local drives, external USB disks, and network locations
  • Optional encryption for security

# apt info deja-dup
Package: deja-dup
Version: 44.0-2
Priority: optional
Section: utils
Maintainer: Debian GNOME Maintainers <pkg-gnome-maintainers@lists.alioth.debian.org>
Installed-Size: 4,851 kB
Depends: duplicity (>= 0.7.14), dconf-gsettings-backend | gsettings-backend, libadwaita-1-0 (>= 1.2), libc6 (>= 2.34), libglib2.0-0 (>= 2.70.0), libgpg-error0 (>= 1.14), libgtk-4-1 (>= 4.0.0), libjson-glib-1.0-0 (>= 1.5.2), libpackagekit-glib2-18 (>= 1.1.0), libpango-1.0-0 (>= 1.18.0), libsecret-1-0 (>= 0.18.6), libsoup-3.0-0 (>= 3.0.3)
Recommends: gvfs-backends, packagekit, policykit-1
Suggests: python3-pydrive2
Homepage: https://launchpad.net/deja-dup
Tag: admin::backup, implemented-in::c, interface::graphical, interface::x11,
 role::program, scope::application, suite::gnome, uitoolkit::gtk,
 x11::application
Download-Size: 693 kB
APT-Sources: http://ftp.debian.org/debian bookworm/main amd64 Packages
Description: Backup utility
 Déjà Dup is a simple backup tool. It hides the complexity of backing up the
 Right Way (encrypted, off-site, and regular) and uses duplicity as the
 backend.
 .
 Features:
  * Support for local, remote, or cloud backup locations such as Nextcloud
  * Securely encrypts and compresses your data
  * Incrementally backs up, letting you restore from any particular backup
  * Schedules regular backups
  * Integrates well into your GNOME desktop

How to Use Déjà Dup

Using it is generally simplistic, you select the data folders to be backupped and then the media where to backup it. The program supports also encryption with a password which is nice if you want to keep the backed-up data secret (especially if you want to store the backup on Google Cloud or Microsoft Azure)

Open “Backups” from your application menu

  1. Choose folders to back up (e.g., Home folder)
  2. Select a backup location (external drive recommended)
  3. Enable automatic backups


Click on Back Up Now button

That’s it. Déjà Dup runs quietly in the background after setup.

Note ! that it is not a good idea to try to backup the whole Linux installation ! with deja-dup, as you will get a lot of issues with improper permissions errors and stuff and the OS backup won't get consistent, however for a basic backups of User Homes, Cictures and some Personal data situated within a single directory it is simple as it is easy to initially setup and run.

# apt install deja-dup

$ sudo deja-dup


deja-dup-backup-gui-tool-linux-screenshot

deja-dup-backup-gui-tool-linux-screenshot2

2. Timeshift – System Snapshots Made Easy

Best for: System recovery
Available on: Most Linux distributions

Timeshift focuses on system backups, not personal files. It creates restore points similar to Windows System Restore.

Key Features

  • Snapshot-based backups
  • Perfect for rolling back failed updates
  • Supports RSYNC and BTRFS
  • Clean and simple GUI
     

When to Use Timeshift

  • Before major system updates
  • After fresh OS installation
  • To recover from broken packages or configs

# apt info timeshift
Package: timeshift
Version: 22.11.2-1+deb12u1
Priority: optional
Section: utils
Maintainer: Yanhao Mo <yanhaocs@gmail.com>
Installed-Size: 3,231 kB
Depends: cron-daemon | cron, pkexec, psmisc, rsync, libc6 (>= 2.34), libcairo2 (>= 1.2.4), libgdk-pixbuf-2.0-0 (>= 2.22.0), libgee-0.8-2 (>= 0.8.3), libglib2.0-0 (>= 2.39.4), libgtk-3-0 (>= 3.16.2), libjson-glib-1.0-0 (>= 1.5.2), libvte-2.91-0, libxapp1 (>= 1.0.4)
Breaks: util-linux (<< 2.37.2~)
Replaces: timeshift-btrfs
Homepage: https://github.com/linuxmint/timeshift
Tag: uitoolkit::gtk
Download-Size: 617 kB
APT-Manual-Installed: yes
APT-Sources: http://ftp.debian.org/debian bookworm/main amd64 Packages
Description: System restore utility
 Timeshift is a system restore utility which takes snapshots
 of the system at regular intervals. These snapshots can be restored
 at a later date to undo system changes. Creates incremental snapshots
 using rsync or BTRFS snapshots using BTRFS tools.

# apt install timeshift

$ sudo timeshift-gtk


https://www.pc-freak.net/images/linux-gui-backup-tools-screenshot/timeshift-rsync-backup-gui-tool-linux-screenshot4

timeshift-rsync-backup-gui-tool-linux-screenshot5

timeshift-rsync-backup-gui-tool-linux-screenshot6

3. Use Timeshift alongside a file backup tool like Déjà Dup as a backup solution for OS and data

a. Set up Timeshift (system snapshots)

What to include

Snapshot type:

  • RSYNC → works on any filesystem (recommended)
  • BTRFS → if your root is BTRFS


timeshift-rsync-backup-gui-tool-linux-screenshot1

Include:

  • / (root filesystem)

Exclude home directories (important!)

In Timeshift settings:

  • Keep /root excluded
  • Do NOT include /home/youruser

timeshift-rsync-backup-gui-tool-linux-screenshot2

Timeshift is not meant to back up your personal files.

Schedule (typical)

  • Daily: 3–5 snapshots
  • Weekly: 2–3 snapshots
  • Monthly: optional

Store snapshots on:

A separate drive or partition if possible

b. Set up Deja Dup (personal backups)

Deja Dup is perfect for:

  • Home directory backups
  • Encryption
  • External drives, NAS, cloud (Google Drive, SFTP, etc.)

Folders to back up

Usually:

~/Documents
~/Pictures
(or similar)
Optional: ~/.config (only if you know why)
~/Videos
~/Projects

In Deja Dup:

Folders to back up → select what you actually care about

Folders to ignore → add

~/.cache
~/.local/share/Trash
~/Downloads
(optional)

Schedule

Daily or weekly backup is usually fine

Keep backups for “forever” or at least several months

c. Prevent overlap (this matters)

To avoid wasting space and time:

Tool

Should back up

Should NOT back up

Timeshift

/, system configs

/home

Deja Dup

/home/youruser

/, system files

Never:

  • Use Deja Dup to back up /
  • Use Timeshift to back up /home

That’s the #1 mistake you could do

d. Real-world recovery scenarios

Scenario 1: Bad update / system won’t boot

  1. Boot from live USB

  2. Restore with Timeshift

  3. System is back exactly as before

  4. Files untouched

Scenario 2: Deleted or corrupted files

  1. Open Deja Dup

  2. Restore specific files/folders

  3. Done

Scenario 3: New machine / fresh install

  1. Install OS

  2. Restore system apps/settings manually or via Timeshift (if compatible)

  3. Restore home data with Deja Dup

e. Optional pro tips (to avoid data loss)

  • Test restores once (seriously)
  • Label backup drives clearly
  • Keep Deja Dup backups offsite if possible
  • After major distro upgrades:
  • Make a Timeshift snapshot
  • Don’t restore old Timeshift snapshots across major versions unless you know it’s safe
     

4. Back In Time – More Control features tool to create GUI-Based backups on Linux

Best for: Advanced users who want flexibility

Available on: Most Linux distributions

Back In Time uses RSYNC but wraps it in a friendly GUI.

Key Features

  • Scheduled snapshots
  • Exclude files and folders easily
  • Restore files from any snapshot
  • Supports local and remote backups
     

# apt-cache search backintime


backintime-common – simple backup/snapshot system (common files)
# apt info backintime-qt
Package: backintime-qt
Version: 1.3.3-4
Priority: optional
Section: utils
Source: backintime
Maintainer: Jonathan Wiltshire <jmw@debian.org>
Installed-Size: 416 kB
Depends: backintime-common (= 1.3.3-4), libnotify-bin, pkexec, polkitd, python3-dbus.mainloop.pyqt5, python3-pyqt5, x11-utils, python3:any
Recommends: python3-secretstorage
Suggests: meld | kompare
Conflicts: backintime-kde4
Breaks: backintime-qt4 (<< 1.2.1-0.1~)
Replaces: backintime-kde4, backintime-qt4 (<< 1.2.1-0.1~)
Homepage: https://github.com/bit-team/backintime
Download-Size: 73.8 kB
APT-Sources: http://ftp.debian.org/debian bookworm/main amd64 Packages
Description: simple backup/snapshot system (graphical interface)
 Back In Time is a framework for rsync and cron for the purpose of
 taking snapshots and backups of specified folders. It minimizes disk space use
 by taking a snapshot only if the directory has been changed, and hard links
 for unmodified files if it has. The user can schedule regular backups using
 cron.
 .
 This is the graphical interface for Back In Time.

backintime-qt – simple backup/snapshot system (graphical interface)

# apt install backintime-qt

$ sudo backintime-qt

backintime-linux-backup-gui-easy-tool-screenshot-options

linux-gui-backup-tools-screenshot/backintime-linux-backup-gui-easy-tool-screenshot-options

backintime-linux-screenshot-options-menu

backintime-linux-screenshot-options3

linux-gui-backup-tools-screenshot

It’s slightly more complex than Déjà Dup, but still very manageable.
 

5. Backing Up your Data on Linux with Grsync (rsync GUI frontend backup tool interface)

Grsync is a simple yet powerful graphical tool for backing up data on Linux. It acts as a front-end for rsync, one of the most trusted file synchronization utilities in the Linux world, but removes the need to remember long command-line options. This makes Grsync ideal for users who want reliable backups without extra complexity.

grsync-gui-backup-rsync-tool-linux-screenshot1

With Grsync, you can easily select a source and destination folder, such as backing up your home directory to an external drive or a network location. It supports incremental backups, meaning only changed files are copied after the first run, which saves both time and disk space. Useful options like preserving file permissions, deleting obsolete files, and excluding specific directories (for example, cache or temporary files) can be enabled with simple checkboxes.

Another advantage of Grsync is its safety features. You can perform a dry run to preview what will be copied or deleted before actually starting the backup. This reduces the risk of accidental data loss and makes it easier to fine-tune your backup settings. For Linux users looking for a practical and dependable backup solution, Grsync offers a great balance between power and ease of use.
 

Best Backup Strategy for Desktop Linux Users

For most users, Deja Dup + TimeShift  combo should works perfectly:

  • Déjà Dup → Personal files (documents, photos, videos)
  • Timeshift → System snapshots

This way, you’re protected from both data loss and system failure.

Final Thoughts

Linux gives you freedom – and that includes freedom to choose how you protect your data.

With modern GUI backup tools, there’s no excuse not to back up regularly. Whether you’re a casual user or a hardcore PC freak, setting up backups takes just a few minutes and can save you hours (or days) of frustration later.

If you’re serious about your Linux system data,
backup early, backup often and you this 

will pay you back.

How to Deploy Central DNS on Linux with 3 Authoritative Servers and 1 Recursive Cache

Friday, December 19th, 2025

unbound-centrall-dns-deployment-3-linux-authoritative-servers-and-1-caching-DNS

Centralized DNS is one of those services that must be always UP, predictable, and fast. When it isn’t, everything breaks in strange and unpleasant ways.

This article describes a robust central DNS architecture for Linux environments using:

  • 3 authoritative DNS servers
  • 1 dedicated caching resolver
  • Clear separation between authoritative and recursive roles

Architecture Overview

Roles

Server

Role

Purpose

dns-auth-01

Authoritative

Primary (master)

dns-auth-02

Authoritative

Secondary (slave)

dns-auth-03

Authoritative

Secondary (slave)

dns-cache-01

Recursive / Cache

Internal resolution

Why Separate Roles?

Authoritative and recursive DNS have very different workloads:

  • Authoritative DNS: predictable, zone-based, read-only
  • Recursive DNS: bursty, cache-heavy, user-facing

Mixing them increases attack surface, complexity, and failure impact.

Software Choices

Recommended stack:

  • BIND9 or NSD for authoritative servers
  • Unbound for caching/recursive resolver

Reasons:

  • Mature, well-understood behavior
  • Clear separation of responsibilities
  • Excellent Linux support
  • Scriptable and observable

Network Layout

Example internal layout:

10.0.0.10   dns-auth-01 (master)

10.0.0.11   dns-auth-02 (slave)

10.0.0.12   dns-auth-03 (slave)

10.0.0.20   dns-cache-01 (recursive)

All Linux servers point only to dns-cache-01 as their resolver.

Authoritative DNS Configuration

Master Server (dns-auth-01)

Zones are managed only on the master.

Example BIND zone definition:

zone "example.internal" {

    type master;

    file "/etc/bind/zones/example.internal.zone";

    allow-transfer { 10.0.0.11; 10.0.0.12; };

    also-notify { 10.0.0.11; 10.0.0.12; };

};

Key points:

  • Zone transfers restricted by IP
  • NOTIFY enabled for fast propagation
  • No recursion enabled

Disable recursion:

options {

    recursion no;

    allow-query { any; };

};

Slave Servers (dns-auth-02 / dns-auth-03)

Example configuration:

zone "example.internal" {

    type slave;

    masters { 10.0.0.10; };

    file "/var/cache/bind/example.internal.zone";

};

Slaves:

  • Never edited manually
  • Automatically sync zones
  • Serve as HA and load distribution

Caching Resolver (dns-cache-01)

Use Unbound as a dedicated recursive resolver.

Unbound Configuration

Minimal but effective setup:

server:

    interface: 0.0.0.0

    access-control: 10.0.0.0/24 allow

    do-ip6: no

    hide-identity: yes

    hide-version: yes

    prefetch: yes

    cache-min-ttl: 300

    cache-max-ttl: 86400

Forward Internal Zones to Authoritative Servers

forward-zone:

    name: "example.internal"

    forward-addr: 10.0.0.10

    forward-addr: 10.0.0.11

    forward-addr: 10.0.0.12

External Resolution

Either:

  • Use root hints (recommended for independence)
  • Or forward to trusted upstream resolvers

Example:

forward-zone:

    name: "."

    forward-addr: 9.9.9.9

    forward-addr: 1.1.1.1

Client Configuration

All Linux servers use the caching resolver only:

/etc/resolv.conf

nameserver 10.0.0.20

Or via systemd-resolved:

# resolvectl dns eth0 10.0.0.20

Clients never query authoritative servers directly.

High Availability Considerations

Resolver Redundancy

For production environments:

  • Deploy two caching resolvers
  • Use DHCP or systemd-resolved fallback ordering

Example:

nameserver 10.0.0.20

nameserver 10.0.0.21

Zone Management

  • Store zone files in Git
  • Increment SOA serials automatically
  • Deploy via CI/CD or Ansible

DNS changes should be auditable, not ad-hoc.

Security Hardening

Minimum recommendations:

  • No recursion on authoritative servers
  • Firewall restricts TCP/UDP 53
  • TSIG for zone transfers (optional but recommended)
  • Disable version disclosure
  • Monitor query rates

Monitoring & Validation

Useful tools:

  • dig +trace
  • unbound-control stats
  • rndc status
  • Prometheus exporters for BIND/Unbound

DNS that isn’t monitored will fail silently.

Final Thoughts

This setup scales well, is easy to reason about, and avoids the most common DNS mistakes:

  • Mixing recursive and authoritative roles
  • Letting clients query everything directly
  • Overcomplicating zone management

DNS should be boring.
If it’s exciting, something is wrong.

Optimizing Linux Server Performance Through Digital Minimalism and Running Services and System Cleanup

Friday, October 3rd, 2025

linux-logo-optimizing-linux-server-performance-digital-minimalism-software-cleanup

In today’s landscape of bloated software stacks, automated dependency chains, and background services that consume memory and CPU without notice, Linux system administrators and enthusiasts alike benefit greatly from embracing digital minimalism of what is setup on the server and to reduce it to the absolute minimum.

Digital minimalism in the context of Linux servers means removing what you don't need, disabling what you don't use, and optimizing what remains — all with the goal of increasing performance, improving security, and simplifying further maintenance.
In this article, we’ll walk through practical steps to declutter your Linux server, optimize resources, and regain control over what’s running and why.

1. Identify and Remove Unnecessary Packages

Over time, many systems accumulate unused packages — either from experiments, dependency installations, or unnecessary defaults.

On Debian/Ubuntu

Find orphaned packages:
 

# apt autoremove --dry-run


Remove unnecessary packages:
 

# apt autoremove
# apt purge <package-name>


List large installed packages:

# dpkg-query -Wf '${Installed-Size}\t${Package}\n' | sort -n | tail -n 20


On RHEL/CentOS/AlmaLinux:

Find orphaned packages:

# dnf autoremove

List packages sorted by size:

# rpm -qia --qf '%{SIZE}\t%{NAME}\n' | sort -n | tail -n 20


2. Audit and Disable Unused Services
 

Every running service consumes memory, CPU cycles, and opens potential attack surfaces.

List enabled services:
 

# systemctl list-unit-files --type=service --state=enabled

See currently running services:

# systemctl --type=service –state=running

Put some good effort to review and disable all unnecesssery


Disable unneeded services :

# systemctl disable --now bluetooth.service
# systemctl disable --now cups.service
# systemctl disable --now ModemManager.service

And so on

Useful services to disable (if unused):
 

Service

Purpose

When to Disable

cups.service

Printer daemon

On headless servers

bluetooth.service

Bluetooth stack

On servers without Bluetooth

avahi-daemon

mDNS/Zeroconf

Not needed on most servers

ModemManager

Modem management

If not using 3G/4G cards

NetworkManager

Dynamic net config

Prefer systemd-networkd for static setups


Simple Shell Script to List & Review Services
 

#!/bin/bash
echo "Enabled services:"
systemctl list-unit-files --state=enabled | grep service
echo ""
echo "Running services:"
systemctl --type=service --state=running

3. Optimize Startup and Boot Time

Analyze system boot performance:

# systemd-analyze

View which services take the longest:

# systemd-analyze blame
min 25.852s certbot.service
5min 20.466s logrotate.service
1min 29.748s plocate-updatedb.service
54.595s php5.6-fpm.service
43.445s systemd-logind.service
42.837s e2scrub_reap.service
37.915s apt-daily.service
35.604s mariadb.service
31.509s man-db.service
27.405s systemd-journal-flush.service
18.357s ifupdown-pre.service
14.672s dev-xvda2.device
13.523s rc-local.service
11.024s dpkg-db-backup.service
9.871s systemd-sysusers.service
...


Disable or mask long-running services that are not essential.


Why services masking is important?


Simply because after some of consequential updates, some unwanted service daemon might start up with the system boot.

Example:
 

# systemctl mask lvm2-monitor.service


4. Reduce Memory Usage (Especially on Low-RAM VPS)
 

Monitor memory usage:

# free -h
# top
# htop

Use lightweight alternatives:

Service

Heavy

Lightweight Alternative

Web server

Apache

Nginx / Caddy / Lighttpd

Database

MySQL

MariaDB / SQLite (if local)

Syslog

rsyslog

busybox syslog / systemd journal

Shell

bash

dash / ash

File manager

GNOME Files

mc / ranger (CLI)


5. Configure Swap (Only If Needed)
 

Having too much or too little swap can affect performance.


Check if swap is active:

# swapon --show


Create swap file (if needed):

# fallocate -l 1G /swapfile
# chmod 600 /swapfile
# mkswap /swapfile
# swapon /swapfile

Add to /etc/fstab for persistence:

/swapfile none swap sw 0 0

6. Clean Up Cron Jobs and Timers

Old scheduled tasks can silently run in the background and consume resources.

List user cron jobs:

crontab -l

Check system-wide cron jobs:

# ls /etc/cron.*
# ls -al /var/spool/cron/*


List systemd timers:

# systemctl list-timers


Disable any unneeded timers or outdated cron entries.

7. Optimize Logging and Log Rotation

Logs are essential but can grow large and fill up disk space quickly.

Check log size:

# du -sh /var/log/*

Force logrotate:
 

# logrotate -f /etc/logrotate.conf

Edit /etc/logrotate.conf or specific files in /etc/logrotate.d/* to reduce retention if needed.

8. Check for Zombie Processes and Old Users

Old users and zombie processes can indicate neglected cleanup or the server is (cracked) hacked.

List users:
 

cat /etc/passwd | cut -d: -f1

Remove unused accounts:
 

# userdel -r username


Check for zombie processes:
 

# ps aux | awk '{ if ($8 == "Z") print $0; }'

9. Disable IPv6 (if not used)

IPv6 can add unnecessary complexity and attack surface if you’re not using it.

To disable IPv6 temporarily:

# sysctl -w net.ipv6.conf.all.disable_ipv6=1
# sysctl -w net.ipv6.conf.default.disable_ipv6=1

To disable permanently, add to /etc/sysctl.conf:

net.ipv6.conf.all.disable_ipv6 = 1
net.ipv6.conf.default.disable_ipv6 = 1


10. Final Thoughts: Less Is More

Digital minimalism is not just a personal tech trend — it's a philosophy of clarity, performance, and security. Every running process is a potential vulnerability. Every megabyte of RAM consumed by a useless service is wasted capacity. Every package installed increases the system’s complexity.

By regularly auditing, pruning, and simplifying your Linux server, you not only improve its performance and reliability, but you also reduce future maintenance headaches.

Minimalism = Maintainability.

Implementing and using gssproxy, example guide on how to use it to authenticate ssh, samba, nfs with no password via kerberos protocol

Friday, September 26th, 2025

Implementing and using gssproxy, example guide on how to use it to authenticate ssh, samba, nfs with no password via kerberos protocol

GSS-Proxy is a daemon that safely performs GSSAPI (Kerberos) operations on behalf of other processes. It’s useful when services running as unprivileged users need to accept or initiate Kerberos GSSAPI authentication but shouldn’t hold or access long‑lived keys (keytabs) or raw credentials themselves. Typical users: OpenSSH, SSSD, Samba, NFS idmap, and custom daemons.

This article walks through what gssproxy does, how it works, how to install and configure it, example integrations (sshd and an unprivileged service), testing, debugging and common pitfalls.
 

1. What gssproxy does (quick conceptual summary)
 

  • Runs as a privileged system daemon (typically root) and holds access to keytabs or system credentials.
  • Exposes a local IPC (Unix socket) and controlled API so allowed clients can ask it to perform GSSAPI accept/init operations on their behalf.
  • Enforces access controls by client PID/user and by named service configuration (you map a client identity to the allowed service name and keytab).
  • Minimizes the need to distribute keytabs or give services direct access to Kerberos credentials.
     

2. Installation

On many modern Linux distributions (Fedora, RHEL/CentOS, Debian/Ubuntu) gssproxy is packaged.

Example (RHEL/Fedora/CentOS):

# RHEL/CentOS 7/8/9 (dnf or yum)


sudo dnf install gssproxy


# or


sudo yum install gssproxy

Example (Debian/Ubuntu):

sudo apt update

sudo apt install gssproxy

If you must build from source:

# get source, then typical autotools or meson/ninja workflow per upstream README

./configure

make

sudo make install


After install, systemd unit gssproxy.service should be available.
 

3. Main configuration concepts

The main config file is usually /etc/gssproxy/gssproxy.conf. It consists of mechs (mechanisms), services, clients, and possibly mappings. Key elements:

  • mech: declares a GSSAPI mechanism (e.g., krb5) and default keytab(s) for acceptor credentials.
  • service: logical service names (e.g., ssh, nfs, httpd) with attributes: user (the Unix user running the service), keytab, cred_store, mechs, and whether the service is allowed to be client (initiate) and/or server (accept).
  • client: rules mapping local client sockets / users / pids to allowed services.

A minimal working example that allows sshd to use gssproxy:

mechs = {

    krb5_mech = {

        mech = krb5;

        default_keytab = /etc/krb5.keytab;

    };

};


services = {

    ssh = {

        mech = krb5_mech;

        user = "sshd";

        keytab = /etc/krb5.keytab;

        # allow both acceptor (server) and initiator (client) ops if needed

        client = yes;

        server = yes;

    };

};

Client rules are often implicit: gssproxy can enforce that calls on a given service socket originate from the configured Unix user. For more complex setups you add policy and client blocks. Example to allow a specific PID or user to use the ssh service:

clients = {

    ssh_clients = {

        clients = [

            { match = "uid:0" },      # root can ask for ssh service

            { match = "user:sshd" },  # or the sshd user

        ];

        service = "ssh";

    };

};

Paths and sockets: gssproxy listens on a socket (e.g. /var/run/gssproxy/socket) and possibly per-user sockets (e.g. /run/gssproxy/uid_1000). The systemd unit usually creates the runtime directory with correct permissions.
 

4. Example: Integrate with OpenSSH server (sshd)

Goal: allow sshd and session processes to accept delegated GSS credentials and let unprivileged child processes use those credentials via gssproxy.

Server side config

  1. Ensure sshd is built/installed with GSSAPI support. On SSH server:

    • In /etc/ssh/sshd_config:
    • GSSAPIAuthentication yes
    • GSSAPICleanupCredentials yes
    • GSSAPIKeyExchange yes        # optional: if you want GSS key exchange
  2. Configure gssproxy with an ssh service entry pointing to the host keytab (so gssproxy can accept SPNEGO/kerberos accept_sec_context calls):

mechs = {

    krb5 = {

        mech = krb5;

        default_keytab = /etc/krb5.keytab;

    };

};


services = {

    ssh = {

        mech = krb5;

        user = "sshd";

        keytab = /etc/krb5.keytab;

        server = yes;

        client = yes;

    };

};

  1. Ensure /etc/krb5.keytab contains the host principal host/fqdn@REALM (or host/short@REALM depending on SPN strategy). Use ktutil or kadmin to create/populate.
  2. Restart gssproxy and sshd:

sudo systemctl restart gssproxy

sudo systemctl restart sshd

Client side

  • ssh client configuration (usually ~/.ssh/config or /etc/ssh/ssh_config):

Host myhost.example.com

    GSSAPIAuthentication yes

    GSSAPIDelegateCredentials yes

Client must have a TGT in the credential cache (kinit user), or use a client that acquires one.

Result

When the client initiates GSSAPI authentication and delegates credentials (GSSAPIDelegateCredentials yes or -K for older OpenSSH), gssproxy on the server handles acceptor functions. If a session process needs to use the delegated credentials (e.g., to access network resources as that user), gssproxy arranges a per-session credential store that unprivileged processes can use via the kernel keyring or other mechanisms gssproxy supports.
 

5. Example: Allow an unprivileged service to acquire initiator creds via gssproxy

Suppose a service mydaemon runs as myuser and needs to initiate Kerberos-authenticated connections using a specific service principal stored in /etc/mydaemon.keytab but you don’t want to expose that keytab to myuser.

Add a mech and service:

mechs = {

    krb5 = {

        mech = krb5;

        default_keytab = /etc/krb5.keytab;

    };

    mydaemon_mech = {

        mech = krb5;

        default_keytab = /etc/mydaemon.keytab;

    };

};


services = {

    mydaemon = {

        mech = mydaemon_mech;

        user = "myuser";

        keytab = /etc/mydaemon.keytab;

        client = yes;    # allow initiator operations

        server = no;

    };

};

Configure a client mapping so the mydaemon process (uid myuser) is allowed to use the mydaemon service. Once gssproxy runs, mydaemon uses the gssapi libraries (GSSAPI libs detect gssproxy via environment or library probe) and calls the GSSAPI functions; gssproxy will perform gss_acquire_cred using /etc/mydaemon.keytab and return a handle to the calling process. The service itself never directly reads the keytab.
 

6. Testing and tools

  • kinit / klist: manage and list Kerberos TGTs on clients.
  • journalctl -u gssproxy -f (or systemctl status gssproxy) to watch logs.
  • ss -l or ls -l /run/gssproxy to inspect sockets.
  • If you have gssproxy command-line utilities installed (may vary by distro), some installations include gssproxy CLI helpers. Otherwise use the service that relies on gssproxy and watch logs.

Example basic tests:

  1. Ensure gssproxy is running:

sudo systemctl status gssproxy

  1. On server, check socket and permissions:

sudo ls -l /run/gssproxy

# or

sudo ss -x -a | grep gssproxy

  1. Attempt SSH from a client with a TGT:

kinit alice

ssh -o GSSAPIDelegateCredentials=yes alice@server.example.com

# then on server, check journalctl logs for gssproxy/sshd messages
 

7. Debugging tips

  • Journal logs: journalctl -u gssproxy -xe will be your first stop.
  • Permissions: Ensure that gssproxy can read the keytab(s) (typically root-owned with restrictive perms). In config you may point to a keytab readable only by gssproxy.
  • Clients blocked: If a client is denied, check the clients block and match rules (uid/pid/user).
  • Keytab issues: Use klist -k /etc/krb5.keytab to list principals in a keytab. Ensure correct SPN and realm.
  • Clock skew: Kerberos is time-sensitive. Ensure NTP/chrony is working.
  • DNS / SPNs: Ensure hostnames and reverse DNS match the principal names expected for the service.
  • SSHD integration: If sshd still complains it can’t accept GSSAPI creds, enable debug logging (LogLevel DEBUG), and check gssproxy logs.
  • SELinux: On SELinux-enabled systems, you may need to ensure file contexts and SELinux policies allow gssproxy to access keytabs and sockets. Check audit.log for AVC denials and use semanage fcontext/restorecon or local policy modules when needed.
     

8. Common pitfalls & best practices

  • Don’t expose keytabs to unprivileged users. Let gssproxy hold them.
  • Principals & SPNs must match service hostnames used by clients. Consistent DNS is essential.
  • Minimal privileges: configure services and clients narrowly: allow only the minimum users/PIDs and only the required mech ops.
  • Rotation: when rotating keytabs, reload/restart gssproxy or send a signal if supported. Plan for keytab updates.
  • Logging: enable adequate logging during deployment and revert to normal verbosity in production.
  • Testing in staging: GSSAPI behavior across SSH clients and other daemons can be subtle — test across your client set (Linux, macOS, Windows via native Kerberos clients, etc.).
     

9. Security considerations

  • gssproxy centralizes credential access: secure the host and the gssproxy process.
  • Protect keytab files using strict filesystem permissions and (if needed) SELinux policy.
  • Restrict which local processes may request operations for a service — map by UID/PID carefully.
  • Monitor logs for unexpected use of gssproxy.
     

10. Example full config (simple)

Save as /etc/gssproxy/gssproxy.conf:

mechs = {

    krb5 = {

        mech = krb5;

        default_keytab = /etc/krb5.keytab;

    };

};


services = {

    ssh = {

        mech = krb5;

        user = "sshd";

        keytab = /etc/krb5.keytab;

        server = yes;

        client = yes;

    };


    mydaemon = {

        mech = krb5;

        user = "myuser";

        keytab = /etc/mydaemon.keytab;

        client = yes;

        server = no;

    };

};


clients = {

    allow_root_for_ssh = {

        clients = [

            { match = "uid:0" },

        ];

        service = "ssh";

    };


    mydaemon_client = {

        clients = [

            { match = "user:myuser" },

        ];

        service = "mydaemon";

    };

};

Restart: sudo systemctl restart gssproxy and then restart dependent services (sshd, mydaemon, etc.) if needed.


Useful resources for gssproxy and further integrations

  • Read your distribution’s /usr/share/doc/gssproxy/ or man pages (man gssproxy, man gssproxy.conf) — they contain distribution-specific details.
  • Check integrations: Samba/Winbind, SSSD, NFS idmap — many modern stacks support gssproxy as an option to avoid exposing keytabs to many daemons.
  • For production: automate keytab distribution, rotation and monitor gssproxy usage.


How to make for loop (cycles) in KSH useful for FreeBSD / UNIX system administrators

Friday, November 3rd, 2017

korn-shell-how-to-make-loops-easily-for-sys-admin-purposes

Sometimes we have to administrate this operating systems such as FreeBSD / AIX / HP UX or even Mac OS server where by default due to historical reasons or for security bash shell is not avialable. That's not a common scenario but it happens so if as sysadmin we need to create for loops on ksh it is useful to know how to do that, as for loop cycles are one of the most important command line tools the sysadmin swiss army knife kind of.

So how to create a for loop (cycle) in ksh (Korn Shell)?

The most basic example for a KSH loop shell is below:
 

#!/bin/ksh
for i in 1 2 3 4 5
do
  echo "Welcome $i times"
done


Add the content to any file lets say ksh_loop.ksh then make it executable as you do in bash shells


$ chmod +x ksh_loop.ksh
$ ksh ksh_loop.ksh


The overall syntax of the for loop ksh command is as follows:


for {Variable} in {lists}
do
    echo ${Variable}
done


Hence to list lets say 20 iterations in a loop in ksh you can use something like:
 

#!/bin/ksh
for i in {1..20}
do
  echo "Just a simple echo Command $i times";
# add whatever system commands you like here
done


Example for some useful example with KSH loop is to list a directory content so you can execute whatever command you need on each of the files or directories inside


#!/bin/ksh
for f in $(ls /tmp/*)
do
        print "Iterating whatever command you like on /tmp dir : $f"
done


Other useful for loop iteration would be to print a file content line by line just like it is done in bash shell, you can do that with a small loop like belows:


#!/bin/ksh
for iteration_variable in $(cat  file_with-your-loved-content-to-iterate.txt)
do
        print "Current iteration like is : $iteration_variable"
done


Optimizing Linux TCP/IP Networking to increase Linux Servers Performance

Tuesday, April 8th, 2008

optimize-linux-servers-for-network-performance-to-increase-speed-and-decrease-hardware-costs-_tyan-exhibits-hpc-optimized-server-platforms-featuring-intel-xeon-processor-e7-4800-v3-e5-2600-supercomputing-15_full

Some time ago I thought of ways to optimize my Linux Servers network performance.

Even though there are plenty of nice articles on the topic on how to better optimize Linux server performance by tunning up the kernel sysctl (variables).

Many of the articles I found was not structed in enough understandable way so I decided togoogle around and  found few interesting websites which gives a good overview on how one can speed up a bit and decrease overall server loads by simply tuning few basic kernel sysctl variables.

Below article is a product of my research on the topic on how to increase my GNU / Linux servers performance which are mostly running LAMP (Linux / Apache / MySQL / PHP) together with Qmail mail servers.

The article is focusing on Networking as networking is usual bottleneck for performance.
Below are the variables I found useful for optimizing the Linux kernel Network stack.

Implementing the variables might reduce your server load or if not decrease server load times and CPU utilization, they would at lease increase thoroughput so more users will be able to access your servers with (hopefully) less interruptions.
That of course would save you some Hardware costs and raise up your Servers efficiency.

Here are the variables themselves and some good example:
 

# values.net.ipv4.ip_forward = 0 ( Turn off IP Forwarding )

net.ipv4.conf.default.rp_filter = 1

# ( Control Source route verification )
net.ipv4.conf.default.accept_redirects = 0

# ( Disable ICMP redirects )
net.ipv4.conf.all.accept_redirects = 0 ( same as above )
net.ipv4.conf.default.accept_source_route = 0

# ( Disable IP source routing )
net.ipv4.conf.all.accept_source_route = 0
( - || - )net.ipv4.tcp_fin_timeout = 40

# ( Decrease FIN timeout ) - Useful on busy/high load
serversnet.ipv4.tcp_keepalive_time = 4000 ( keepalive tcp timeout )
net.core.rmem_default = 786426 - Receive memory stack size ( a good idea to increase it if your server receives big files )
net.ipv4.tcp_rmem = "4096 87380 4194304"
net.core.wmem_default = 8388608 ( Reserved Memory per connection )
net.core.wmem_max = 8388608
net.core.optmem_max = 40960
( maximum amount of option memory buffers )

# like a homework investigate by yourself what the variables below stand for :)
net.ipv4.tcp_max_tw_buckets = 360000
net.ipv4.tcp_reordering = 5
net.core.hot_list_length = 256
net.core.netdev_max_backlog = 1024


# Below are newly added experimental
#net.core.rmem_max = 16777216
#net.core.wmem_max = 16777216
##kernel.msgmni = 1024
##kernel.sem = 250 256000 32 1024
##vm.swappiness=0
kernel.sched_migration_cost=5000000


Also a good sysctl.conf file which one might want to substitite or use as a skele for some productive server is ready for download here


Even if you can't reap out great CPU reduction benefits from integrating above values or similar ones, your overall LAMP performance to end customers should increase – at some occasions dramatically, at others little bit but still noticable.

If you're unsure on exact kernel variable values to use check yourself what should be the best values that fits you according to your server Hardware – usually this is done by experimenting and reading the kernel documentation as provided for each one of uplisted variables.

Above sysctl.conf is natively created to run on Debian and on other distributions like CentOS, Fedora Slackware some values might either require slight modifications.

Hope this helps and gives you some idea of how network optimization in Linux is usually done. Happy (hacking) tweakening !

Useful abbreviations for people working in Corporations like HP, IBM and Dell – Things New Comer should know on company onboarding time

Friday, January 23rd, 2015

useful-abbreviations-for-new-comers-things-to-know-on-onboarding-period-in-huge-corporations-as-HP-IBM-Apple
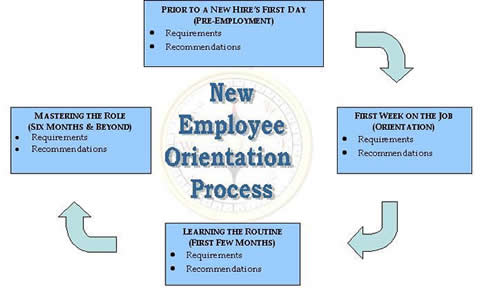
If you have worked in a small or middle sized company and you're offered work into some of the top 100 world corporations, prepare yourself for some shocking 3 to 6 months depending on the company. This period in which you will be introduced to the company's field of business and way of work is called in corporate terms OnBoarding period.  Even if everything looks to complicated and obscure, don't be quick to loose yourself or desperate as this is just a new beginning and as any new beginning it is hard. However once you're acquainted with basics it will be much easier for you.

After all most of the new things you will learn in Corporate Environment are just the good old ones you know already packaged under a different wrapper. You will be introduced to many portals, client names, have to watch a lot of  "brain-dead" trainings, which told you basics on Corporation and its client essentials, be offered ways to advance, have to request Accounts and Credentials to servers via some obscure procedures, which change all the time, so it is likely the procedures you have to follow to get the necessery network / server accesses will be a procedure different from the one your colleagues followed few years ago, thus probably you will have to do account requests for a first time.  In this on-boarding time you will deal with a lot of trainings teaching you to be ethical, respect your co-workers, learn basics of inter-cultural awareness and learn to get responsibility for your actions and some specific training regarding the job position (job description) you have.

onboarding-color-diagram-yellow-red-green-blue-onboarding-corporation-best-pracices-and-advises

You have to be patient and non-judgemental and ready to accept situation as it is and not be angry that so many people doesn't have idea on what is happening. Also it is a good start-up corporate advice to respect people's knowledge, don't thing that you're too knowledgable, as you will be amazed that there are a lot of people in huge companies which have better understanding and knowledge on tech than you. Also realize, the confusion that is taking place in Huge companies "The Right hand doesn't know what the left hand is doing", as our CCL Kalin used to say. The corporate world is a world where way of work is very different from tiny companies, you will have a chain of managers on top of you. The huge companies world is a world of big fish players ..

onboarding_to-big-company-howto-cycle_diagram

It is normal that in the first weeks / months you feel overwhelmed because of too much information and all looks too difficult, however just don't worry and go on. Now all is hard but in a few months everything comes to place and you realize in reality all is easy and it just seems hard in the beginning.

It is a good thing that you use the "Induction" / Onboarding period of first few months to find to make as many contacts as possible as this will be of a great help in your later job time. Get in contact with people from Database / Database and Storage / Load Balancers / Networking / Firewall Teams / Managers / Delivery Leads – the rule here is the more, the better.  If you want to grow in the company's scale making social contacts is even more important than being a hard-worker. If you have friends in management of company and you do your work well and try to be proactive, sooner or later your managers will notice this and will recommend you for some kind of manager position.

employee_onboarding_process-in-large-companies-visualized-pic

Here's few abbreviation meanings, you will have to learn if you will have to work some kind of system administration or support work for a Hewlett Packard.

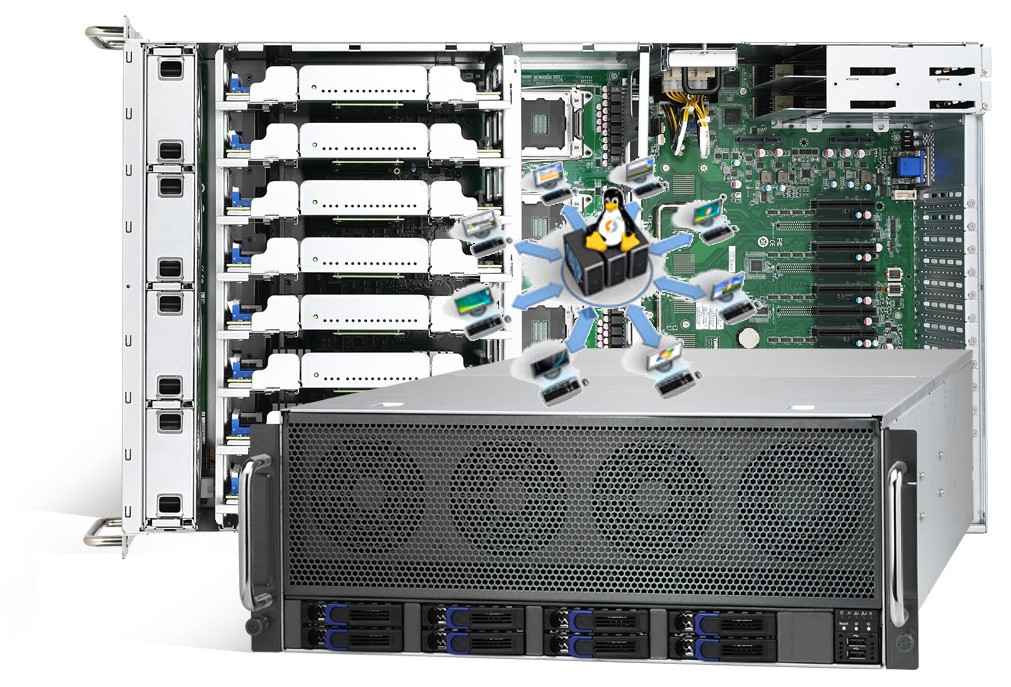
Microsoft Products – For people coming from Linux / UNIX background, the induction (onboarding) period into a large corporation is even more complicated because if you have been accustomed to using Open Source OS and tools in large corporations you will probably have to do a lot of things with proprietary tools which are hard to run on Linux / *nix, therefore it is good practice if you intend to work for Biggest Organizations in the world to get used to either running a MS Windows 7 / 8 into a Virtualbox or VMWare or get used to using Windows as a Desktop environment. Once you enter the huge organization it is likely you're handed in with your working notebook, shipped with a Customized Windows install to work well with the corporation where you're onboarding. However companies like HP did a great job, because they offer Ubuntu / Debian / Scientific Linux distributions tailored with most tools you will need for normal daily work, so it is not necessery to use Windows (though I find it personally much easier) to use Windows as  desktop nowadays.
I really don't like running 20% of applications in Virtual Machines and doing occasional work-arounds to make things work. After all life is complex enough …


Microsoft Lync Communicator – This is the defacto standard program still used in corporation for internal VoIP / Video communication , One of coolest Lync feature is Sharing Screen. At any time you can share your screen (thing like you have installed teamviewer), give-control to remote party, you can share screen between multiple people and it is pretty much like a shared desktop conference, really useful! However sometimes when Internet is slow or network is failing occasionally MS Lync gives worse results than TeamViewer, so having TeamViewer just in case is useful too. Lync works making the VoIP connection by using some Exchange Mail server integration.

MS (Outlook) Calendar – Calendar is one of the top things you have to know to organize meetings with clients and colleagues to discuss various project aspects, server problems or just ask a question your Solution Designer regarding some server Environment designed by him .

MS Outlook – All mail communication is primary using Outlook Express, you can add Tasks, Contacts and set Calendar meetings with it. If you're like me and coming from UNIX world and get used too much to Mozilla Thunderbird, you will be in big shock until you get used to work with Outlook, not that it is difficult but it is quite different from Thunderbird. For efficient work with Outlook Mail you will have to learn creating Outlook Filters and Outlook Mail backups as often mailbox is just 1 or2G  and mailbox fills in for a year time.

Monitoring Software IBM Netcool or something a like – Servers and services will be monitored with some kind of tool whose basics you will have to learn, if you have worked with Monit / Nagios or Munin you will quickly grasp the basic concept

MS Office / MS Project – You need Word and Excel quite often and for sysadmins this is very irritating. All office and client documents will be exchanged in Word and Excel format, if you're a Project Manager you will need heavily use of Microsoft Project too which needs to be installed additionally as it does not ship by default with most MS Office / Windows installs.

MS OneNote – is a software like notepad supporting tabs and allowing to make notes which are stored to a SharePoint

SharePoint (SP) – in large companies they like placing things into Sharepoints so a lot of the documentation is found on some random sharepoints (this is like a Directory Listing Apache server) – very annoying as it is really chaotic – I don't like it.

CMO – Chief Marketing Officer

CMO – Current Mode of Operations

FMO – Future Mode of Operations

SMO – Separation Management Office / Separation Management Officer

WFH – Work From Home, mail header message aiming to report someone is going to work from his home during the day

CFO – Chief Financial Officer

CEO – Chief Execute Officer

PM – Project Manager

FCR – Firewall Change Request (Any new or old firewall rule nr. which has to be created / modified / deleted)

RTPA – Ready to Production

ORT – Operational Readiness Test (some basic tests to be made and documented), before a server is handed in to RTPA

HPSM – HP Service Manager (a ticket / change web desktop frontend)

Change – a ticket like ID and system which has to be used necessery to describe any server config / file / service modification

Ticket – A support ticket oped in case of some emergency with some server service happens

CI = Configuration Item
Instance – Any service that is running more than once on a server lets (say 2 MySQL and 2 Apache servers) running on same server on different port numbers will be 4 instances

LB = Load Balancer (Load Balancers include capabilities of Intelligent Switches are in essence routers which can balance load ovr number of hosts running different services in order to ensure traffic received to a service is balanced between members of a cluster most often they're Active and Standby. Different methods to load balance traffic exist round-robin etc., traffic to Apache / MySQL / PostgreSQL and virtually any service could be load balanced.

SD – Solution Design / Solution Designer (The person preparing the graphics and documentation for how a combination of servers environment will be operating)

MTR – Maximum Time to Repair (Maximum time to repair client service or env, lets say 2 hours / 5 / 10 hrs)

SLA = Service Level Agreement (Agreement document between Company Corporation and End customer about services / servers or any work to  be provided under what conditions and cost and time interval. In short SLA is a contract document between Corporation and customer.

Service Window – Mon – Fri 08:00 – 17:00 (The time in which server is on active support and will has to be repaired by a support team promptly if emergency occurs)

TOP Process – Turn to Production (The processes which PM follows, before project turns to production TTP).

Top Approver – The list of people involved in project which has to approve the Top process until set as completed.

DL / CCL – Delivery Lead / Collaboration Capability Lead / Client

Capability Lead – This is a job position one step behind a Team Manager. DL's goals are to help teams manage internal issues and deal with clients requests, next to doing some minor technical job. In short this position is like a Junior Manager (or a position which is held before), people emerge to Team Managers.

TDL – Technical Delivery Lead

Prod or just P env – Production environment (if many servers) or P server if it is single one

QA env – Quality Assurance (something like a testing environment or server)

UAT (User Acceptance Testing) / Test server, env – UAT is the last phase of software testing process.
During UAT, actual software users test the software to make sure it can handle required tasks in real-world scenarios, according to specifications.  UAT is also known as beta testing
Test server usually same configuration as Prod whose purpose is to test new releases before deployed to Prod environment

DNS Internal / External record – (Whether DNS is seen only in a client local network (from Internal DNS only) – its called Internal record, External record is when a hostname is resolved from all the Internet)

EMEA – Common Abbreviation for: Europe, Middle East Asia sometimes to mean Europe Middle East, Africa

DC – Data Center (location) in some address room / rack numbers etc.

SN – Serial Number (Serial number of server or hardware  component

DB – Server Database (DataGuard is Oracle Db special solution for synchronization of databases for higher Db protection)

Security Class – The levels of security of access to a server (Different countries and Unions legislation world-wide require different rules and regulations on server security).
Examples of Server security classes are: White, Grey, Black (servers). For example according to EU legislation Black servers
can only be administrated / managed by people originating from
same country as where server is physically located.

Digital Key / (Digital Certificate) / Active Identity – This is a Flash drive USB (storage) with installed digital certificate which is used to authenticate you to internel corporate network
 

PC COE – PC COE –  is a set of services and tools that has helped HP reduce its desktop computing costs by $200 million per year. HP also establishes a new organization within the HP OpenView division to market TCO solutions. From PC-COE you can install almost all proprietary software for free and use them for your daily work. The software comes with free Licensing for internal HP Use.

Junos Pulse / Remote Access to HP Network – Dynamic SSL VPN Connectivity at most companies  to access a corporate network you connect via some encrypted VPN client, some companies probably use OpenVPN.

Citrix Receiver – Citrix Receiver is the easy-to-install client software that provides access to your XenDesktop and XenApp installations. With this free download you can access applications, desktops and data easily and securely from any device, including smartphones, tablets, PCs and Macs


Above terminology is specific to HP however, most of the terminology and procedures during onboarding time (period) should be very similar or even the same for other of the Top 100 Largest Companies by Revenue such as:

IBM, Dell, E.ON, Apple, Samsung, Toyota, Daimler, Gazprom, RosNeft, Volkswagen Group, Honda, AT&T, General Motors, Allianz, LukOil, Carrefour, Siemens, BASF, Philips, Ford Motor Company, Koch Industries, Tesco, Royal Dutch Shell, BP, Chevron, Vitol,  SK Group, Verizon, General Electric, Wal-Mart Stores, Nestle etc.

Probably there are things I'm missing so, if there is something else you have learned understand during onboarding, please share it in comments!

That's it, Happy Onboarding !!! 🙂

How to convert any internet Webpage to PDF from command line on GNU/Linux

Friday, September 30th, 2011

Linux webpage html to pdf command line convertor wkhtmltopdf

If you're looking for a command line utility to generate PDF file out of any webpage located online you are looking for Wkhtmltopdf
The conversion of webpages to PDF by the tool is done using Apple's Webkit open source render.
wkhtmltopdf is something very useful for web developers, as some webpages has a requirement to produce dynamically pdfs from a remote website locations.
wkhtmltopdf is shipped with Debian Squeeze 6 and latest Ubuntu Linux versions and still not entered in Fedora and CentOS repositories.

To use wkhtmltopdf on Debian / Ubuntu distros install it via apt;

linux:~# apt-get install wkhtmltodpf
...

Next to convert a webpage of choice use cmd:

linux:~$ wkhtmltopdf www.pc-freak.net www.pc-freak.net_website.pdf
Loading page (1/2)
Printing pages (2/2)
Done

If the web page to be snapshotted in long few pages a few pages PDF will be generated by wkhtmltopdf
wkhtmltopdf also supports to create the website snapshot with a specified orientation Landscape / Portrait

-O Portrait options to it, like so:

linux:~$ wkhtmltopdf -O Portrait www.pc-freak.net www.pc-freak.net_website.pdf

wkhtmltopdf has many useful options, here are some of them:
 

  • Javascript disabling – Disable support for javascript for a website
  • Grayscale pdf generation – Generates PDf in Grayscale
  • Low quality pdf generation – Useful to shrink the output size of generated pdf size
  • Set PDF page size – (A4, Letter etc.)
  • Add zoom to the generated pdf content
  • Support for password HTTP authentication
  • Support to use the tool over a proxy
  • Generation of Table of Content based on titles (only in static version)
  • Adding of Header and Footers (only in static version)

To generate an A4 page with wkhtmltopdf:

wkhtmltopdf -s A4 www.pc-freak.net/blog/ www.pc-freak.net_blog.pdf

wkhtmltopdf looks promising but seems a bit buggy still, here is what happened when I tried to create a pdf without setting an A4 page formatting:

linux:$ wkhtmltopdf www.pc-freak.net/blog/ www.pc-freak.net_blog.pdf
Loading page (1/2)
OpenOffice path before fixup is '/usr/lib/openoffice' ] 71%
OpenOffice path is '/usr/lib/openoffice'
OpenOffice path before fixup is '/usr/lib/openoffice'
OpenOffice path is '/usr/lib/openoffice'
** (:12057): DEBUG: NP_Initialize
** (:12057): DEBUG: NP_Initialize succeeded
** (:12057): DEBUG: NP_Initialize
** (:12057): DEBUG: NP_Initialize succeeded
** (:12057): DEBUG: NP_Initialize
** (:12057): DEBUG: NP_Initialize succeeded
** (:12057): DEBUG: NP_Initialize
** (:12057): DEBUG: NP_Initialize succeeded
Printing pages (2/2)
Done
Printing pages (2/2)
Segmentation fault

Debian and Ubuntu version of wkhtmltopdf does not support TOC generation and Adding headers and footers, to support it one has to download and install the static version of wkhtmltopdf
Using the static version of the tool is also the only option for anyone on Fedora or any other RPM based Linux distro.

A collection of Useful irssi scripts

Wednesday, September 23rd, 2009

Here is a list of some useful irssi scripts I was kindly given by a friend of mine (Narf).
irssi usefulscripts END—–