Thu Mar 17 13:51:39 EET 2011
Monitoring multi core / (multiple CPUs) servers with top, tload and on Linux
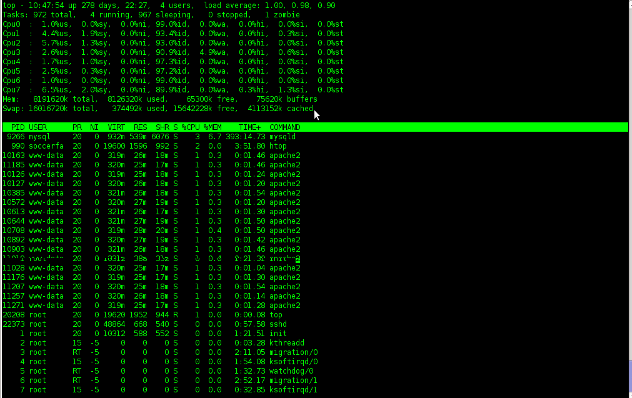
The default GNU / Linux top command does allow to see statistics on servers and systems with multiple CPUs.This is quite beneficial especially on Linux systems which are not equipped with htop which does show statistics to the multiple-core system load.
To examine the multiple CPUs statistics with the default top command available on every Linux system and part of the procps - /proc file system utilities
1. Start top:
linux:~# top
When the top system load statistics screen starts up refreshing,
2. press simply 1
You will notice all your system cpus to show up in the top head:
As I have started talking about top, a very useful way to use top to track processes which are causing a system high loads is:
linux:~# top -b -i
This command will run top in batch mode interactively and will show you statistics about the most crucial processes which does cause a server load, look over the output and you will get an idea about what is causing you server troubles.
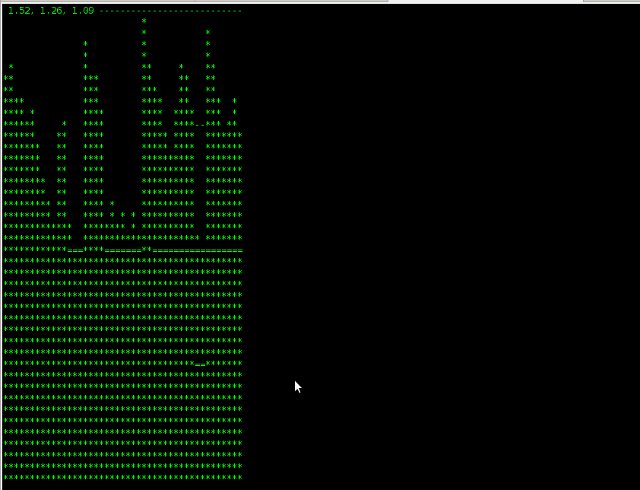
Moreover if you're a Linux console freak as me you will also probably want to take a look at tload
tload command is a part of the procps - /proc file system utilities and as you can read in the tload manual tload - graphic representation of system load average
Here is a picture to give you an idea on the console output of tload :
Another tool that you might find very usefel is slabtop it's again a part of the procps linux package.
slabtop - displays a listing of the top caches sorted by one of the listed sort criteria., in most of the cases the slabtop kernel cache monitoring tool won't be necessary for the regular administrator, however on some servers it might help up to the administrator to resolve performance issues which are caused by the kernel as a bottleneck.
slabtop is also used as a tool by kernel developers to write and debug the Linux kernel.