Tue Oct 4 14:01:41 EEST 2011
Monitor General Server / Desktop system health in console on Linux
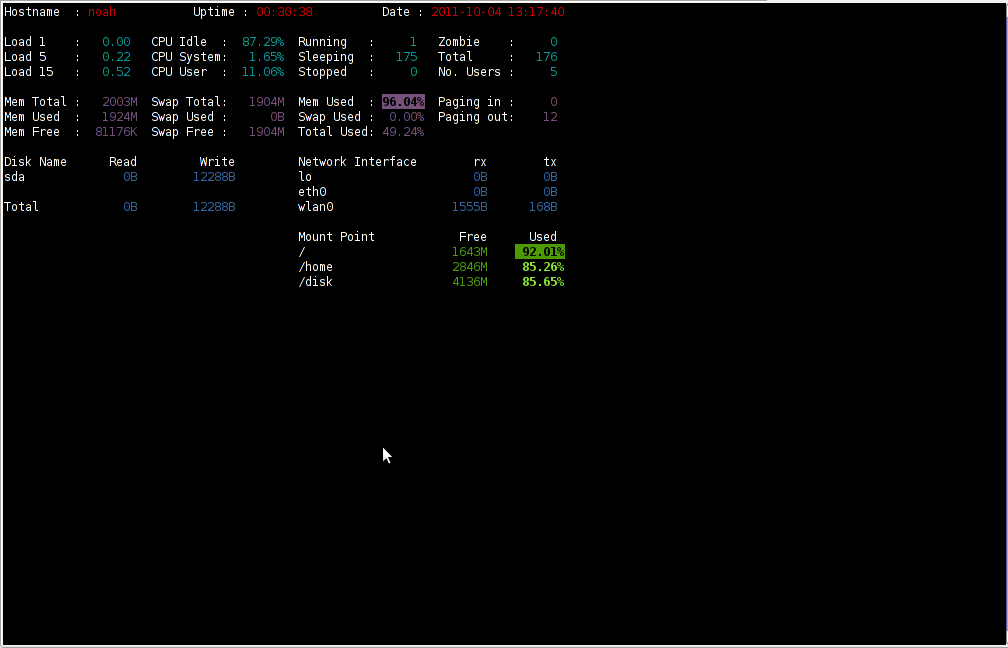
saidar is a text based ncurses program to display live statistics about general system health.It displays in one refreshable screen (similar to top) statistics about server state of:
CPU, Load, Memory, Swap, Network, I/O disk operations
Besides that saidar supports a ncurses console colors, which makes it more funny to look at.
Saidar extracts the statistics for system state based on libgstrap cross platform statistics library about pc system health.
On Debian, Ubuntu, Fedora, CentOS Linuxes saider is available for install straight from distribution repositories.
On Debian and Ubuntu saidar is installed with cmd:
debian:~# apt-get install saidar

...
On CentOS and Fedora saidar is bundled as a part of statgrab-tools rpm package.
Installing it on 64 bit CentOS with yum is with command:
[root@centos ~]# yum install
statgrab-tools.x86_64
Saidar is also available on FreeBSD as a part of the /usr/ports/devel/libgstrab, hence to use on my FreeBSD I had to install the libgstrab port:
freebsd# cd /usr/ports/devel/libstatgrab

freebsd# make install clean
Here is saidar running on my Desktop Debian on Thinkpad in color output:
debian:~# saidar -c
I've seen many people, who use various shell scripts to output system monitoring information, this scripts however are often written to just run without efficiency in mind and they put some let's say 1% extra load on the system CPU. This is not the case with saidar which is written in C and hence the program is optimized well for what it does.