The times of the Second Coming of Jesus Christ seem to be really near, this is clear from the facts that the corruption and people's degradation has reached a state, where no truthfulness is existing neither in the worldly organizations Countries, governments, parliaments, courts, institutions, companies and even in the Most Holy Church of Christ which he has consecrated by his Holy Blood, through the Crucifixion and Death on the Cross for our sins.
It seems today, neither the low ordinary people neither the high and eligible and most honored Bishops and even Metropolitans are in a such a bad careless state, that they only care about their own wordly interests and the interests of a few of other servitudes nearby, neglecting the interest of the Holy Church of Christ (which is the Assembly of believers in the Lord Christ Jesus, who breath and live being in the world but , “My kingdom is not of this world. If My kingdom were of this world, My servants would fight, so that I should not be delivered to the Jews; but now My kingdom is not from here.” John 18:36.
What happens now about 2000 years, later in Christ Church is absotely the same. Just like Jesus, his true followers has been rejected to be accepted by his own people. In same way his true people are always, being rejected to take their ruling place, but instead in the world the Lies and manipulations are taking place to crucify the true servents of God.
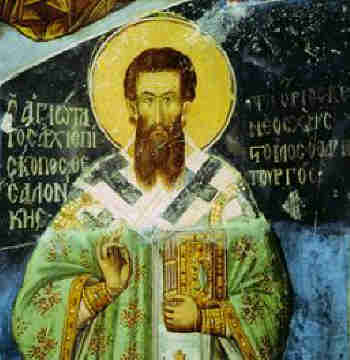
The Holy Gospel seems to repeat itself again and again all the time through the ages. This time the stage is different this is not ancient Israel with the Assembly of Synodrion and the Old Testament's Church of God and his People the Israelites. But the Holy Synod of the Bulgarian Church and the Bulgarian Orthodox Church with his people the new Israel the Christians.
Get to know the facts on Bulgarian Church Scandal Escalasion for New Metropolitan of Sliven voting – situation as of 24th April 2024
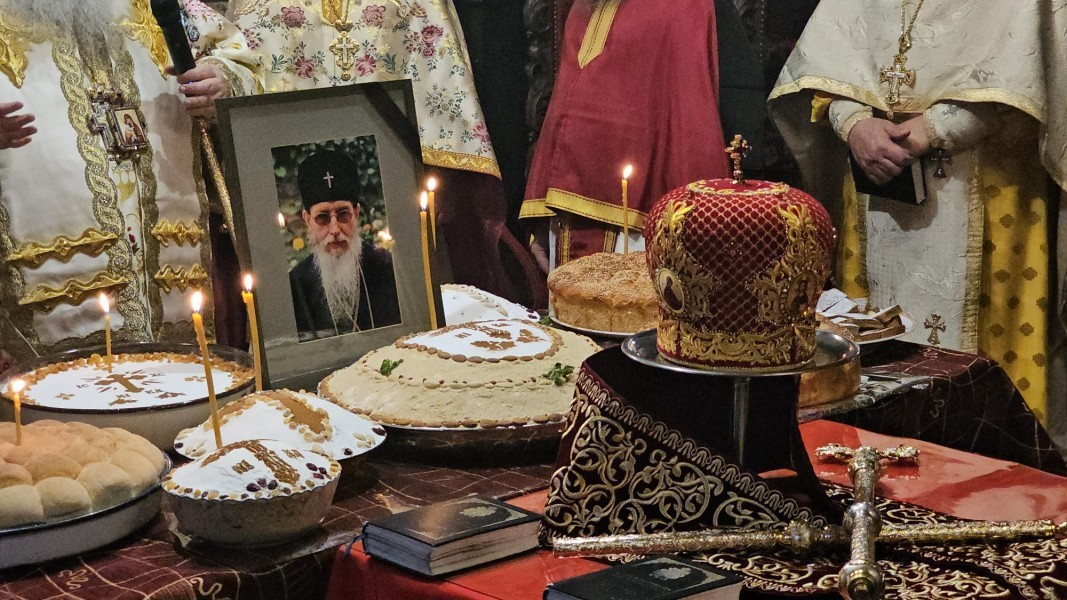
The Holy Synod of the Bulgarian Church has made another and strange untransparent decision once again, right after the Enormous Scandal with the cassation of legal choice of People of Sliven for best candidates Ierotey and Mihail (amongs which Ierotey is preferred), as the Metropolia of Sliven is still mourining on the beloved pontiff his holiness Metropolitan Ioanikij, less than 3 months before his blessed passing to Christ.
The decision of Eparchal voters among which nuns, monks (archimandrites), priests and layman was cleartly to have Metropolitan to have Ierotey as a first and most wanted candidate and Mihail as a second that was made on 18 of February (Eparchy voters in Sliven elected the two bishops, of whom St. The Synod will elect a new Metropolitan of Sliven.
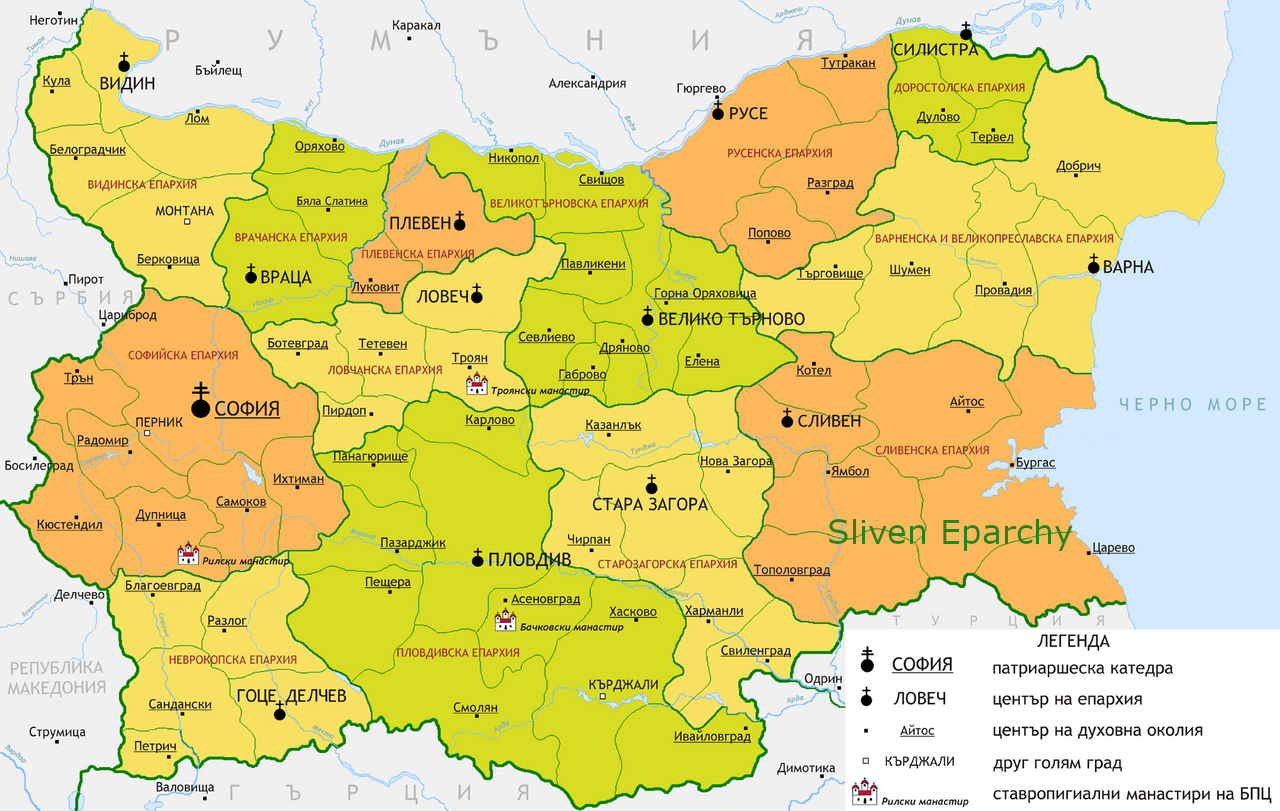
Map of Spiritual Eparchies in Bulgaria of Bulgarian Orthodox Church Bulgarian Patriarchy (BPC-BP)
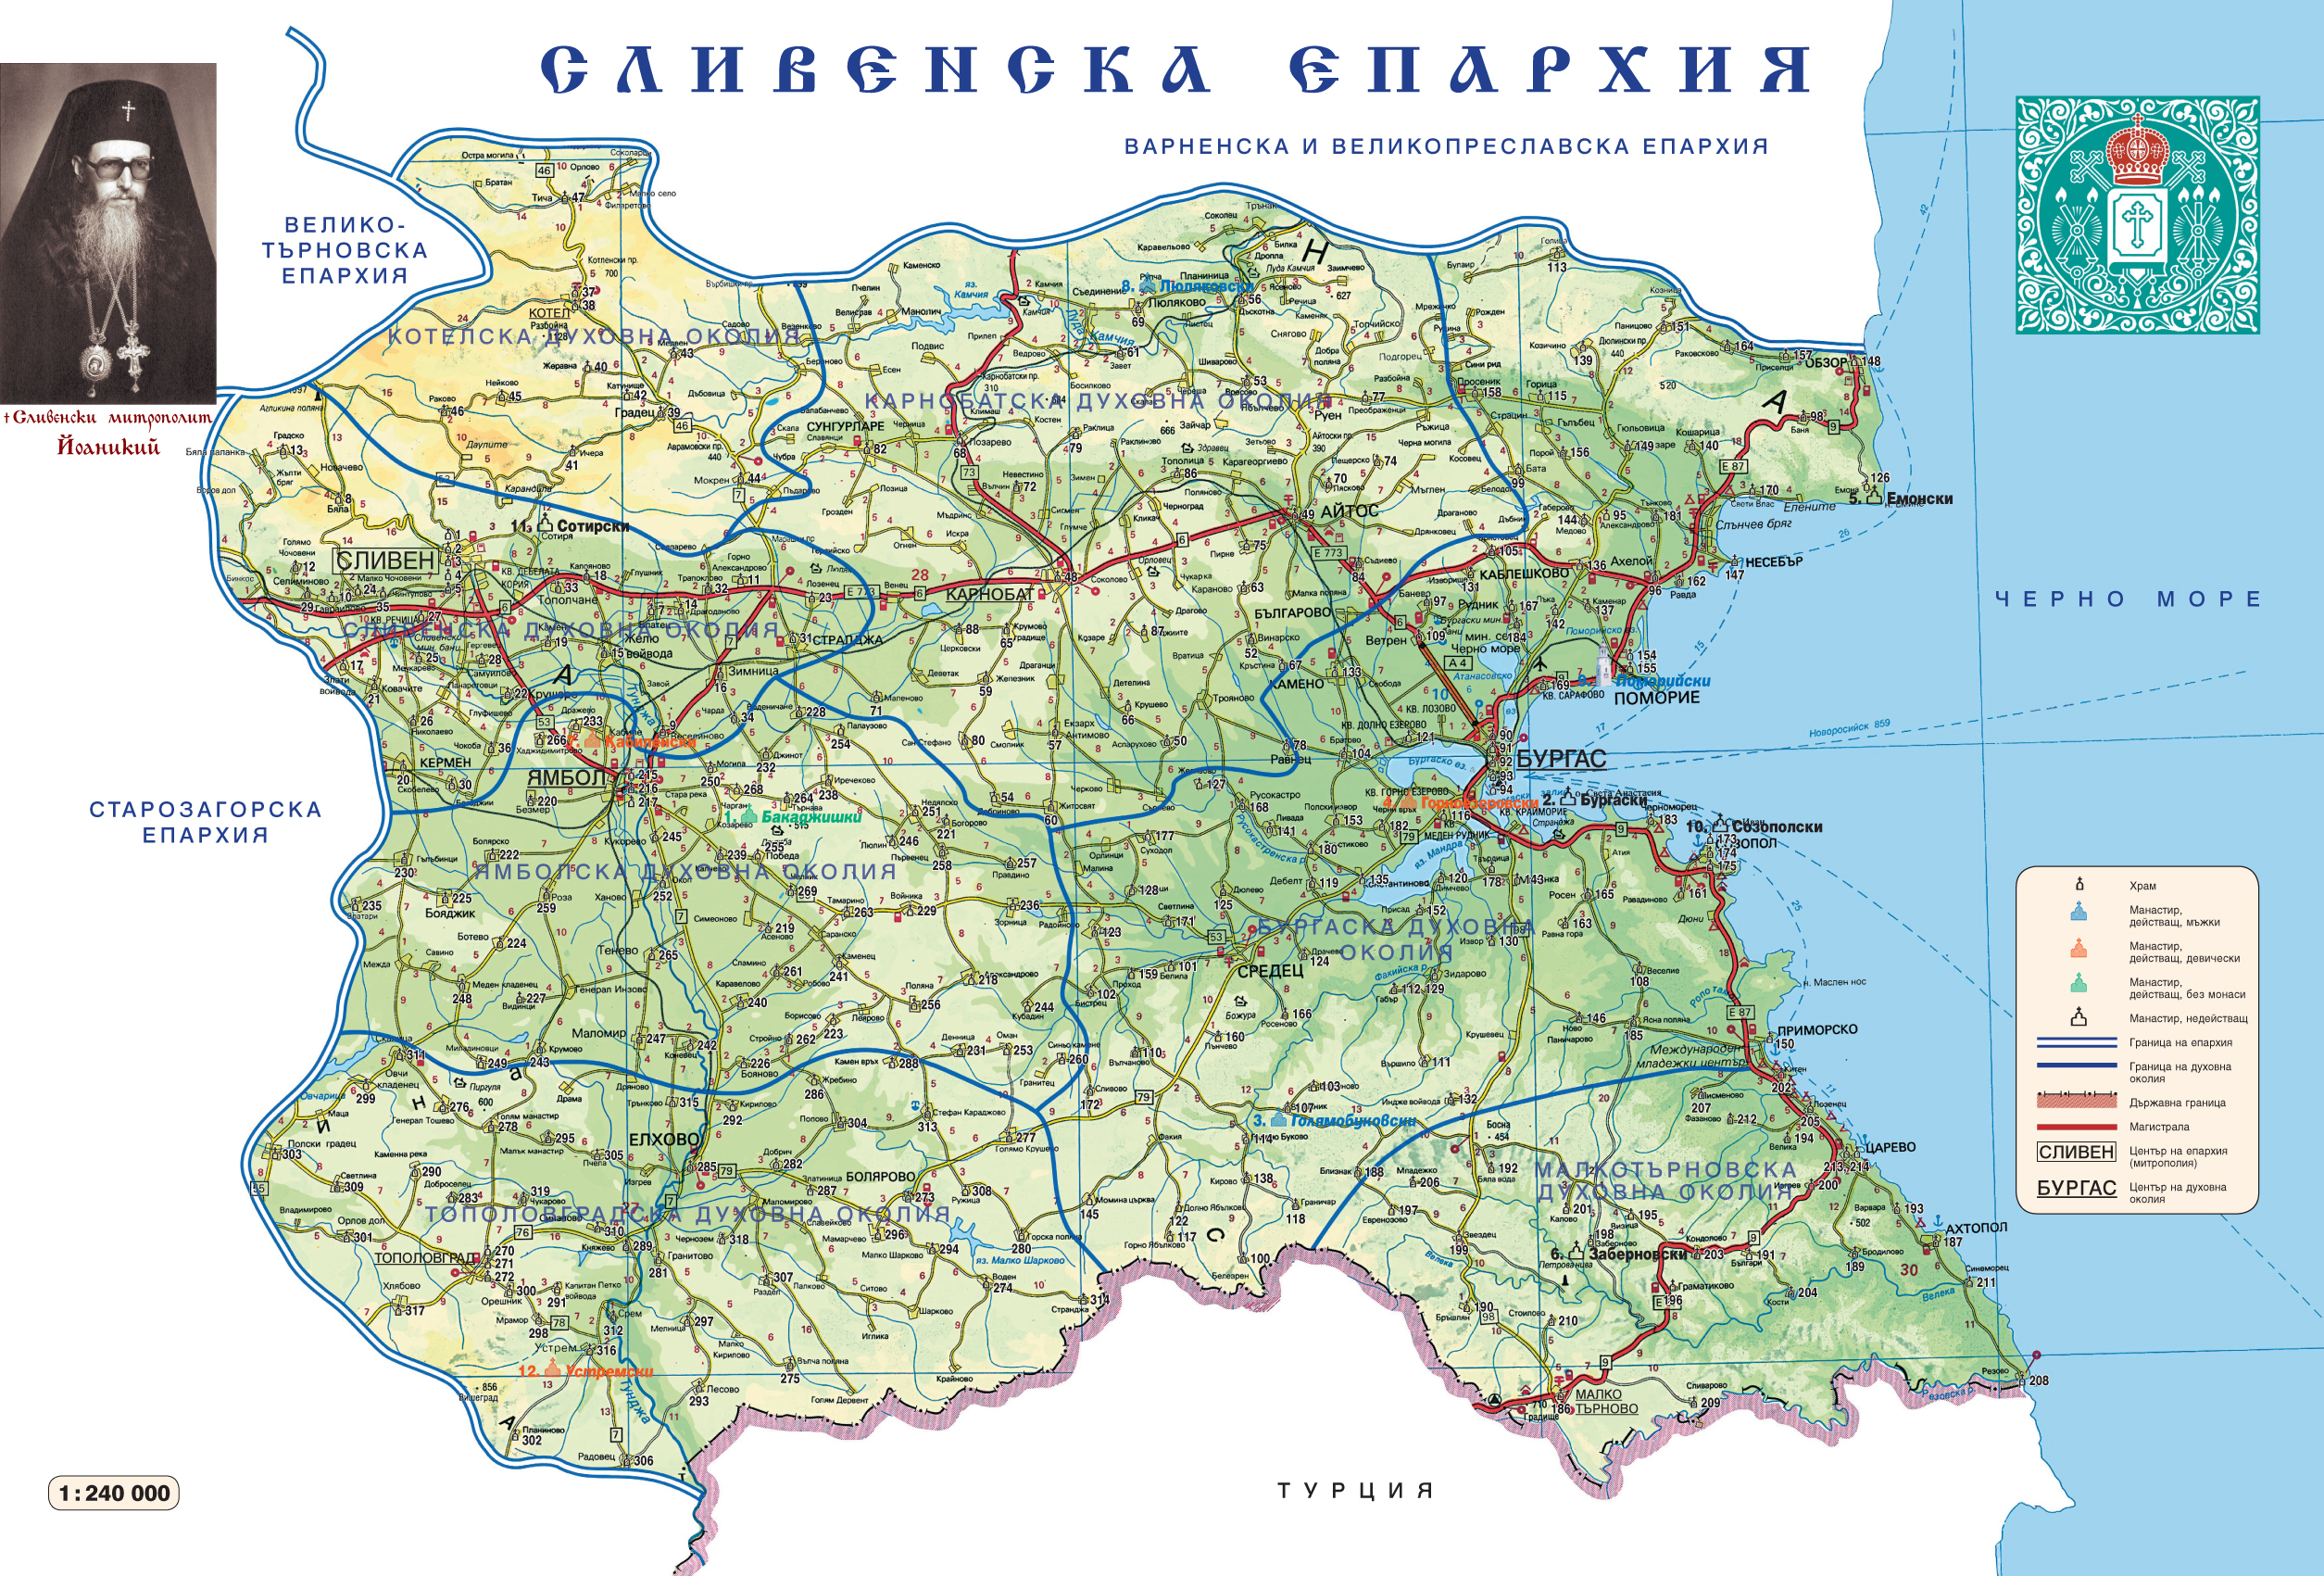
Territorial Map of Sliven Eparchy according to the Local Spiritual districts belonging to Sliven Metropoly
Shortly after, it was decided to stop the legal procedure for choosing between bishop Ierotey and bishop Michail and overwritte the Synod accepted and agreed own legal document to follow on different church casuses, the ' the Church statuses regulations (Устав на БПЦ Българска Патриаршия = Bulgarian Orthodox Church Regulation Rules document decided to be followed by everyone in the Church including the bishops and metropolitans on a National Church Assembly) right during a procedure for enthronization of next Metropolitan of Sliven.
The new "regulation" they tried to push "in the shadows (illegally against the Church statues)" was written in a way to make the choice of new Metropolitans to be done only by Metropolitan assembly the Synod, without taking in considerating the christian people preference for such, something scandal as this was not so during the last 150 years since we have restored the Bulgarian Church Excharchy.
For more see whole case described in Enormous Church Scandal in the Bulgarian Orthodox Church on the selection of new Metropolitan for one of Biggest Church Eparchies the Eparchy of Sliven.
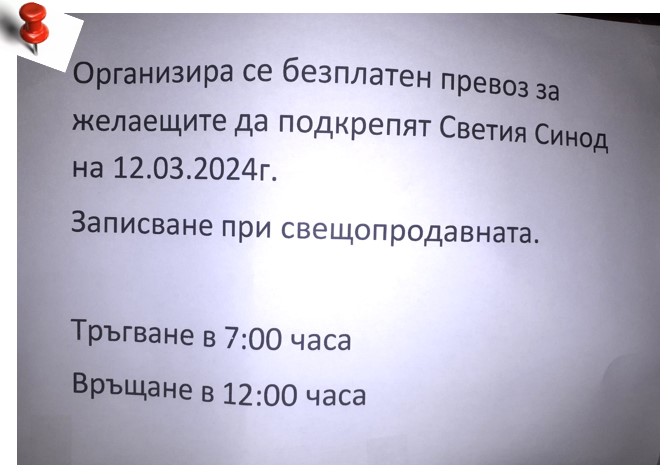
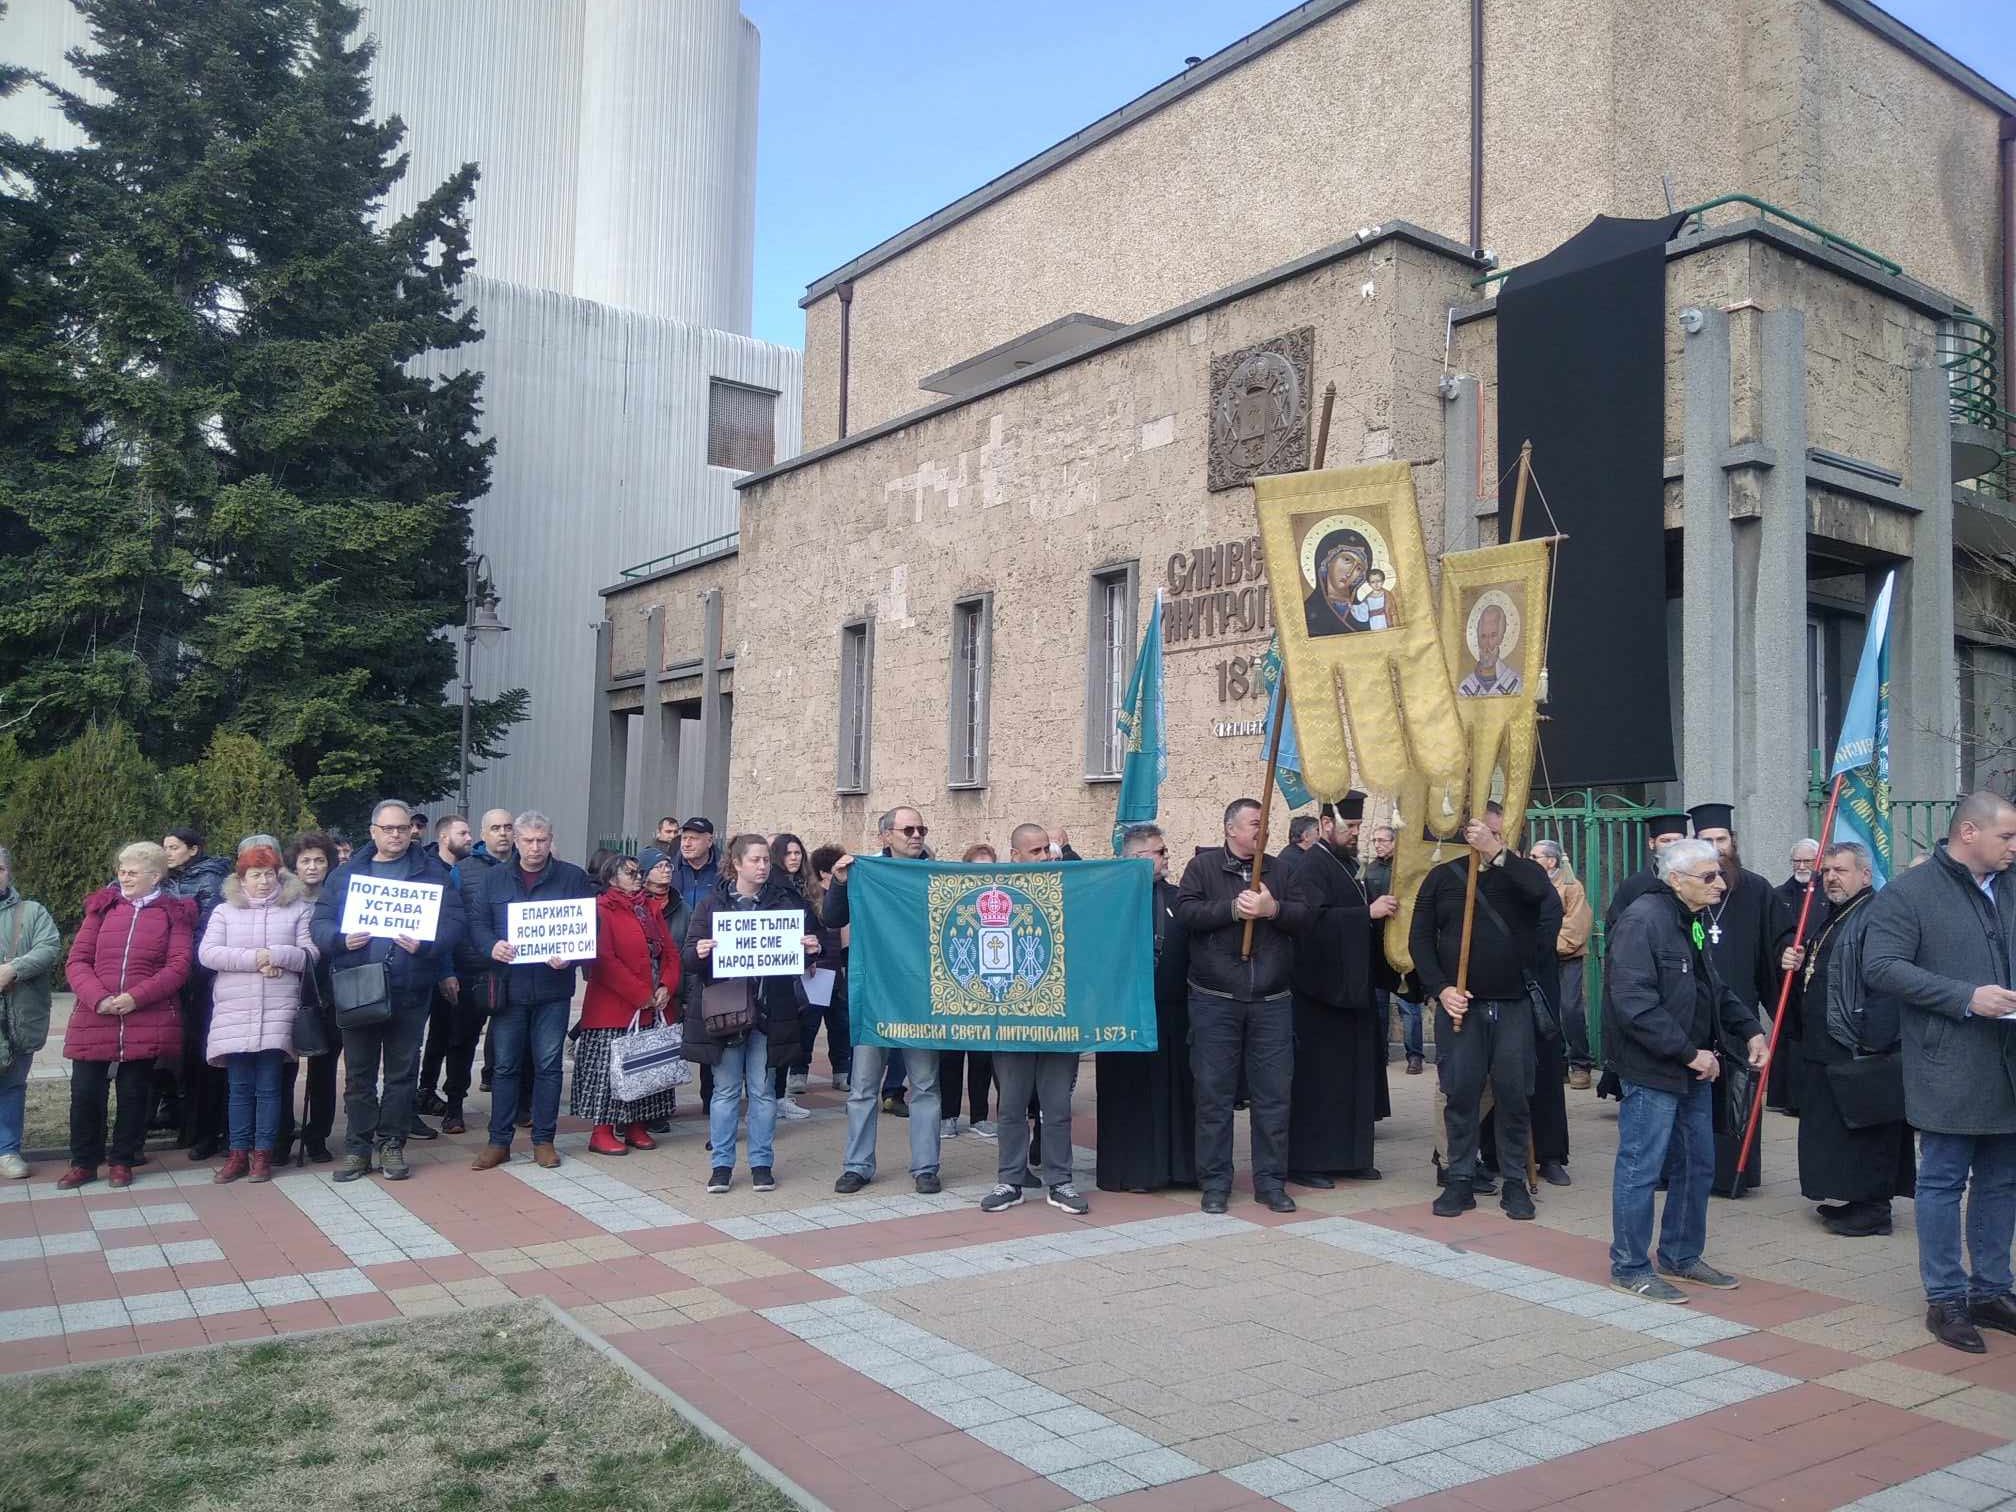
Out of this a great number of discussions started by Christian laity in facebook, viber and in the media of multitude of people, priests and cleargy from Sliven Eparchy complaining and protesting first infront of the Metroplitan Palace in Sliven
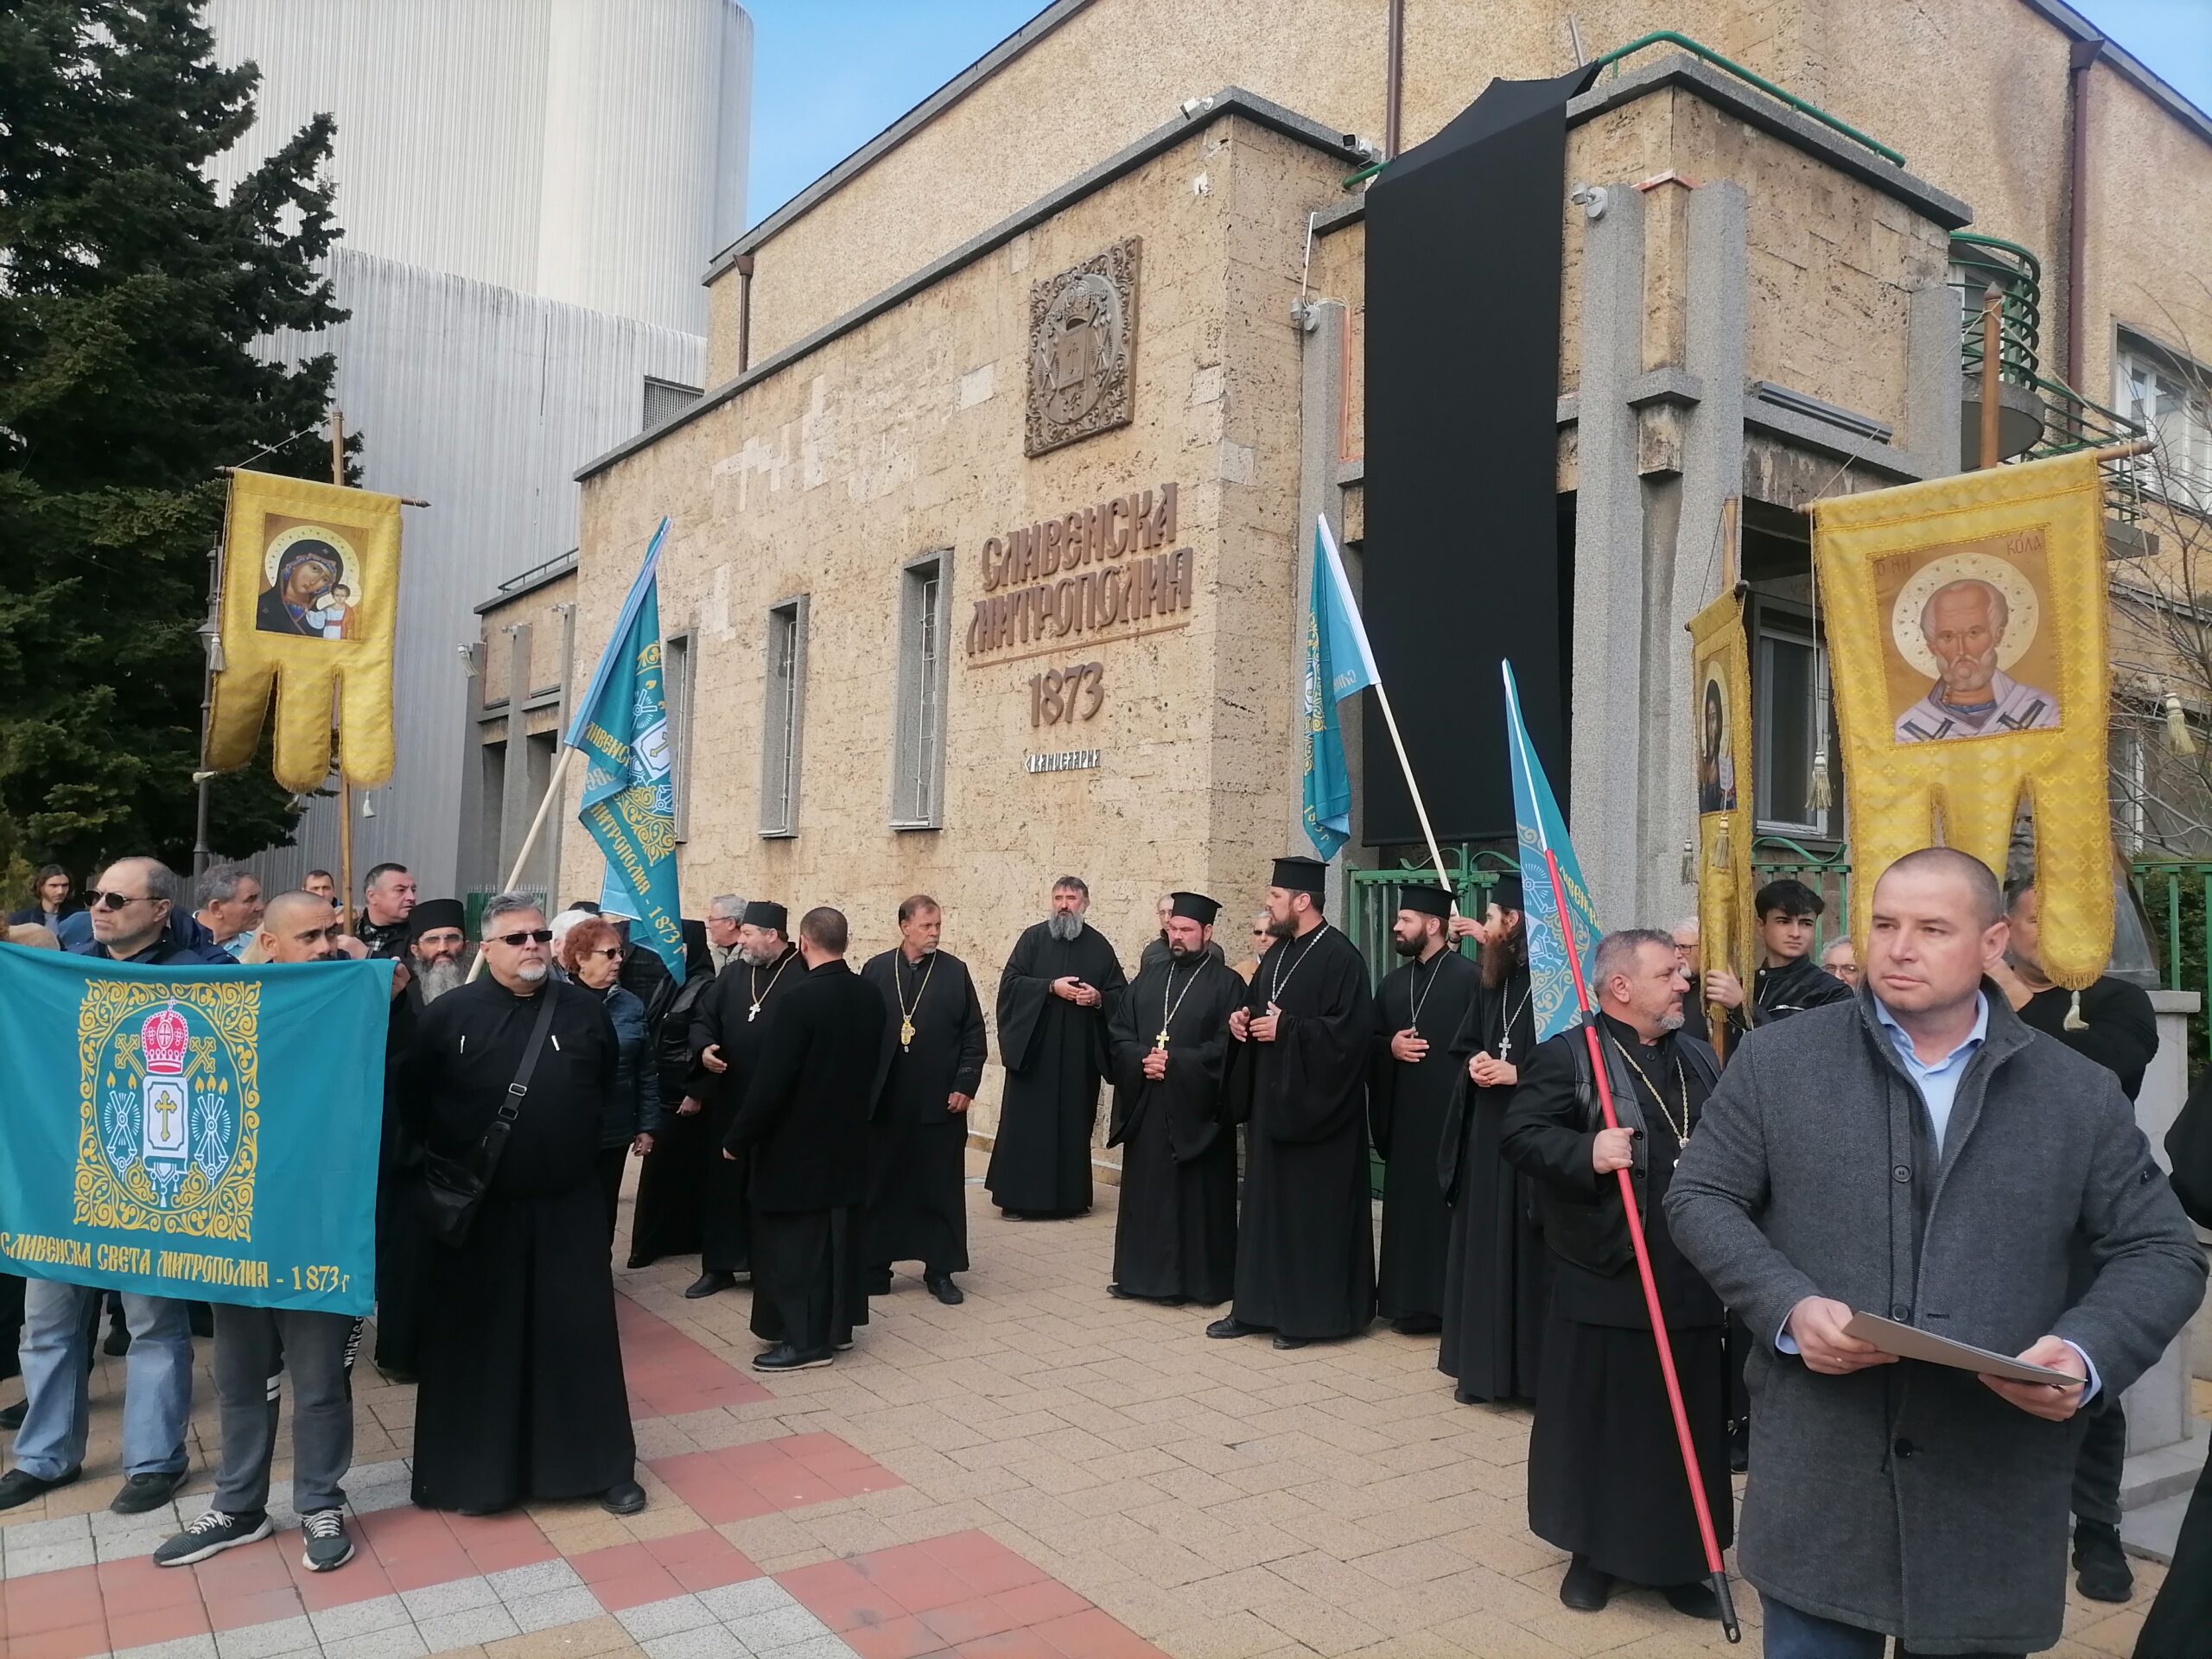
Sliven Church Priests, Monks and Layman gathered in front of Sliven Eparchy Metropolitan governing building
As this protests were not considered seriously by many of Elders of the Synod, the same protest with much more participant occured in front of Synodal Palace (the ruling ministry of the Bulgarian Church seat place) in Sofia as well as purely physical by presence with Prayer Vigils to the Holy Synod because of their unwillingness to accept the Synod unargumented decision to stop the procedure for choice of new metropolitan.
Unofficially it was was said the reason behind the solution is accusation against Ierotey and Michail for being involved in unwaful selling of Church lands. These facts were publicly checked by documents (see them here) presented by the court clearly prooving the accusations of two brother priests Silvester and Evgeny (which has a history of being involved in many anti-church activities and scandals) are fake.
Bishop Mihail has also been accused by others for the same illegal church land resell activities, and he came with official answer on the Bulgarian Orthodox Church (official site) see the document here.

Peaceful objection Vigil Prayer in front of Holy Synod by Sliven Clergy and Laymen, Poster reads:
"Do not exchange our Good shepherd, which gives his soul for the sheep with a mercenary, we do not know !"
Second Poster on the background is "Against the New Order", meant the new Order to not venerate People's choice during voting of new Metropolitans
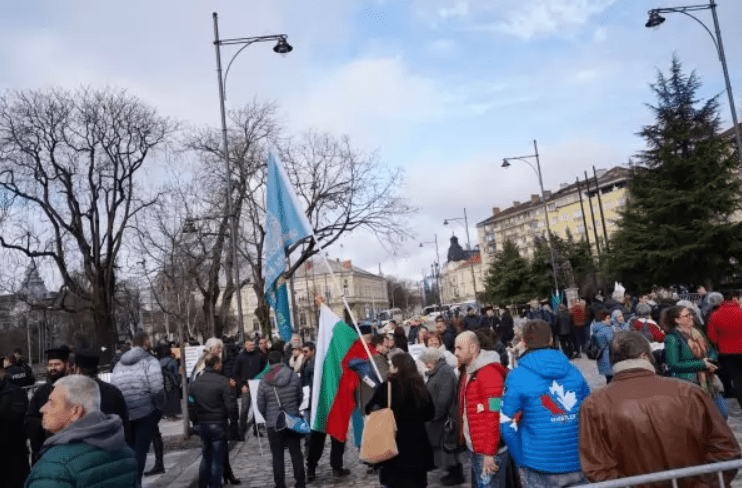
The outcome of the protest in front of the Synodal bulding palace in Sofia, Bulgaria was to cancel the votings for Metropolitan and do the whole voting procedure from the beginning.
The people accepted the decision of the Synod even though the synod took this decision to not put in place 'new order' in favour if existing norms of the Churh statuses on the background of multitude of protesting priests, monks and layman from Sliven Eparchy and other eparchies which is well documented well in below video.
Synodal Prayer Vigil against the cassation of choice for future Metropolitan of Sliven
On the protests along with Church people and clergy from Sliven was present people from other Eparchies as well as key well known priests and monks that are from Sofia and the Sofia Metropolitan to tell their unwillingness for overriding the Church established rules "Statuses", as well as to express their support for Sliven Eparchy whose Church people will is to have venerated their up to the rules selection of Bishop Ierotey to become the next Vicar (Metropolitan) of Sliven.
On many TV medias this protest was not shown and the organized fake "contra-protest" of Metropolitan Nikolay and his people who were anti-protesting against people will was shown as it was paid for that (another proof for lack of enough freedom of speech and transparency of Bulgarian mass medias).
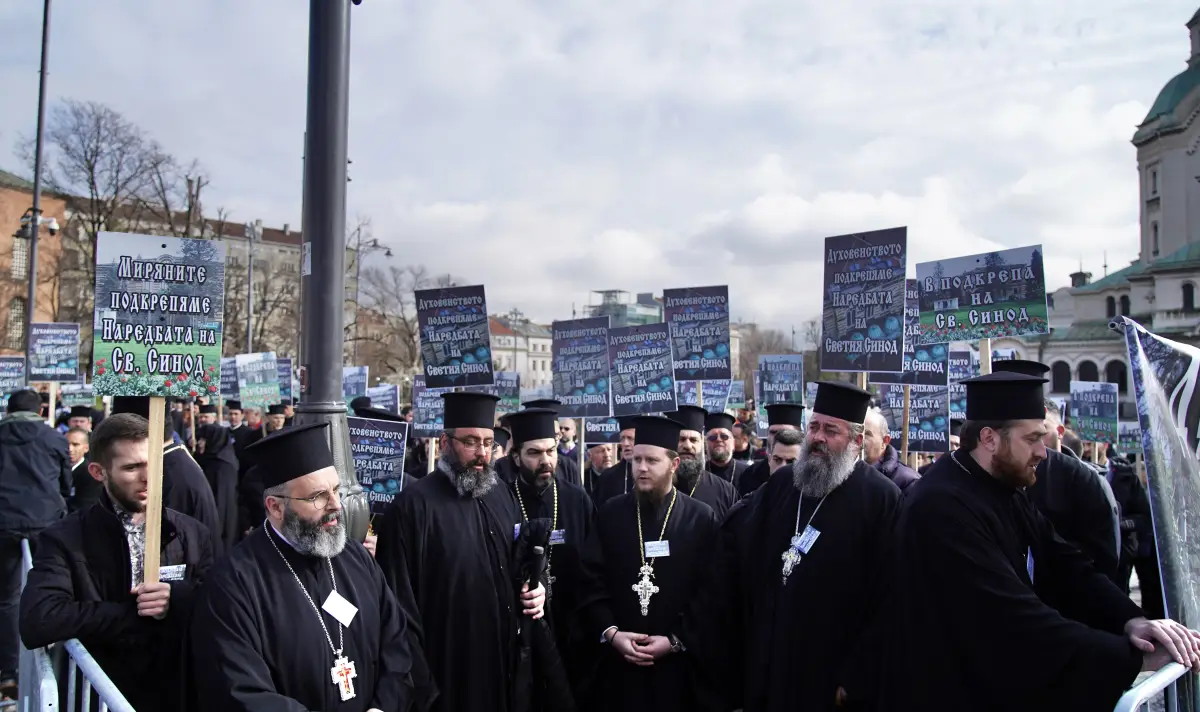
The contra-protesters from Plovdvid Eparchy that came with buses from Plovdiv eparchy enforced by Metropolitan Nikolay, very much in the old spirit of manifestations during the totalitarian regime of communism (notice the obviousness of the protest is fake from the exactly same looking slogans held mainly by priests)
As a result people from Sliven Eparchy accepted the fact that the Holy Synod decided to finally cassate (cancel) the procedure for choice of new Sliven Metropolitan and organize a new list of Worthy and dostopochteni (venerable) Bishops among which Sliven's people should make the choice again.
The people accepted this as they hoped the Holy Synod elders, might have been misled by the false accusation reports of the two brother priests Silvester and Evgeny Yanakievi (who by the way are very active on facebook) against Ierotey, and thus by organizing the choice once again officially the choice will take case in a transparent way and according to the Church rules statuses and then they can again vote for bishop Ierotey and double verify their initial choice.
However what happened now is far from that. Contrary to any logic (and as provocation), the list of venerable Bishops was made by the Holy Synod, during the Great Lent on 22 of April, a time in which people should concentrate on their repentance and spiritual growing and spiritual preparation to accept the Fest of Feasts, The Resurresction of Christ Easter.
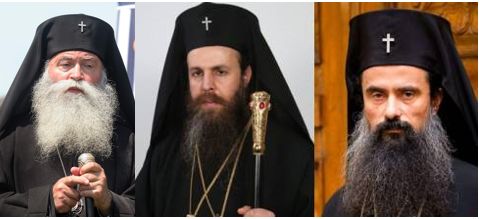
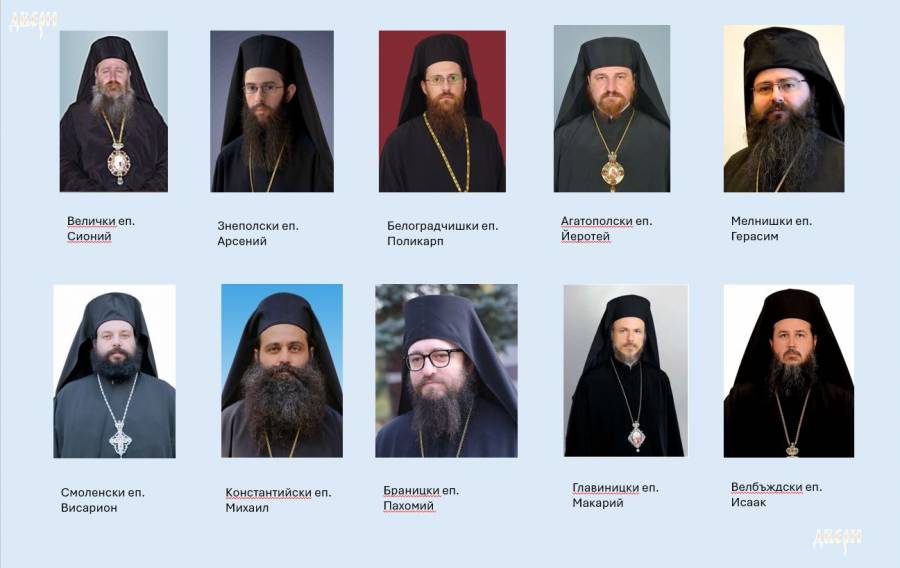
Contrary and again unvenerating the Church clergy and people's will of Sliven the new list of Bishops does not included neither Ierotey nor Mihail and included only 6 Bishops claimed to be venerable !!!
1. Velichki Bishop Sionij
2. Znepolski Bishop Arsenij
3. Melnishki Bishop Gerasim
4. Branitcki Bishop Pahomij
5. Glavnicki Bishop Makarij
6. Velbyzdhski Bishop Isaak
Here is a tiny biographies and only few rumored things about the Bishops, synod have been included and listed them according to seniority on when they become bishops.
1. The first listed Bishop Sionij (Velichki) completed Cherepish Spiritual Seminary (Academy) in 1990. Become monk in 1991.
Completed Theology in 1994 in Saint Kliment Ohridski. 1995-1996 specialezed in Erlangen Germany. Become monk from Metropolitan Dometian (Vidinski) in Klisurski Monastery soon after become hieromonk. In 1992 – 1995 has been abbot of Klisura Monastery. In 1996 has become deacon of Sofia's Theological Seminary Saint John of Rila (he was later removed because of scandals, a boy died and accused by pupil parents for pedophilia, a sad fact that was hidden with time, due to many publications you can find online …).
In 1998 has been raised to archimandrite by Patriarch Maxim in Dolni Lozen Monastery St. Peter and Paul.
In March 2007 has been ordinated as Bishop Velichki in Saint Alexander Nevski Cathedral. In 2009 become vicar of Vidin Metropolitan Dometian In 1 May 2014 become an abbot of Troyan monastery, 3rd April 2019 he has become an abbot also to Bachkovo Monastery.
Bishop Sionij is among the most scandalous persons in Bulgarian Orthodox Church, many scandals media scandals assigning his name tо pedophilia and homosexuality through the time. It is claimed by medias he is involved with mafia (and especially with Church mafia). There was even a person who says to have been involved in this affairs with him that publicly has given interview for "Tzanov"'s self financed youtube channel Napred i Nagore" (video titled: "The Church of Sin").
Currently paradoxically he is an abbot of 2 of the biggest and 2 second richest monasteries in Bulgaria Troyanski and Bachkovki.. His family is known in Sofia for years for being one of the most richest people in Sofia.
Currently aged 56 yrs.
2. Second one Arsenij gruaded high school 2006 in Stara Zagora in village Osetenovo. Completed Saint John of Rila seminary in 2006, was student in Saint Ohridski Theology and continued his education in Plovdiv University, saint Paisios of Hilendar, said to have graduated 2009. Tonsured monk in 2007, became hierodeacon and consequentially same year 2008 hieromonk. 6th December he was raised by Metr. Nikolay to Bishop. He has been a director of Plovdiv's Orthodox TV since 2009 and Plovdiv Seminary 2010 (seminary initiated again by by Metr. Nikolay). In 2012 he was given to be a head of Metropolitan cathedral in Plovdvid saint Marina.
On June 2014 he was raised to bishop after offer was to the Holy Synod, by Metr. Nikolay.
Hierotony was made by then very old Metropolitan Ioanikiy of Sliven in collaboration with Metropolitans Dometian of Vidinsky (now deceased), Grigoriy of Velikotarnovsky, Ignatius of Pleven and Nikolay of Plovdiv.Iinterestingly he is titled as protegee of Metr. Nikolay who orchestrates the decisions in the Holy Synod for the last years (fact known by most people who even had a slight idea of what is going on internally in the Church). The backstage ruling of the Synod and the place is said to be easy for the Metr. Nikolay, since patriarch Neofit was severely sick and in practice inactive as patriarch. According to official information that leaked from Synod, it was exactly Arsenij the choice of Metr. Nikolay and his group of metropolitans (most of whom doesn't have the necessery support from anyone such as DS (Dyrzhavna Sigurnost) to which Metr. Nikolay is said to have the support and in which Metr. Nikolay's father was important ranked person). Thus the legative choice of Sliven people was cancelled by the Synod by Metr. Nikolay and his group in attempt to install the already pre-chosen Arsenij in any means.
Bishop Arsenij is known amoung the clergy in Church for becoming a bishop officially against the Church statuses, not having the Statuses set years, becoming bishop before his 30s in 28 years, according to Church rules of statuses regulations he should have had been at least 35 years, 2 more years than Christs age of crucifix. The other break of Church statuses regulations with his hierotony was that he did not have 10 years as a clergy person in Bulgarian Orthodox Church.
Currently 37 yrs old (has 10 years served as Bishop)
3. Bishop Gerasim (Melnishki) is famous for having a professional Actors education, before deciding to become monk and start his new career in the Church. He has not have officially any Theological Education diploma till the moment he decided to walk the spiritual path, but received such by specialization in Moscow 2 years in a newly created faculty by Metropolitan Ilarion Alfeev (faculty created 2012) and no longer existing. The Diplomas from Russia are not really considered officially by Bulgarian Government due to legislative reasons. Even though that he managed to be chosen somehow and become the Secretary of Holy Synod, and have signed documents that he has a higher Theological education which he at that time doesn't.
He seems to have closed his eyes and signed the documents for requirements of higher education for the job of Synodal Secratary as a preliminary to the function of Secratary. He is known to often serve Liturgy in the Russian Church among which was a lot of scandals last year and which kept closed for quite some time, due to clergy in the Church being accused for serving for FSB (Russian Secret Services). He is also accused by some medias for organizing an official business dinner for donation to collect money from businessmen for the sake of restoration of Biggest Cathedral in Bulgaria St. Alexander Nevsky. It is strange why such a cathedral, has to collect donations for its restoration, especially since the Bulgarian church Sofia Metropoly has a lot of land properties and stores on the city center that given for rent and should be bringing money to mitropoly along with the so called "vladichnina" amount of whole profit which every Church on territory of eparchy has to pay to the metropoly. Church st. Alexander Nevsky is a common tourist destination in Sofia for people all around the world and that should be supposably another way to collect money for its restoration.
Currently he is aged 44 yrs. Served as Bishop 8 yrs.
4. Bishop Pahomij (Branicki) has been made a monk and hieromonk again by Metr. Nikolay, his elder was proto-abbot Benedict from Holy Mount Athos Zograph in Divotinski Monastery, near Bankya in 2002 in 2004 he become abbot of Divotinsky Monastery. For 2004 till 2010 he had managed to gather brotherhood and helped to recover a Chapel Saint Anna and rerecover the 70 Apostles Church buildings and the Main Church Holy Trinity. In 2015 he become hieromonk. bishop (hierotony by current Metropolitan of Vratza and some other bishops who is temporary substitute for patriarch Neofit's passing till the new choice of patriarch completes.). In 12.06.2017 he was made a bishop in Rila Monastery, again – according to some sources he did not have the Higher Theological education at that time for the post of bishopship, requirement according to Statuses of Bulgarian Orthodox Church. Currently he is aged 45 yrs. Served as Bishop 7 yrs
5. bishop Makarij (Glavnicki) has completed Plovdiv's Spiritual Seminary (whose deacan at that time was Bishop Evlogij Adrianopolski), finished Theology school in Bucharest in 2004 and Master degree in Thessaloniki (Solun) completed in 2010. In march 2007 become a novice monk in Rila Monastery Saint John of Rila. In 2008 during Lent become Hierodeacon, by bishop Evlogij. April 2011 become a hieromonk (priest monk). In March 2017 become a bishop. After becoming metropolitan he is now a vicar Bishop of Metropolitan Naum.
It is interesting fact that his hierotony as bishop did not happen in Saint John of Rila monastery but in Troyan Monastery, where currently a bishop is bishop Sionij. Also the person who pushed his career forward Bishop Evlogij of Rila Monastery did not take part in the hierotony in Troyan monastery weirdly.
Current aged 42 yrs. Serves as Bishop 7 yrs
6. Bishop Isaak (Velbyzhdski), started and completed aged 13 in Saint John of Rila seminary in Sofia, which he complated in 2001. In 2001 he started working in Seminary administration. Completed Sofia, Theological School saint Kliment Ohridski in 2008 (Bachelor). In 2009 in Vidin he become monk by Dometian of Vidin under spiritual guidance of Biship Sionij Velichki. In 2010, was raised to hieromonk in Saint Nicolas Church and in parallel works in Sofia Seminary as а tutor (ethnical bulgarians living abroad).
In 2011, with blessing of Metr. Dometian he has become episcopal vicar of Lom Spiritual district. In 2012 in Dormition of Theotokos Chapel (which he headed) he was raised to archimandrite. In 2012 he started studying postgraduate studies in Moscow. In June 2023 he was raised to bishop with the title Bishop Velbyzhdski and given the role of second patriarch Neofit's vicar, as first is Bishop Polikarp. According to rumors, he is said according to some media news to have some connections with FSB for his stay in Russia and some of the public appearances, staying behind Russia's official position for holy war, held against the evil.
Serves as Bishop 1 yr
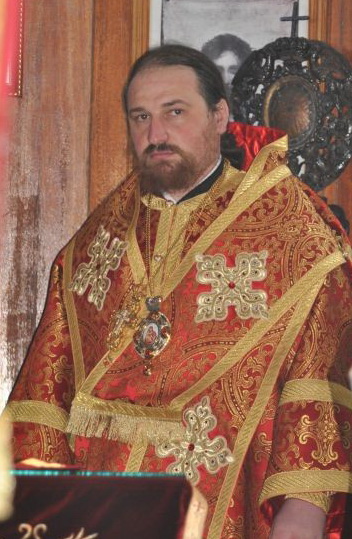
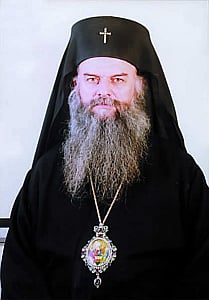
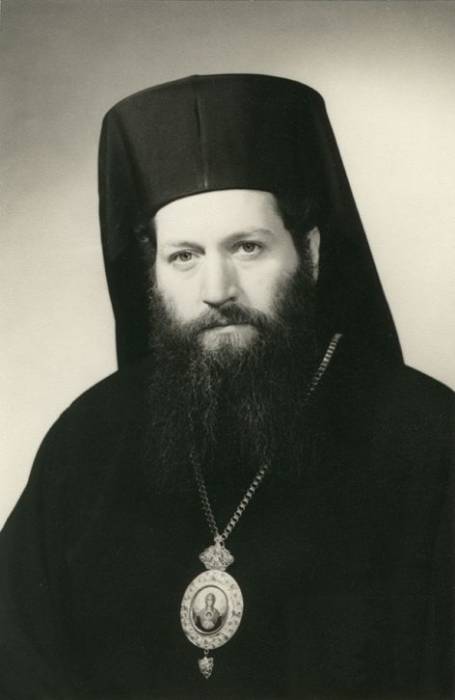
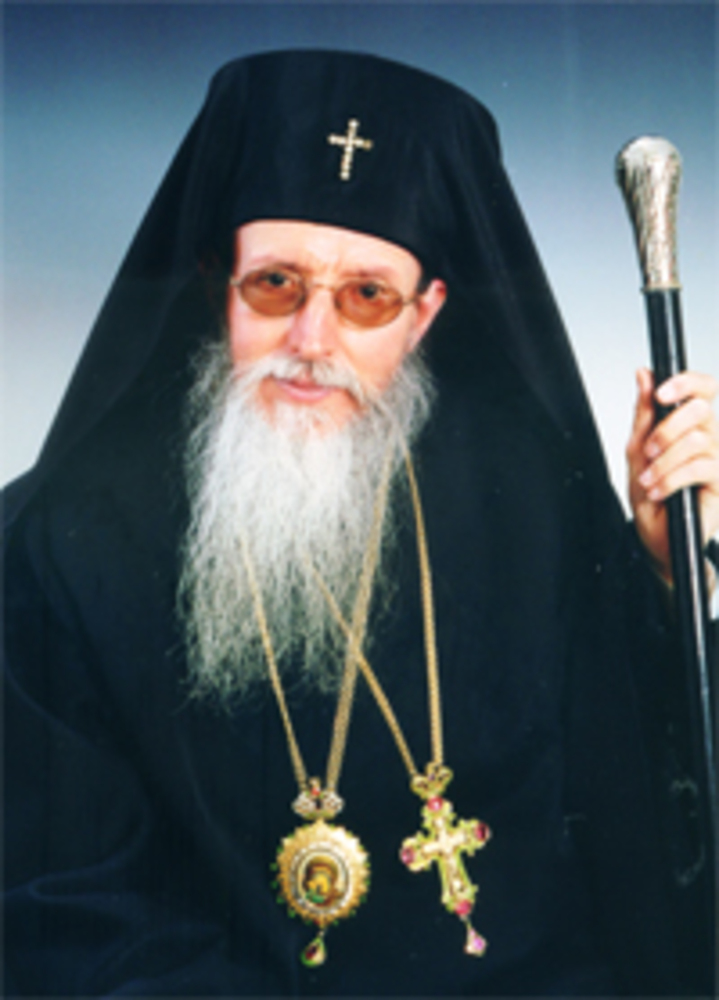
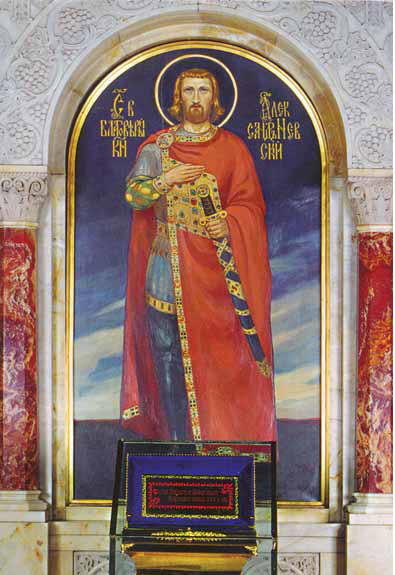
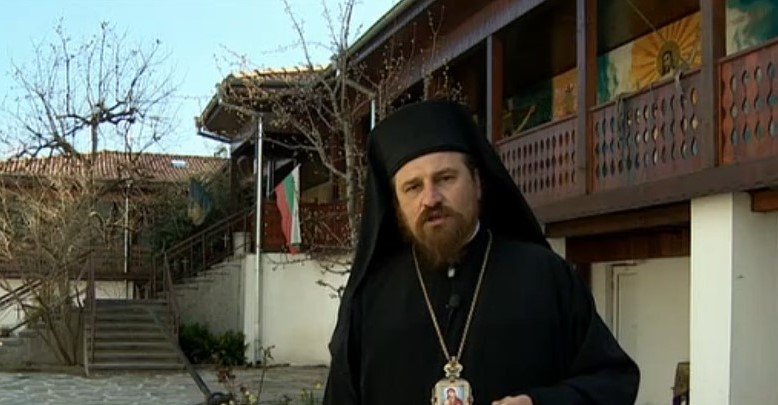
Bishop Ierotey Agathopolski (Kosakov)
The Seventh Bishop that is excluded from list, Ierotey (Agathopolski) was selected by Sliven Eparchy Priest, Monks and Laity
to become the 7th Metropolitan of Sliven is Ierotey (The Voice of the People, The Voice of God) !
Bishop Ierotey (Agathopolski) in 2003 completed, Parallel course of Sofia Theological Seminary. December 22, 2003, Metropolitan Ioannikiy (Nedelchev) of Sliven tonsured him as a monk in brotherhood of the Holy Great Martyr George in the city of Pomorie.
Archimandrite Theodosius (abbot of) Pomorie monastery at that time became his spiritual mentor.
May 11, 2004, Metropolitan Ioanikiy of Sliven in the Church of Saints Cyril and Methodius in Burgas ordained hierodeacon.
On May 16 of the same year, Metropolitan Ioanikiy of Sliven in the Church of the Most Holy Theotokos in Nessebar was ordained to the rank of hieromonk.
On January 1, 2005, he was appointed abbot of the Monastery of the Holy Great Martyr George in Pomorie.
He made a significant contribution to the development of the Pomorie monastery and its influence on Christian life in the region.
Christian children's camps were organized annually at the monastery, a week of Orthodox singing introduced. Many hopeless and lonely and people with problems found a hospitality and spiritual help and resort in the monastery.
On May 6, 2008 he was elevated to the rank of archimandrite. In 2010 he graduated Master Degree of Theology of Shumen University, Bishop Konstantin Preslavsky.
September 18, 2014, by decision of the Holy Synod of the Bulgarian Orthodox Church, he was elected vicar of the Sliven diocese, bishop with the title of Agathopol (Agathopolski).
October 1 was chiratonized to Bishop rank by Metropolitan Ioanikij (Nedelchev) Slivenski, Metropolitan Grogorij (Stefanov) of Tarnovo, Metropolitan Starozagorsky Galaktion (Tabakov), Metropolitan Nikolay Plovdivsky (Sevastyanov), Metropolitan Ambrosij (Ambrosius) Dorostolsky (Parashkevov), Metropolitan of Nevrokop Seraphim (Dinkov), Bishop of Trayanopol Cyprian (Kazandzhiev), Bishop of Znepol Arseniy (Lazarov).
Served as Bishop 10 years
I believe there is nearly no person who has even encountered to meet Ierotey (Kosakov) Bishop Ierotey and interacted and doesn't have a good memory of that time, or have some bad impression.
Not that I know him presonally but that person has always tried to help everyone in everything, this is really rare in our mostly egoistical world. Perhaps only envious and people obsessed with money or material goods can criticize him for the reason, he lives a true monk, and as every true monk and as Saint John of Rila adviced in His Covenant, "From all the things, most beware of money, for they are the root of all evil.".
It happens Slivens Eparchy is full of material goods due to its strategic location nearby see and due to tourism, and of course this eparchy is interested to be at the hands of businesses who can built freely and sell for cheap to big investors lands for the sake of increasement of tourism in the region, as Bishop Ierotey might be a factor against that (as he has refused to cooparete in building of 200 rooms Hotel accomodation at lands of Pomorie Monastery to Silvester Yanakiev, now there are some people leading fierce company to remove him from the vote and destroy his good name reputation.).
From the Holy Synod, there is no official explanation on why Bishop Ierotey is removed from the vote list during the new choice, but for everyone who has even the slightest idea of what is going on in the Church higher stages of power it is fully clear.
The wing of Metropolitan Nikolay and his protegees Metropolitans has risen their voices against the inclusion of Ierotey in the list. In order to make it not clear that Ierotey is the real target, few others were also removed who were in practice "un-votable" as their personal life has spots.
This just like the first time of decision to halt the process of voting even thugh two candidates for metropolitan were chosen (none of which that seems to fit the desires of the Dark Cardinal of the Bulgarian Church Metr. Nikolay and his synodal group of dependent people who are kept silent and obedient due to compromates against them or with financial donations).
It is not secret and not new the backstage dictation of Metropolitan Nikolay to his band (Synodal wing) of bishops many of whom are known to have a lot of homosexual (homophilia) and even pedophilia and other abnormal sexual activities, as well as activities related to the dark business schemes in bulgarian businesses and money laundary for which people know from mouth to mouth information spreading for years in the Church.
What is now stunning is that these people has become so unscrupulous, that they're ready to get over any person or group of people and even against a whole Eparchy of the Bulgarian Orthodox Church that perhaps nominally might be around 1 million people !!!
These peoples's believe, that us the ordinary believers of the Bulgarian Orthodox Church are stupid and easily managable and they can do with them whatever they want because they're a higher class and very few of people are really regularly going to Church or actively parcipating in the Church Mysteries (Holy Communion and the other 7 sacraments).
What is striking, the Synodal elders are shameless, they think they're the Church, forgetting the word Ecclesia meaning.
"Ecclesia (or Ekklesia) in Christian theology means both: a particular body of faithful people, and the whole body of the faithful."
Seems like now our many of our Synodal Elders understand the Church (Ecclesia) as them and the servitude of faithful to Christ people who should obey them for the only reason, they have taken the seat of the Holy Apostles (that is the metropolitan seat = bishopship seat + administrative obediences).
It is interesting to say the modern understanding of Ecclesia in Western Modern Catholicism does well fit the understanding that the powerful of the day in the Synod that are trying to push out their agendas against the people will and choice, below is a definition.
Christian understanding of Church
If one speaks of the whole body of Christian faithful, then there are included not only the members of the Church who are alive on earth but all who were members of the church before. Some churches therefore describe the Church as being composed of the Church Militant (Christians on Earth) and the Church Triumphant (Christians in Heaven). In Catholic theology, there is also the Church Suffering (Christians still in purgatory).
The Christian family, the most basic unit of Church life, is sometimes called the domestic Church.[2]
Finally, 'The Church' may sometimes be used, especially in Catholic theology, to speak of those who exercise the office of teaching and ruling the faithful, the Ecclesia Docens, or again (more rarely) the governed as distinguished from their pastors, the Ecclesia Discens.
What else is really not Okay with how the selection of Bishops are reduced from 10 to 6 venerable to take the seat of Sliven Metropolitan
All this events happen during the Great Lent and for every True Christian it is well known the old Church practice, that important decisions should not be taken during the great Lent period as usually such decisions are wrong and could create havoc, due to the highest degree of temptations that are let around by the Almighty God for the spiritual grow and healing of his faithful childs the Christians.
It is up to Christian people to now proof them once the Great Lent is over after the Glorious Resurrection Day they're wrong and that people will not let the God given eparchy of Sliven to be ruled by dependent Metropolitan to Metr. Nikolay.
It is up to us to proof we're not sheepsand that people's will on matters of higher hierarchy of Church and their deeds should not be unmonitored and unpunished as it was in a higher degree over the last years !!!
People should rise of their indifference and show they still care about the Pureness of the Church and the legitimity of the Church Law of Selection of new Highest Hierarchical heads of the Church.
It is last time and last chances until we still have Church, especially considering the Apocalyptic times in which we seem to be living.
If you dear brothers and sisters in Christ not react and not fight for the truthful selection of a list with really venerable bishops that is transparent and argumented as it should be, another satellite Metropolitan will be installed to fit the plans of the ex-communist DS (Dyrzhavna Sigurnost) and the Ruling elite. If that happens soon we'll not only have a Real Orthodox Church Hierarchy chosen according to canons and due to Church Statues as it should be but an Assembly of Pseudo Hierarchs who acts in secrecy and conspiracy schemes in the same way as any Masonic Lodge.
In other words, we'll have Church but a faked artificial business and party like organization, where decisions are not taken by the Creator of the Church the Lord Jesus Christ and his true followers the Apostles (that are the Bishops and Metropolitans), but we'll have a secular organization with Big beauty Church temple (museums without real cleargy) and a Monasteries full of pedophiles, gays and people who want to live an easy life and enjoy themselves instead of spiritually persevere and lead the hard spiritual fight and pray for the well-being of Bulgarians, Bulgaria and the Rest of the Christians.
Lets pray fervently until the end of the fasting, that the Metropolitans who took that bad decision will change their mind and put back in the list the real venerable people and not have a list of people who are dependent and unworthy due to lack of Higher education, a personal scandals, they were involved like Bishop Sionij or have another kind of spots, that can be easily researched even by a simple few Internet searches in Google.
Nomatter who is worthy or not, the main thing is that Sliven Eparchy should be headed by a person who is wanted in the Eparchy and such person according to the clear votes of Eparchical electors is Ierotey, the problem is that Ierotey is not playing well with the dark businesses and does count the interest of people, and does not randomly do what is being asked for with the only goal to make money and he doesn't follow blindly rules by Metr. Nikolay or whoever and thus he is automatically becoming unworthy.


No Comments »