Archive for the ‘Haproxy’ Category

Create Haproxy Loadbalancer Access Control Lists and forward incoming frontend traffics based on simple logic

Friday, February 16th, 2024

Create-haproxy-loadbalancer-access-control-list-and-forward-frontend-traffic-based-on-simple-logic-acls-logo

Haproxy Load Balancers could do pretty much to load balance traffic between application servers. The most straight forward way to use is to balance traffic for incoming Frontends towards a Backend configuration with predefined Application machines and ports to send the traffic, where one can be the leading one and others be set as backup or we can alternatively send the traffic towards a number of machines incoming to a Frontend port bind IP listener and number of backend machine.

Besides this the more interesting capabilities of Haproxy comes with using Access Control Lists (ACLs) to forward Incoming Frontend (FT) traffic towards specific backends and ports based on logic, power ACLs gives to Haproxy to do a sophisticated load balancing are enormous. 
In this post I'll give you a very simple example on how you can save some time, if you have already a present Frontend listening to a Range of TCP Ports and it happens you want to redirect some of the traffic towards a spefic predefined Backend.

This is not the best way to it as Access Control Lists will put some extra efforts on the server CPU, but as today machines are quite powerful, it doesn't really matter. By using a simple ACLs as given in below example, one can save much of a time of writting multiple frontends for a complete sequential port range, if lets say only two of the ports in the port range and distinguish and redirect traffic incoming to Haproxy frontend listener in the port range of 61000-61230 towards a certain Ports that are supposed to go to a Common Backends to a separate ones, lets say ports 61115 and 61215.

Here is a short description on the overall screnarios. We have an haproxy with 3 VIP (Virtual Private IPs) with a Single Frontend with 3 binded IPs and 3 Backends, there is a configured ACL rule to redirect traffic for certain ports, the overall Load Balancing config is like so:

Frontend (ft):

ft_PROD:
listen IPs:

192.168.0.77
192.168.0.83
192.168.0.78

On TCP port range: 61000-61299

Backends (bk): 

bk_PROD_ROUNDROBIN
bk_APP1
bk_APP2


Config Access Control Liststo seperate incoming haproxy traffic for CUSTOM_APP1 and CUSTOM_APP2


By default send all incoming FT traffic to: bk_PROD_ROUNDROBIN

With exception for frontend configured ports on:
APP1 port 61115 
APP2 port 61215

If custom APP1 send to bk:
RULE1
If custom APP2 send to bk:
RULE2

Config on frontends traffic send operation: 

bk_PROD_ROUNDROBIN (roundrobin) traffic send to App machines all in parallel
traffic routing mode (roundrobin)
Appl1
Appl2
Appl3
Appl4

bk_APP1 and bk_APP2

traffic routing mode: (balance source)
Appl1 default serving host

If configured check port 61888, 61887 is down, traffic will be resend to configured pre-configured backup hosts: 

Appl2
Appl3
Appl4


/etc/haproxy/haproxy.cfg that does what is described with ACL LB capabilities looks like so:

#———————————————————————
# Global settings
#———————————————————————
global
    log         127.0.0.1 local2

    chroot      /var/lib/haproxy
    pidfile     /var/run/haproxy.pid
    maxconn     4000
    user        haproxy
    group       haproxy
    daemon

    # turn on stats unix socket
    stats socket /var/lib/haproxy/stats

#———————————————————————
# common defaults that all the 'listen' and 'backend' sections will
# use if not designated in their block
#———————————————————————
defaults
    mode                    tcp
    log                     global
    option                  tcplog
    #option                  dontlognull
    #option http-server-close
    #option forwardfor       except 127.0.0.0/8
    option                  redispatch
    retries                 7
    #timeout http-request    10s
    timeout queue           10m
    timeout connect         30s
    timeout client          20m
    timeout server          10m
    #timeout http-keep-alive 10s
    timeout check           30s
    maxconn                 3000


#———————————————————————
# Synchronize server entries in sticky tables
#———————————————————————

peers hapeers
    peer haproxy1-fqdn.com 192.168.0.58:8388
    peer haproxy2-fqdn.com 192.168.0.79:8388


#———————————————————————
# HAProxy Monitoring Config
#———————————————————————
listen stats 192.168.0.77:8080                #Haproxy Monitoring run on port 8080
    mode http
    option httplog
    option http-server-close
    stats enable
    stats show-legends
    stats refresh 5s
    stats uri /stats                            #URL for HAProxy monitoring
    stats realm Haproxy\ Statistics
    stats auth hauser:secretpass4321         #User and Password for login to the monitoring dashboard
    stats admin if TRUE
    #default_backend bk_Prod1         #This is optionally for monitoring backend
#———————————————————————
# HAProxy Monitoring Config
#———————————————————————
#listen stats 192.168.0.83:8080                #Haproxy Monitoring run on port 8080
#    mode http
#    option httplog
#    option http-server-close
#    stats enable
#    stats show-legends
#    stats refresh 5s
#    stats uri /stats                            #URL for HAProxy monitoring
#    stats realm Haproxy\ Statistics
#    stats auth hauser:secretpass321          #User and Password for login to the monitoring dashboard
#    stats admin if TRUE
#    #default_backend bk_Prod1           #This is optionally for monitoring backend

#———————————————————————
# HAProxy Monitoring Config
#———————————————————————
# listen stats 192.168.0.78:8080                #Haproxy Monitoring run on port 8080
#    mode http
#    option httplog
#    option http-server-close
#    stats enable
#    stats show-legends
#    stats refresh 5s
#    stats uri /stats                            #URL for HAProxy monitoring
#    stats realm Haproxy\ Statistics
#    stats auth hauser:secretpass123          #User and Password for login to the monitoring dashboard
#    stats admin if TRUE
#    #default_backend bk_DKV_PROD_WLPFO          #This is optionally for monitoring backend


#———————————————————————
# frontend which proxys to the backends
#———————————————————————
frontend ft_PROD
    mode tcp
    bind 192.168.0.77:61000-61299
        bind 192.168.0.83:51000-51300
        bind 192.168.0.78:51000-62300
    option tcplog
        # (4) Peer Sync: a sticky session is a session maintained by persistence
        stick-table type ip size 1m peers hapeers expire 60m
# Commented for change CHG0292890
#   stick on src
    log-format %ci:%cp\ [%t]\ %ft\ %b/%s\ %Tw/%Tc/%Tt\ %B\ %ts\ %ac/%fc/%bc/%sc/%rc\ %sq/%bq
        acl RULE1 dst_port 61115
        acl RULE2 dst_port 61215
        use_backend APP1 if app1
        use_backend APP2 if app2
    default_backend bk_PROD_ROUNDROBIN


#———————————————————————
# round robin balancing between the various backends
#———————————————————————
backend bk_PROD_ROUNDROBIN
    mode tcp
    # (0) Load Balancing Method.
    balance roundrobin
    # (4) Peer Sync: a sticky session is a session maintained by persistence
    stick-table type ip size 1m peers hapeers expire 60m
    # (5) Server List
    # (5.1) Backend
    server appl1 10.33.0.50 check port 31232
    server appl2 10.33.0.51 check port 31232 
    server appl2 10.45.0.78 check port 31232 
    server appl3 10.45.0.79 check port 31232 

#———————————————————————
# source balancing for the GUI
#———————————————————————
backend bk_APP2
    mode tcp
    # (0) Load Balancing Method.
    balance source
    # (4) Peer Sync: a sticky session is a session maintained by persistence
    stick-table type ip size 1m peers hapeers expire 60m
        stick on src
    # (5) Server List
    # (5.1) Backend
    server appl1 10.33.0.50 check port 55232
    server appl2 10.32.0.51 check port 55232 backup
    server appl3 10.45.0.78 check port 55232 backup
    server appl4 10.45.0.79 check port 55232 backup

#———————————————————————
# source balancing for the OLW
#———————————————————————
backend bk_APP1
    mode tcp
    # (0) Load Balancing Method.
    balance source
    # (4) Peer Sync: a sticky session is a session maintained by persistence
    stick-table type ip size 1m peers hapeers expire 60m
        stick on src
    # (5) Server List
    # (5.1) Backend
    server appl1 10.33.0.50 check port 53119
    server appl2 10.32.0.51 check port 53119 backup
    server appl3 10.45.0.78 check port 53119 backup
    server appl4 10.45.0.79 check port 53119 backup


You can also check and download the haproxy.cfg here.
Enjjoy !

Use haproxy to dynamically modify haproxy load balancer variables, view stastics, errors and much more via stats UNIX socket with socat via command line

Friday, December 15th, 2023

haproxy-modify-dynamic-through-haproxy-unix-sock-via-socat-netcat

Haproxy could be configured to use the listen stats interface to provide a tiny web interface with statistics on all configured haproxy frontends / backends state status (UP / DOWN), current connections to proxy, errors and other interesting bandwidth information.

That is mostly useful but not every haproxy has it configured and if you did not configure the HAproxy load balancer machines on your own it might be, the previous person who build the LB infrastructure did not create the haproxy listener. 

If that is the case and you still need to get various statistics on how haproxy performs and the status of active connections towards Frotnend i/ Backend interfaces this is still possible via configured stats socket (usually this is in Global or some of the other haproxy.cfg config sections..

It is possible to do many things with haproxy such as disable / enable frotnends / backends / servers

Lets say your Haproxy has a global section that looks like this:
 

global
        stats socket /var/run/haproxy/haproxy.sock mode 0600 level admin #Creates Unix-Like socket to fetch stats
        log /dev/log    local0
        log /dev/log    local1 notice
        chroot /var/lib/haproxy
        user haproxy
        group haproxy
        daemon
        maxconn 99999
        nbproc          1
        nbthread 2
        cpu-map         1 0
        cpu-map         2 1

1. Listing all available options that can be send via the haproxy.sock UNIX socket interface

root@pcfreak:/home/hipo/info# echo "show help" | socat stdio /var/run/haproxy/haproxy.sock
Unknown command. Please enter one of the following commands only :
  help           : this message
  prompt         : toggle interactive mode with prompt
  quit           : disconnect
  show tls-keys [id|*]: show tls keys references or dump tls ticket keys when id specified
  set ssl tls-key [id|keyfile] <tlskey>: set the next TLS key for the <id> or <keyfile> listener to <tlskey>
  add ssl crt-list <filename> <certfile> [options] : add a line <certfile> to a crt-list <filename>
  del ssl crt-list <filename> <certfile[:line]> : delete a line <certfile> in a crt-list <filename>
  show ssl crt-list [-n] [
] : show the list of crt-lists or the content of a crt-list <filename>
  new ssl cert <certfile> : create a new certificate file to be used in a crt-list or a directory
  set ssl cert <certfile> <payload> : replace a certificate file
  commit ssl cert <certfile> : commit a certificate file
  abort ssl cert <certfile> : abort a transaction for a certificate file
  del ssl cert <certfile> : delete an unused certificate file
  show ssl cert [
] : display the SSL certificates used in memory, or the details of a <certfile>
  set maxconn global : change the per-process maxconn setting
  set rate-limit : change a rate limiting value
  set severity-output [none|number|string] : set presence of severity level in feedback information
  set timeout    : change a timeout setting
  show env [var] : dump environment variables known to the process
  show cli sockets : dump list of cli sockets
  show cli level   : display the level of the current CLI session
  show fd [num] : dump list of file descriptors in use
  show activity : show per-thread activity stats (for support/developers)
  operator       : lower the level of the current CLI session to operator
  user           : lower the level of the current CLI session to user
  clear counters : clear max statistics counters (add 'all' for all counters)
  show info      : report information about the running process [desc|json|typed]*
  show stat      : report counters for each proxy and server [desc|json|typed]*
  show schema json : report schema used for stats
  show sess [id] : report the list of current sessions or dump this session
  shutdown session : kill a specific session
  shutdown sessions server : kill sessions on a server
  disable agent  : disable agent checks (use 'set server' instead)
  disable health : disable health checks (use 'set server' instead)
  disable server : disable a server for maintenance (use 'set server' instead)
  enable agent   : enable agent checks (use 'set server' instead)
  enable health  : enable health checks (use 'set server' instead)
  enable server  : enable a disabled server (use 'set server' instead)
  set maxconn server : change a server's maxconn setting
  set server     : change a server's state, weight or address
  get weight     : report a server's current weight
  set weight     : change a server's weight (deprecated)
  show startup-logs : report logs emitted during HAProxy startup
  clear table    : remove an entry from a table
  set table [id] : update or create a table entry's data
  show table [id]: report table usage stats or dump this table's contents
  add acl        : add acl entry
  clear acl <id> : clear the content of this acl
  del acl        : delete acl entry
  get acl        : report the patterns matching a sample for an ACL
  show acl [id]  : report available acls or dump an acl's contents
  add map        : add map entry
  clear map <id> : clear the content of this map
  del map        : delete map entry
  get map        : report the keys and values matching a sample for a map
  set map        : modify map entry
  show map [id]  : report available maps or dump a map's contents
  show events [
] : show event sink state
  show threads   : show some threads debugging information
  show peers [peers section]: dump some information about all the peers or this peers section
  disable frontend : temporarily disable specific frontend
  enable frontend : re-enable specific frontend
  set maxconn frontend : change a frontend's maxconn setting
  show servers conn [id]: dump server connections status (for backend <id>)
  show servers state [id]: dump volatile server information (for backend <id>)
  show backend   : list backends in the current running config
  shutdown frontend : stop a specific frontend
  set dynamic-cookie-key backend : change a backend secret key for dynamic cookies
  enable dynamic-cookie backend : enable dynamic cookies on a specific backend
  disable dynamic-cookie backend : disable dynamic cookies on a specific backend
  show errors    : report last request and response errors for each proxy
  show resolvers [id]: dumps counters from all resolvers section and
                     associated name servers
  show pools     : report information about the memory pools usage
  show profiling : show CPU profiling options
  set  profiling : enable/disable CPU profiling
  show cache     : show cache status
  trace <module> [cmd [args…]] : manage live tracing
  show trace [
] : show live tracing state
 

2. View haproxy running threads

root@pcfreak:/home/hipo/info# echo "show threads" | socat stdio /var/run/haproxy/haproxy.sock
  Thread 1 : id=0x7f87b6e2c1c0 act=0 glob=0 wq=1 rq=0 tl=0 tlsz=0 rqsz=0
             stuck=0 prof=0 harmless=1 wantrdv=0
             cpu_ns: poll=3061065069437 now=3061065077880 diff=8443
             curr_task=0
* Thread 2 : id=0x7f87b6e20700 act=1 glob=0 wq=1 rq=0 tl=0 tlsz=0 rqsz=0
             stuck=0 prof=0 harmless=0 wantrdv=0
             cpu_ns: poll=2969050092523 now=2969050197848 diff=105325
             curr_task=0x7f87b006f740 (task) calls=1 last=0
               fct=0x560978846340(task_run_applet) ctx=0x7f87b0190720(<CLI>)
             strm=0x56097a763560 src=unix fe=GLOBAL be=GLOBAL dst=<CLI>
             rqf=c48200 rqa=0 rpf=80008000 rpa=0 sif=EST,200008 sib=EST,204018
             af=(nil),0 csf=0x56097a776ef0,8200
             ab=0x7f87b0190720,9 csb=(nil),0
             cof=0x56097a77fb00,1300:PASS(0x7f87b019a680)/RAW((nil))/unix_stream(22)
             cob=(nil),0:NONE((nil))/NONE((nil))/NONE(0)

3. Show haproxy server connections

root@pcfreak:/home/hipo/info# echo "show servers conn" | socat stdio /var/run/haproxy/haproxy.sock
# bkname/svname bkid/svid addr port – purge_delay used_cur used_max need_est unsafe_nb safe_nb idle_lim idle_cur idle_per_thr[2]
http-websrv/ha1server-1 3/1 192.168.0.209 80 – 5000 0 12 12 0 0 -1 0 0 0
http-websrv/ha1server-2 3/2 192.168.0.200 80 – 5000 1 142 142 0 0 -1 0 0 0
http-websrv/ha1server-3 3/3 192.168.1.30 80 – 5000 0 0 0 0 0 -1 0 0 0
http-websrv/ha1server-4 3/4 192.168.1.14 80 – 5000 0 0 0 0 0 -1 0 0 0
http-websrv/ha1server-5 3/5 192.168.0.1 80 – 5000 0 13 13 0 0 -1 0 0 0
https-websrv/ha1server-1 5/1 192.168.0.209 443 – 5000 0 59 59 0 0 -1 0 0 0
https-websrv/ha1server-2 5/2 192.168.0.200 443 – 5000 11 461 461 0 0 -1 0 0 0
https-websrv/ha1server-3 5/3 192.168.1.30 443 – 5000 0 0 0 0 0 -1 0 0 0
https-websrv/ha1server-4 5/4 192.168.1.14 443 – 5000 0 0 0 0 0 -1 0 0 0
https-websrv/ha1server-5 5/5 192.168.0.1 443 – 5000 1 152 152 0 0 -1 0 0 0
MASTER/cur-1 6/1 – 0 – 0 0 0 0 0 0 0 0

4. Show Load balancer servers state

root@pcfreak:/home/hipo/info# echo "show servers state" | socat stdio /var/run/haproxy/haproxy.sock
1
# be_id be_name srv_id srv_name srv_addr srv_op_state srv_admin_state srv_uweight srv_iweight srv_time_since_last_change srv_check_status srv_check_result srv_check_health srv_check_state srv_agent_state bk_f_forced_id srv_f_forced_id srv_fqdn srv_port srvrecord
3 http-websrv 1 ha1server-1 192.168.0.209 2 0 254 254 3929 6 3 4 6 0 0 0 – 80 –
3 http-websrv 2 ha1server-2 192.168.0.200 2 0 255 255 3928 6 3 4 6 0 0 0 – 80 –
3 http-websrv 3 ha1server-3 192.168.1.30 2 0 252 252 3927 6 3 4 6 0 0 0 – 80 –
3 http-websrv 4 ha1server-4 192.168.1.14 2 0 253 253 3929 6 3 4 6 0 0 0 – 80 –
3 http-websrv 5 ha1server-5 192.168.0.1 2 0 251 251 1708087 6 3 4 6 0 0 0 – 80 –
5 https-websrv 1 ha1server-1 192.168.0.209 2 0 254 254 3929 6 3 4 6 0 0 0 – 443 –
5 https-websrv 2 ha1server-2 192.168.0.200 2 0 255 255 3928 6 3 4 6 0 0 0 – 443 –
5 https-websrv 3 ha1server-3 192.168.1.30 2 0 252 252 3927 6 3 4 6 0 0 0 – 443 –
5 https-websrv 4 ha1server-4 192.168.1.14 2 0 253 253 3929 6 3 4 6 0 0 0 – 443 –
5 https-websrv 5 ha1server-5 192.168.0.1 2 0 251 251 1708087 6 3 4 6 0 0 0 – 443 –
6 MASTER 1 cur-1 – 2 0 0 0 1708087 1 0 0 0 0 0 0 – 0 –

5. Get general haproxy info on variables that can be used for Load Balancer fine tuning

root@pcfreak:/home/hipo/info# echo "show info" | socat stdio /var/run/haproxy/haproxy.sock
Name: HAProxy
Version: 2.2.9-2+deb11u5
Release_date: 2023/04/10
Nbthread: 2
Nbproc: 1
Process_num: 1
Pid: 3103635
Uptime: 19d 18h11m49s
Uptime_sec: 1707109
Memmax_MB: 0
PoolAlloc_MB: 1
PoolUsed_MB: 0
PoolFailed: 0
Ulimit-n: 200059
Maxsock: 200059
Maxconn: 99999
Hard_maxconn: 99999
CurrConns: 8
CumConns: 19677218
CumReq: 2740072
MaxSslConns: 0
CurrSslConns: 0
CumSslConns: 0
Maxpipes: 0
PipesUsed: 0
PipesFree: 0
ConnRate: 1
ConnRateLimit: 0
MaxConnRate: 2161
SessRate: 1
SessRateLimit: 0
MaxSessRate: 2161
SslRate: 0
SslRateLimit: 0
MaxSslRate: 0
SslFrontendKeyRate: 0
SslFrontendMaxKeyRate: 0
SslFrontendSessionReuse_pct: 0
SslBackendKeyRate: 0
SslBackendMaxKeyRate: 0
SslCacheLookups: 0
SslCacheMisses: 0
CompressBpsIn: 0
CompressBpsOut: 0
CompressBpsRateLim: 0
ZlibMemUsage: 0
MaxZlibMemUsage: 0
Tasks: 32
Run_queue: 1
Idle_pct: 100
node: pcfreak
Stopping: 0
Jobs: 13
Unstoppable Jobs: 0
Listeners: 4
ActivePeers: 0
ConnectedPeers: 0
DroppedLogs: 0
BusyPolling: 0
FailedResolutions: 0
TotalBytesOut: 744390344175
BytesOutRate: 30080
DebugCommandsIssued: 0
Build info: 2.2.9-2+deb11u5
 

root@pcfreak:/home/hipo/info# echo "show errors" | socat stdio /var/run/haproxy/haproxy.sock
Total events captured on [14/Dec/2023:17:29:17.930] : 0

6. View all opened sessions and, the session age (time since it has been opened) and session exp (expiry)

root@pcfreak:/home/hipo/info# echo "show sess" | socat stdio /var/run/haproxy/haproxy.sock
0x56097a763560: proto=tcpv4 src=113.120.74.123:54651 fe=https-in be=https-websrv srv=ha1server-2 ts=00 age=37s calls=3 rate=0 cpu=0 lat=0 rq[f=848000h,i=0,an=00h,rx=1m58s,wx=,ax=] rp[f=80048202h,i=0,an=00h,rx=,wx=1m58s,ax=] s0=[8,200000h,fd=24,ex=] s1=[8,40018h,fd=25,ex=] exp=1m51s
0x56097a812830: proto=tcpv4 src=190.216.236.134:35526 fe=https-in be=https-websrv srv=ha1server-2 ts=00 age=17s calls=3 rate=0 cpu=0 lat=0 rq[f=848202h,i=0,an=00h,rx=1m42s,wx=,ax=] rp[f=80048202h,i=0,an=00h,rx=1m42s,wx=,ax=] s0=[8,200008h,fd=40,ex=] s1=[8,200018h,fd=41,ex=] exp=12s
0x56097a784ad0: proto=tcpv4 src=103.225.203.131:33835 fe=https-in be=https-websrv srv=ha1server-2 ts=00 age=17s calls=2 rate=0 cpu=0 lat=0 rq[f=848202h,i=0,an=00h,rx=1m44s,wx=,ax=] rp[f=80048202h,i=0,an=00h,rx=1m44s,wx=,ax=] s0=[8,200008h,fd=20,ex=] s1=[8,200018h,fd=21,ex=] exp=13s
0x7f87b0082cc0: proto=tcpv4 src=190.216.236.134:35528 fe=https-in be=https-websrv srv=ha1server-2 ts=00 age=14s calls=3 rate=0 cpu=0 lat=0 rq[f=848202h,i=0,an=00h,rx=1m46s,wx=,ax=] rp[f=80048202h,i=0,an=00h,rx=1m46s,wx=,ax=] s0=[8,200008h,fd=34,ex=] s1=[8,200018h,fd=35,ex=] exp=15s
0x7f87b0089e10: proto=tcpv4 src=40.130.105.242:50669 fe=https-in be=https-websrv srv=ha1server-2 ts=00 age=11s calls=2 rate=0 cpu=0 lat=0 rq[f=848202h,i=0,an=00h,rx=1m49s,wx=,ax=] rp[f=80048202h,i=0,an=00h,rx=1m49s,wx=,ax=] s0=[8,200008h,fd=15,ex=] s1=[8,200018h,fd=16,ex=] exp=18s
0x7f87b010b450: proto=tcpv4 src=64.62.202.82:37562 fe=https-in be=https-websrv srv=ha1server-2 ts=00 age=7s calls=2 rate=0 cpu=0 lat=0 rq[f=848202h,i=0,an=00h,rx=1m52s,wx=,ax=] rp[f=80048202h,i=0,an=00h,rx=1m52s,wx=,ax=] s0=[8,200008h,fd=26,ex=] s1=[8,200018h,fd=27,ex=] exp=22s
0x56097a7b8bc0: proto=tcpv4 src=85.208.96.211:54226 fe=https-in be=https-websrv srv=ha1server-2 ts=00 age=0s calls=2 rate=2 cpu=0 lat=0 rq[f=848202h,i=0,an=00h,rx=1m59s,wx=,ax=] rp[f=80048202h,i=0,an=00h,rx=1m59s,wx=,ax=] s0=[8,200008h,fd=22,ex=] s1=[8,200018h,fd=23,ex=] exp=29s
0x7f87b008ec00: proto=tcpv4 src=3.135.192.206:60258 fe=http-in be=http-websrv srv=ha1server-2 ts=00 age=0s calls=2 rate=2 cpu=0 lat=0 rq[f=848000h,i=0,an=00h,rx=1m59s,wx=1m59s,ax=] rp[f=80008000h,i=0,an=00h,rx=1m59s,wx=1m59s,ax=] s0=[8,200008h,fd=28,ex=] s1=[8,200018h,fd=29,ex=] exp=29s
0x56097a7b2490: proto=tcpv4 src=45.147.249.119:62283 fe=https-in be=https-websrv srv=ha1server-2 ts=00 age=0s calls=3 rate=3 cpu=0 lat=0 rq[f=848202h,i=0,an=00h,rx=1m59s,wx=,ax=] rp[f=80048202h,i=0,an=00h,rx=1m59s,wx=,ax=] s0=[8,200008h,fd=17,ex=] s1=[8,200018h,fd=18,ex=] exp=29s
0x7f87b0114f90: proto=unix_stream src=unix:1 fe=GLOBAL be=<NONE> srv=<none> ts=00 age=0s calls=1 rate=1 cpu=0 lat=0 rq[f=c48200h,i=0,an=00h,rx=,wx=,ax=] rp[f=80008002h,i=0,an=00h,rx=,wx=,ax=] s0=[8,200008h,fd=30,ex=] s1=[8,204018h,fd=-1,ex=] exp=

root@pcfreak:/home/hipo/info#

7. Disabling an haproxy frontend via UNIX socket

If you get some frontend that gets broken and this is monitored in Zabbix or other monitoring tool used to monitor you can use the haproxy stats interface to disable frontend

root@pcfreak:/home/hipo/info# echo "disable frontend https-websrv" | socat stdio /var/run/haproxy/haproxy.sock

8. Show general haproxy statistics (could tell you much about customer connections health state) and state of connection to backend

Lets check uptime details for frontends / backends, that is done with show stat command.

root@pcfreak:/home/hipo/info# echo "show stat" | socat stdio /var/run/haproxy/haproxy.sock
#


pxname,svname,qcur,qmax,scur,smax,slim,stot,bin,bout,dreq,dresp,ereq,econ,eresp

,wretr,wredis,status,weight,act,bck,chkfail,chkdown,lastchg,downtime,qlimit,
pid,iid,sid,throttle,lbtot,tracked,type,rate,rate_lim,rate_max,check_status

,check_code,check_duration,hrsp_1xx,hrsp_2xx,hrsp_3xx,hrsp_4xx

,hrsp_5xx,hrsp_other,hanafail,req_rate,req_rate_max,req_tot,cli_abrt

,srv_abrt,comp_in,comp_out,comp_byp,comp_rsp,lastsess,last_chk

,last_agt,qtime,ctime,rtime,ttime,agent_status,agent_code,

agent_duration,check_desc,agent_desc,check_rise,

check_fall,check_health,agent_rise,

agent_fall,agent_health,addr,cookie,mode,

algo,conn_rate,conn_rate_max,conn_tot,intercepted

,dcon,dses,wrew,connect,reuse,cache_lookups,

cache_hits,srv_icur,src_ilim,qtime_max,ctime_max,

rtime_max,ttime_max,eint,idle_conn_cur,

safe_conn_cur,used_conn_cur,need_conn_est,

    http-in,FRONTEND,,,0,142,99999,371655,166897324,

1462777381,0,0,62,,,,,OPEN,,,,,,,,,1,2,0,,,,0,0,0,

1080,,,,,,,,,,,0,0,0,,,0,0,0,0,,,,,,,,,,,,,,,,,,,,,tcp,,0,1080,

371655,,0,0,0,,,,,,,,,,,0,,,,,

    http-websrv,ha1server-1,0,0,0,12,,9635,3893561

,64880833,,0,,0,3,15,0,UP

,254,0,1,41,9,4686,34728,,1,3,1,,4924,,2,0,,56,L4OK

,,0,,,,,,,,,,,900,168,,,,,1292679,,,0,0,0,2843,,,,

Layer4 check passed,,2,3,4,,,,192.168.0.209:80,,tcp,,,,,,,,

0,9635,0,,,0,,0,15024,0,672888,0,0,0,0,12,

    http-websrv,ha1server-2,0,0,0,142,,321867,

149300590,1350577153,,0,,

1,4,30,0,UP,255,1,0,37,10,4685,89418,,1,3,2,,111864,,2

,0,,1080,L4OK,,0,,,,,,,,,,,37161,4822,,,,,6,,,0,12,0,

2120,,,,Layer4 check passed,,2,3,4,,,,192.168.0.200:80,,tcp,,,,,,,,0,321867,

0,,,0,,0,30223,0,1783442,0,0,0,0,142,

List continues here
….

..
.


9. Using netcat to view UNIX socket instead of socat

If you don't have the socat command on the server but you have netcat installed, you can also send the commands to the running haproxy daemon via nc's capability to send via UNIX socket via nc -U option.

   -U      Use UNIX-domain sockets.  Cannot be used together with -F or -x.


root@pcfreak:/home/hipo/info# echo "set server"|nc -U /var/run/haproxy/haproxy.sock
Require 'backend/server'.

10. Get only statistics about running LB Backends and Frontends

To get only haproxy statistics about running Load Balancer BACKENDs and FRONTENDs

root@pcfreak:/home/hipo/info# echo "show stat" | sudo socat unix-connect:/var/run/haproxy/haproxy.sock stdio | awk -F '.' '/BACKEND/ {print $1, $6}'
http-websrv,BACKEND,0,0,2,142,10000,371880,167022255,1462985601,0,0,,1,7,46,0,UP

,255,1,4,,0,1709835,0,,1,3,0,,118878,,1,0,,1080,,,,,,,,,,,,,,38782,5001,0,0,0,0,5,,,0,8,0,2034

,,,,,,,,,,,,,,tcp,source,,,,,,,0,371864,0,,,,,0,30223,0,1783442,0,,,,,
https-websrv,BACKEND,0,0,5,461,10000,2374328,3083873321,740021649129,0,0,,28,42,626,0,UP
,255,1,4,,0,1709835,0,,1,5,0,,474550,,1,1,,1081,,,,,,,,,,,,,,451783,72307,0,0,0,0,0,,,0,0,0,6651

,,,,,,,,,,,,,,tcp,source,,,,,,,0,2374837,0,,,,,0,32794,0,46414141,0,,,,,

As you can see there are two configured BACKENDs that are in UP state, the other possibility is that they're DOWN if haproxy can't reach the backend.

root@pcfreak:/home/hipo/info# echo "show stat" | sudo socat unix-connect:/var/run/haproxy/haproxy.sock stdio | awk -F '.' '/FRONTEND/ {print $1, $6}'
http-in,FRONTEND,,,2,142,99999,371887,167024040,1462990718,0,0,62,,,,,OPEN

,,,,,,,,,1,2,0,,,,0,1,0,1080,,,,,,,,,,,0,0,0,,,0,0,0,0,,,,,,,,,,,,,,,,,,,,,tcp,,1,1080,371887,,0,0,0,,,,,,,,,,,0,,,,,
https-in,FRONTEND,,,4,461,99999,2374337,3083881912,740021909870,0,0,112,,,,,OPEN

,,,,,,,,,1,4,0,,,,0,1,0,1081,,,,,,,,,,,0,0,0,,,0,0,0,0,,,,,,,,,,,,,,,,,,,,,tcp,,1,1081,2374337,,0,0,0,,,,,,,,,,,0,,,,,
root@pcfreak:/home/hipo/info#

As you can see from the list of show help you can change maxconns supported, change the proxy rate-limit and even in real time change a haproxy.cfg configured section timeouts or even modify ACLs dynamicly for Backends and Frontends.

If you use those to make a modifications to the haproxy, that modifications should been written also to Haproxy's configured instance haproxy.cfg file.
If you want to check it reload the haproxy instance with the new written haproxy.cfg, through the Unix socket.

11. Shutting down specific opened sessions

Shutting down specific session that has been opened for too long is particularly useful to do, especially if you have some kind of VPN encryption device before the Haproxy server and an Application Backend server that is buggy and fails to properly close sessions at time, to cut off a specific sessions that has been hanging for days after reviewing it with "show sess".

root@pcfreak:/home/hipo/info# echo "shutdown session 0x56097a7707d0" | socat stdio /var/run/haproxy/haproxy.sock

12. Sending shutdown to backend on a certain configured LB service


To bring down a configured backend on a certain server after listing it:
 

root@pcfreak:/home/hipo/info# echo "disable server bk_mybackend/srv_myserver" | socat /var/run/haproxy.sock stdio


12. Sending multiple commands to haproxy socket

# echo "show info;show stat" | socat /var/run/haproxy/haproxy.sock stdio


13. Report table usage information or dump table data content


It is possible to view exact queued connections inside the sticky table. To get a list of available, available configured tables on the haproxy

root@pcfreak:/home/hipo/info# echo "show table" | socat /var/run/haproxy/haproxy.sock stdio
# table: https-websrv, type: ip, size:204800, used:498
# table: http-websrv, type: ip, size:204800, used:74


To get the exact record of queued IPs inside https-websrv.

root@pcfreak:/home/hipo/info# echo "show table https-websrv" | socat /var/run/haproxy/haproxy.sock stdio|head -10
# table: https-websrv, type: ip, size:204800, used:502
0x56097a7444e0: key=2.147.73.42 use=0 exp=1090876 server_id=2 server_name=ha1server-2
0x56097a792ac0: key=3.14.130.119 use=0 exp=1038004 server_id=2 server_name=ha1server-2
0x7f87b006a4e0: key=3.15.203.28 use=0 exp=1536721 server_id=2 server_name=ha1server-2
0x56097a7467f0: key=3.16.54.132 use=0 exp=387191 server_id=2 server_name=ha1server-2
0x7f87b0075f90: key=3.17.180.28 use=0 exp=353211 server_id=2 server_name=ha1server-2
0x56097a821b10: key=3.23.114.130 use=0 exp=1521100 server_id=2 server_name=ha1server-2
0x56097a7475b0: key=3.129.250.144 use=0 exp=121043 server_id=2 server_name=ha1server-2
0x7f87b004d240: key=3.134.112.27 use=0 exp=1182169 server_id=2 server_name=ha1server-2
0x56097a754c90: key=3.135.192.206 use=0 exp=1383882 server_id=2 server_name=ha1server-2

14. Show information about Haproxy startup

Sometimes, where logrotation is integrated on the server and haproxy's logs are log rotated to a central logging server, it might be hard to get information about Haproxy startup messages (warnings, errors etc.).
As digging through old haproxy logs might be tedious, you can simply get it via the stats interface.

root@pcfreak:/home/hipo/info# echo "show startup-logs" | socat unix-connect:/var/run/haproxy/haproxy.sock stdio              

[WARNING] 327/231534 (3103633) : parsing [/etc/haproxy/haproxy.cfg:62] : 'fullconn' ignored because frontend 'http-in' has no backend capability. Maybe you want 'maxconn' instead ?
[WARNING] 327/231534 (3103633) : parsing [/etc/haproxy/haproxy.cfg:69] : 'maxconn' ignored because backend 'http-websrv' has no frontend capability. Maybe you want 'fullconn' instead ?
[WARNING] 327/231534 (3103633) : parsing [/etc/haproxy/haproxy.cfg:114] : 'maxconn' ignored because backend 'https-websrv' has no frontend capability. Maybe you want 'fullconn' instead ?
[WARNING] 327/231534 (3103633) : config : missing timeouts for frontend 'http-in'.
   | While not properly invalid, you will certainly encounter various problems
   | with such a configuration. To fix this, please ensure that all following
   | timeouts are set to a non-zero value: 'client', 'connect', 'server'.
[WARNING] 327/231534 (3103633) : config : 'option forwardfor' ignored for frontend 'http-in' as it requires HTTP mode.
[WARNING] 327/231534 (3103633) : config : 'option forwardfor' ignored for backend 'http-websrv' as it requires HTTP mode.
[WARNING] 327/231534 (3103633) : config : missing timeouts for frontend 'https-in'.
   | While not properly invalid, you will certainly encounter various problems
   | with such a configuration. To fix this, please ensure that all following
   | timeouts are set to a non-zero value: 'client', 'connect', 'server'.
[WARNING] 327/231534 (3103633) : config : 'option forwardfor' ignored for frontend 'https-in' as it requires HTTP mode.
[WARNING] 327/231534 (3103633) : config : 'option forwardfor' ignored for backend 'https-websrv' as it requires HTTP mode.

15. Disable / Enable health check for haproxy configured backend

 Disable health checks is useful, especially on non production server environments, during integration phase of application with Haproxy load balancer.

The general syntax is like this:

> disable health backend/server1


root@pcfreak:/home/hipo/info# echo "show servers state" | socat unix-connect:/var/run/haproxy/haproxy.sock stdio             1
# be_id be_name srv_id srv_name srv_addr srv_op_state srv_admin_state srv_uweight srv_iweight srv_time_since_last_change srv_check_status srv_check_result srv_check_health srv_check_state srv_agent_state bk_f_forced_id srv_f_forced_id srv_fqdn srv_port srvrecord
3 http-websrv 1 ha1server-1 192.168.0.209 2 0 254 254 13709 6 3 4 6 0 0 0 – 80 –
3 http-websrv 2 ha1server-2 192.168.0.200 2 0 255 255 13708 6 3 4 6 0 0 0 – 80 –
3 http-websrv 3 ha1server-3 192.168.1.30 2 0 252 252 13707 6 3 4 6 0 0 0 – 80 –
3 http-websrv 4 ha1server-4 192.168.1.14 2 0 253 253 13709 6 3 4 6 0 0 0 – 80 –
3 http-websrv 5 ha1server-5 192.168.0.1 2 0 251 251 1717867 6 3 4 6 0 0 0 – 80 –
5 https-websrv 1 ha1server-1 192.168.0.209 2 0 254 254 13709 6 3 4 6 0 0 0 – 443 –
5 https-websrv 2 ha1server-2 192.168.0.200 2 0 255 255 13708 6 3 4 6 0 0 0 – 443 –
5 https-websrv 3 ha1server-3 192.168.1.30 2 0 252 252 13707 6 3 4 6 0 0 0 – 443 –
5 https-websrv 4 ha1server-4 192.168.1.14 2 0 253 253 13709 6 3 4 6 0 0 0 – 443 –
5 https-websrv 5 ha1server-5 192.168.0.1 2 0 251 251 1717867 6 3 4 6 0 0 0 – 443 –
6 MASTER 1 cur-1 – 2 0 0 0 1717867 1 0 0 0 0 0 0 – 0 –


Lets disable health checks for ha1server-1 server and http-websrv backend.

root@pcfreak:/home/hipo/info# echo "disable health http-websrv/ha1server-1" | socat unix-connect:/var/run/haproxy/haproxy.sock stdio


To enable back health checks 

root@pcfreak:/home/hipo/info# echo "enable health http-websrv/ha1server-1" | socat unix-connect:/var/run/haproxy/haproxy.sock stdio

16. Change weight for server

if you have a round-robin Load balancing configured and already have a predefined configuration on how many percentage of the server to be sent to which application server (e.g. have a configured weight to dynamically change it via UNIX sock iface).

# Change weight by percentage of its original value

# socat unix-connect:/var/run/haproxy/haproxy.sock stdio


> set server be_app/webserv1 weight 50%
 
# Change weight in proportion to other servers
> set server be_app/webserv1 weight 100


root@pcfreak:/home/hipo/info#  socat unix-connect:/var/run/haproxy/haproxy.sock stdio                                        
set server http-websrv/ha1server-1 weight 50%
Backend is using a static LB algorithm and only accepts weights '0%' and '100%'.

17. Draining traffic from server / backend App in case of Maintenance

You can gradually drain traffic away from a particular server if those backend Application server should be put in maintenance mode for update or whatever. The drain option is very interesting and combined with scripting does open a lot of possibilities for the Load balancer system administrator to put an extra automation.

To drain, set server command with the state argument set to drain:
 

# Drain traffic
> set server backend_app/server1 state drain

# Allow server to accept traffic again
> set server backend_app/server1 state ready


root@pcfreak:/home/hipo/info#  socat unix-connect:/var/run/haproxy/haproxy.sock stdio
set server http-websrv/ha1server-1 state drain


root@pcfreak:/home/hipo/info#  socat unix-connect:/var/run/haproxy/haproxy.sock stdio
set server http-websrv/ha1server-1 state ready

18. Run Interactive Mode connection to haproxy UNIX stats socket

For a haproxies that has multiple configured proxied rules backends / frontends, it is nice to use the interactive mode.
Instead of processing a single line of semicolon separate commands, HAProxy takes one command at a time and waits for the user.
In interactive mode, HAProxy sends a “>” character and waits for input command. After command is submitted, HAProxy sends back the result and waits for a new command.
The interactive mode is especially useful during phase of integrating a new haproxy towards an application, where multiple things has to be tuned on the fly without, reloading the haproxy again and again.

On RPM based distros socat is compiled to have the readline interactive capability. Thus to use the haproxy haproxy stats connect interactive mode on RHEL / CentOS / Fedora and other RPM based distros simply use:

# socat /var/run/haproxy.sock readline
> show info
Name: HAProxy
Version: 2.2.9-2+deb11u5
Release_date: 2023/04/10
Nbthread: 2
Nbproc: 1
Process_num: 1
Pid: 3103635
Uptime: 19d 20h48m50s
Uptime_sec: 1716530
Memmax_MB: 0
PoolAlloc_MB: 1
PoolUsed_MB: 0
PoolFailed: 0
Ulimit-n: 200059
Maxsock: 200059
Maxconn: 99999
Hard_maxconn: 99999
CurrConns: 9
CumConns: 19789176
CumReq: 2757976
MaxSslConns: 0
CurrSslConns: 0
CumSslConns: 0
Maxpipes: 0
PipesUsed: 0
PipesFree: 0
ConnRate: 0
ConnRateLimit: 0
MaxConnRate: 2161
SessRate: 0
SessRateLimit: 0
MaxSessRate: 2161
SslRate: 0
SslRateLimit: 0
MaxSslRate: 0
SslFrontendKeyRate: 0
SslFrontendMaxKeyRate: 0
SslFrontendSessionReuse_pct: 0
SslBackendKeyRate: 0
SslBackendMaxKeyRate: 0
SslCacheLookups: 0
SslCacheMisses: 0
CompressBpsIn: 0
CompressBpsOut: 0
CompressBpsRateLim: 0
ZlibMemUsage: 0
MaxZlibMemUsage: 0
Tasks: 35
Run_queue: 1
Idle_pct: 100
node: pcfreak
Stopping: 0
Jobs: 14
Unstoppable Jobs: 0
Listeners: 4
ActivePeers: 0
ConnectedPeers: 0
DroppedLogs: 0
BusyPolling: 0
FailedResolutions: 0
TotalBytesOut: 744964070459
BytesOutRate: 0
DebugCommandsIssued: 0
Build info: 2.2.9-2+deb11u5

On Deb (Debian) based distributions such as Debian, Ubuntu Mint Linux, unfortunately the readline inractive mode is disabled due to licensing issues that makes readline not GPL license compliant.

root@pcfreak:/home/hipo/info# socat -V|awk 'NR < 5 || tolower($0) ~ /readline/'
socat by Gerhard Rieger and contributors – see www.dest-unreach.org
socat version 1.7.4.1 on Feb  3 2021 12:58:17
   running on Linux version #1 SMP Debian 5.10.179-3 (2023-07-27), release 5.10.0-23-amd64, machine x86_64
features:
  #undef WITH_READLINE

There is a workaround to emulate the Intearactive mode on Debians however like this:

root@pcfreak:/home/hipo/info# while [ 1 ]; do socat – /var/run/haproxy/haproxy.sock ; done

show table
# table: https-websrv, type: ip, size:204800, used:511
# table: http-websrv, type: ip, size:204800, used:67

show sess
0x56097a784ad0: proto=tcpv4 src=45.61.161.66:51416 fe=https-in be=https-websrv srv=ha1server-2 ts=00 age=1m13s calls=3 rate=0 cpu=0 lat=0 rq[f=848000h,i=0,an=00h,rx=47s,wx=,ax=] rp[f=80048000h,i=0,an=00h,rx=47s,wx=,ax=] s0=[8,200008h,fd=17,ex=] s1=[8,200018h,fd=23,ex=] exp=47s
0x56097a7707d0: proto=tcpv4 src=47.128.41.242:39372 fe=https-in be=https-websrv srv=ha1server-2 ts=00 age=16s calls=2 rate=0 cpu=0 lat=0 rq[f=848202h,i=0,an=00h,rx=1m45s,wx=,ax=] rp[f=80048202h,i=0,an=00h,rx=1m45s,wx=,ax=] s0=[8,200008h,fd=35,ex=] s1=[8,200018h,fd=36,ex=] exp=14s
0x56097a781300: proto=tcpv4 src=54.36.148.40:17439 fe=https-in be=https-websrv srv=ha1server-2 ts=00 age=13s calls=2 rate=0 cpu=0 lat=0 rq[f=848202h,i=0,an=00h,rx=1m47s,wx=,ax=] rp[f=80048202h,i=0,an=00h,rx=1m47s,wx=,ax=] s0=[8,200008h,fd=26,ex=] s1=[8,200018h,fd=28,ex=] exp=17s
0x56097a7fca80: proto=tcpv4 src=18.217.94.243:4940 fe=https-in be=https-websrv srv=ha1server-2 ts=00 age=7s calls=2 rate=0 cpu=0 lat=0 rq[f=848202h,i=0,an=00h,rx=1m53s,wx=,ax=] rp[f=80048202h,i=0,an=00h,rx=1m53s,wx=,ax=] s0=[8,200008h,fd=21,ex=] s1=[8,200018h,fd=22,ex=] exp=23s
0x7f87b00778c0: proto=tcpv4 src=85.208.96.206:51708 fe=https-in be=https-websrv srv=ha1server-2 ts=00 age=4s calls=3 rate=0 cpu=0 lat=0 rq[f=848202h,i=0,an=00h,rx=1m56s,wx=,ax=] rp[f=80048202h,i=0,an=00h,rx=1m56s,wx=,ax=] s0=[8,200008h,fd=20,ex=] s1=[8,200018h,fd=24,ex=] exp=26s
0x56097a80c1e0: proto=unix_stream src=unix:1 fe=GLOBAL be=<NONE> srv=<none> ts=00 age=3s calls=1 rate=0 cpu=0 lat=0 rq[f=c48202h,i=0,an=00h,rx=10s,wx=,ax=] rp[f=80008002h,i=0,an=00h,rx=,wx=,ax=] s0=[8,200008h,fd=15,ex=] s1=[8,204018h,fd=-1,ex=] exp=7s


To end the eternal loop press CTRL + z and kill first detached job %1 run:

# kiill %1


Sum it up what learned

What we learned in this article is how to use socat and netcat to connect and manage dynamically haproxy via its haproxy stats interface, without reloading the proxqy itself. We learned how to view various statistics and information on the proxy, its existing tables, caches, session information (such as age, and expiry). Also you've seen how to disable / enable configured backends as well as get available backends and frontends and their state.
You've seen how the drained option could be used to slowly drain connections towards configured backend, in case if you need to a maintenance on a backend node.
Also was pointed how to shutdown a specific long lived sessions that has been hanging and creating troubles towards app backends.

Finally, you've seen how to open an interactive connection towards the haproxy socket and send commands in a raw with socat (on distros where compiled with readline support) as well shown how to emulate the interactive mode of rest of distros whose socat is missing the readline support. 

How to disable haproxy log for certain frontend / backend or stop haproxy logging completely

Wednesday, September 14th, 2022

haproxy-disable-logging-for-single-frontend-or-backend-or-stop-message-logging-completely-globally

In my previous article I've shortly explained on how it is possible to configure multiple haproxy instances to log in separate log files as well as how to configure a specific frontend to log inside a separate file. Sometimes it is simply unnecessery to keep any kind of log file for haproxy to spare disk space or even for anonymity of traffic. Hence in this tiny article will explain how to disable globally logging for haproxy and how logging for a certain frontend or backend could be stopped.

1. Disable globally logging of haproxy service
 

Disabling globally logging for haproxy in case if you don't need the log is being achieved by redirecting the log variable to /dev/null handler and to also mute the reoccurring alert, notice and info messages, that are produced in case of some extra ordinary events during start / stop of haproxy or during mising backends etc. you can send those messages to local0 and loca1 handlers which will be discarded later by rsyslogd configuration, for example thsi can be achieved with a configuration like:
 

global     log /dev/log    local0 info alert     log /dev/log    local1 notice alert  defaults log global mode http option httplog option dontlognull


<level>    is optional and can be specified to filter outgoing messages. By
           default, all messages are sent. If a level is specified, only
           messages with a severity at least as important as this level
           will be sent. An optional minimum level can be specified. If it
           is set, logs emitted with a more severe level than this one will
           be capped to this level. This is used to avoid sending "emerg"
           messages on all terminals on some default syslog configurations.
           Eight levels are known :
             emerg  alert  crit   err    warning notice info  debug


By using the log level you can also tell haproxy to omit from logging errors from log if for some reasons haproxy receives a lot of errors and this is flooding your logs, like this:

    backend Backend_Interface
  http-request set-log-level err
  no log


But sometimes you might need to disable it for a single frontend only and comes the question.


2. How to disable logging for a single frontend interface?

I thought that might be more complex but it was pretty easy with the option dontlog-normal haproxy.cfg variable:

Here is sample configuration with frontend and backend on how to instrucruct the haproxy frontend to disable all logging for the frontend
 

frontend ft_Frontend_Interface
#        log  127.0.0.1 local4 debug
        bind 10.44.192.142:12345
       
option dontlog-normal
        mode tcp
        option tcplog

              timeout client 350000
        log-format [%t]\ %ci:%cp\ %fi:%fp\ %b/%s:%sp\ %Tw/%Tc/%Tt\ %B\ %ts\ %ac/%fc/%bc/%sc/%rc\ %sq/%bq
        default_backend bk_WLP_echo_port_service

backend bk_Backend_Interface
                        timeout server 350000
                        timeout connect 35000
        server serverhost1 10.10.192.12:12345 weight 1 check port 12345
        server serverhost2 10.10.192.13:12345 weight 3 check port 12345


As you can see from those config, we have also enabled as a check port 12345 which is the application port service if something goes wrong with the application and 12345 is not anymore responding the respective server will get excluded automatically by haproxy and only one of machines will serve, the weight tells it which server will have the preference to serve the traffic the weight ratio will be 1 request will end up on one machine and 3 requests on the other machine.


3. How to disable single configured backend to not log anything but still have a log for the frontend
 

Omit the use of option dontlog normal from frontend inside the backend just set  no log:

backend bk_Backend_Interface
                       
 no log
                        timeout server 350000
                        timeout connect 35000
        server serverhost1 10.10.192.12:12345 weight 1 check port 12345
        server serverhost2 10.10.192.13:12345 weight 3 check port 12345

That's all reload haproxy service on the machine and backend will no longer log to your default configured log file via the respective local0 – local6 handler.

How to configure multiple haproxies and frontends to log in separate log files via rsyslog

Monday, September 5th, 2022

log-multiple-haproxy-servers-to-separate-files-log-haproxy-froentend-to-separate-file-haproxy-rsyslog-Logging-diagram
In my last article How to create multiple haproxy instance separate processes for different configuration listeners,  I've shortly explained how to create a multiple instances of haproxies by cloning the systemd default haproxy.service and the haproxy.cfg to haproxyX.cfg.
But what if you need also to configure a separate logging for both haproxy.service and haproxy-customname.service instances how this can be achieved?

The simplest way is to use some system local handler staring from local0 to local6, As local 1,2,3 are usually used by system services a good local handler to start off would be at least 4.
Lets say we already have the 2 running haproxies, e.g.:

[root@haproxy2:/usr/lib/systemd/system ]# ps -ef|grep -i hapro|grep -v grep
root      128464       1  0 Aug11 ?        00:01:19 /usr/sbin/haproxy -Ws -f /etc/haproxy/haproxy.cfg -p /run/haproxy.pid -S /run/haproxy-master.sock
haproxy   128466  128464  0 Aug11 ?        00:49:29 /usr/sbin/haproxy -Ws -f /etc/haproxy/haproxy.cfg -p /run/haproxy.pid -S /run/haproxy-master.sock

root      346637       1  0 13:15 ?        00:00:00 /usr/sbin/haproxy-customname-wrapper -Ws -f /etc/haproxy/haproxy_customname_prod.cfg -p /run/haproxy_customname_prod.pid -S /run/haproxy-customname-master.sock
haproxy   346639  346637  0 13:15 ?        00:00:00 /usr/sbin/haproxy-customname-wrapper -Ws -f /etc/haproxy/haproxy_customname_prod.cfg -p /run/haproxy_customname_prod.pid -S /run/haproxy-customname-master.sock


1. Configure local messaging handlers to work via /dev/log inside both haproxy instance config files
 

To congigure the separte logging we need to have in /etc/haproxy/haproxy.cfg and in /etc/haproxy/haproxy_customname_prod.cfg the respective handlers.

To log in separate files you should already configured in /etc/haproxy/haproxy.cfg something like:


global
        stats socket /var/run/haproxy/haproxy.sock mode 0600 level admin #Creates Unix-Like socket to fetch stats
        log /dev/log    local0
        log /dev/log    local1 notice

#       nbproc 1
#       nbthread 2
#       cpu-map auto:1/1-2 0-1
        nbproc          1
        nbthread 2
        cpu-map         1 0
        cpu-map         2 1
        chroot /var/lib/haproxy
        user haproxy
        group haproxy
        daemon
        maxconn 99999

defaults
        log     global
        mode    tcp


        timeout connect 5000
        timeout connect 30s
        timeout server 10s

    timeout queue 5s
    timeout tunnel 2m
    timeout client-fin 1s
    timeout server-fin 1s

    option forwardfor
        maxconn 3000
    retries                 15

frontend http-in
        mode tcp

        option tcplog
        log global


        option logasap
        option forwardfor
        bind 0.0.0.0:80

default_backend webservers_http
backend webservers_http
    fullconn 20000
        balance source
stick match src
    stick-table type ip size 200k expire 30m

        server server-1 192.168.1.50:80 check send-proxy weight 255 backup
        server server-2 192.168.1.54:80 check send-proxy weight 254
        server server-3 192.168.0.219:80 check send-proxy weight 252 backup
        server server-4 192.168.0.210:80 check send-proxy weight 253 backup
        server server-5 192.168.0.5:80 maxconn 3000 check send-proxy weight 251 backup

For the second /etc/haproxy/haproxy_customname_prod.cfg the logging configuration should be similar to:
 

global
        stats socket /var/run/haproxy/haproxycustname.sock mode 0600 level admin #Creates Unix-Like socket to fetch stats
        log /dev/log    local5
        log /dev/log    local5 notice

#       nbproc 1
#       nbthread 2
#       cpu-map auto:1/1-2 0-1
        nbproc          1
        nbthread 2
        cpu-map         1 0
        cpu-map         2 1
        chroot /var/lib/haproxy
        user haproxy
        group haproxy
        daemon
        maxconn 99999

defaults
        log     global
        mode    tcp


2. Configure separate haproxy Frontend logging via local5 inside haproxy.cfg
 

As a minimum you need a configuration for frontend like:


frontend http-in
        mode tcp

        option tcplog
        log /dev/log    local5 debug
…..
….

..
.

Of course the mode tcp in my case is conditional you might be using mode http etc. 


3. Optionally but (preferrably) make local5 / local6 handlers to work via rsyslogs UDP imudp protocol


In this example /dev/log is straightly read by haproxy instead of sending the messages first to rsyslog, this is a good thing in case if you have doubts that rsyslog might stop working and respectively you might end up with no logging, however if you prefer to use instead rsyslog which most of people usually do you will have instead for /etc/haproxy/haproxy.cfg to use config:

global
    log          127.0.0.1 local6 debug

defaults
        log     global
        mode    tcp

And for /etc/haproxy_customname_prod.cfg config like:

global
    log          127.0.0.1 local5 debug

defaults
        log     global
        mode    tcp

If you're about to send the haproxy logs directly via rsyslog, it should have enabled in /etc/rsyslog.conf the imudp module if you're not going to use directly /dev/log

# provides UDP syslog reception
module(load="imudp")
input(type="imudp" port="514")


4. Prepare first and second log file and custom frontend output file and set right permissions
 

Assumably you already have /var/log/haproxy.log and this will be the initial haproxy log if you don't want to change it, normally it is installed on haproxy package install time on Linux and should have some permissions like following:

root@haproxy2:/etc/rsyslog.d# ls -al /var/log/haproxy.log
-rw-r–r– 1 haproxy haproxy 6681522  1 сеп 16:05 /var/log/haproxy.log


To create the second config with exact permissions like haproxy.log run:

root@haproxy2:/etc/rsyslog.d# touch /var/log/haproxy_customname.log
root@haproxy2:/etc/rsyslog.d# chown haproxy:haproxy /var/log/haproxy_customname.log

Create the haproxy_custom_frontend.log file that will only log output of exact frontend or match string from the logs
 

root@haproxy2:/etc/rsyslog.d# touch  /var/log/haproxy_custom_frontend.log
root@haproxy2:/etc/rsyslog.d# chown haproxy:haproxy  /var/log/haproxy_custom_frontend.log


5. Create the rsyslog config for haproxy.service to log via local6 to /var/log/haproxy.log
 

root@haproxy2:/etc/rsyslog.d# cat 49-haproxy.conf
# Create an additional socket in haproxy's chroot in order to allow logging via
# /dev/log to chroot'ed HAProxy processes
$AddUnixListenSocket /var/lib/haproxy/dev/log

# Send HAProxy messages to a dedicated logfile
:programname, startswith, "haproxy" {
  /var/log/haproxy.log
  stop
}


Above configs will make anything returned with string haproxy (e.g. proccess /usr/sbin/haproxy) to /dev/log to be written inside /var/log/haproxy.log and trigger a stop (by the way the the stop command works exactly as the tilda '~' discard one, except in some newer versions of haproxy the ~ is no now obsolete and you need to use stop instead (bear in mind that ~ even though obsolete proved to be working for me whether stop not ! but come on this is no strange this is linux mess), for example if you run latest debian Linux 11 as of September 2022 haproxy with package 2.2.9-2+deb11u3.
 

6. Create configuration for rsyslog to log from single Frontend outputting local2 to /var/log/haproxy_customname.log
 

root@haproxy2:/etc/rsyslog.d# cat 48-haproxy.conf
# Create an additional socket in haproxy's chroot in order to allow logging via
# /dev/log to chroot'ed HAProxy processes
$AddUnixListenSocket /var/lib/haproxy/dev/log

# Send HAProxy messages to a dedicated logfile
#:programname, startswith, "haproxy" {
#  /var/log/haproxy.log
#  stop
#}
# GGE/DPA 2022/08/02: HAProxy logs to local2, save the messages
local5.*                                                /var/log/haproxy_customname.log


You might also explicitly define the binary that will providing the logs inside the 48-haproxy.conf as we have a separate /usr/sbin/haproxy-customname-wrapper in that way you can log the output from the haproxy instance only based
on its binary command and you can omit writting to local5 to log via it something else 🙂

root@haproxy2:/etc/rsyslog.d# cat 48-haproxy.conf
# Create an additional socket in haproxy's chroot in order to allow logging via
# /dev/log to chroot'ed HAProxy processes
$AddUnixListenSocket /var/lib/haproxy/dev/log

# Send HAProxy messages to a dedicated logfile
#:programname, startswith, "haproxy" {
#  /var/log/haproxy.log
#  stop
#}
# GGE/DPA 2022/08/02: HAProxy logs to local2, save the messages

:programname, startswith, "haproxy-customname-wrapper " {
 
/var/log/haproxy_customname.log
  stop
}


7. Create the log file to log the custom frontend of your preference e.g. /var/log/haproxy_custom_frontend.log under local5 /prepare rsyslog config for
 

root@haproxy2:/etc/rsyslog.d# cat 47-haproxy-custom-frontend.conf
$ModLoad imudp
$UDPServerAddress 127.0.0.1
$UDPServerRun 514
#2022/02/02: HAProxy logs to local6, save the messages
local4.*                                                /var/log/haproxy_custom_frontend.log
:msg, contains, "https-in" ~

The 'https-in' is my frontend inside /etc/haproxy/haproxy.cfg it returns the name of it every time in /var/log/haproxy.log therefore I will log the frontend to local5 and to prevent double logging inside /var/log/haproxy.log of connections incoming towards the same frontend inside /var/log/haproxy.log, I have the tilda symbol '~' which instructs rsyslog to discard any message coming to rsyslog with "https-in" string in, immediately after the same frontend as configured inside /etc/haproxy/haproxy.cfg will output the frontend operations inside local5.


!!! Note that for rsyslog it is very important to have the right order of configurations, the configuration order is being considered based on the file numbering. !!!
 

Hence notice that my filter file number 47_* preceeds the other 2 configured rsyslog configs.
 

root@haproxy2:/etc/rsyslog.d# ls -1
47-haproxy-custom-frontend.conf
48-haproxy.conf
49-haproxy.conf

This will make 47-haproxy-custom-frontend.conf to be read and processed first 48-haproxy.conf processed second and 49-haproxy.conf processed third.


8. Reload rsyslog and haproxy and test


root@haproxy2: ~# systemctl restart rsyslog
root@haproxy2: ~# systemctl restart haproxy
root@haproxy2: ~# systemctl status rsyslog

● rsyslog.service – System Logging Service
     Loaded: loaded (/lib/systemd/system/rsyslog.service; enabled; vendor preset: enabled)
     Active: active (running) since Thu 2022-09-01 17:34:51 EEST; 1s ago
TriggeredBy: ● syslog.socket
       Docs: man:rsyslogd(8)
             man:rsyslog.conf(5)
             https://www.rsyslog.com/doc/
   Main PID: 372726 (rsyslogd)
      Tasks: 6 (limit: 4654)
     Memory: 980.0K
        CPU: 8ms
     CGroup: /system.slice/rsyslog.service
             └─372726 /usr/sbin/rsyslogd -n -iNONE

сеп 01 17:34:51 haproxy2 systemd[1]: Stopped System Logging Service.
сеп 01 17:34:51 haproxy2 rsyslogd[372726]: warning: ~ action is deprecated, consider using the 'stop' statement instead [v8.210>
сеп 01 17:34:51 haproxy2 systemd[1]: Starting System Logging Service…
сеп 01 17:34:51 haproxy2 rsyslogd[372726]: [198B blob data]
сеп 01 17:34:51 haproxy2 systemd[1]: Started System Logging Service.
сеп 01 17:34:51 haproxy2 rsyslogd[372726]: [198B blob data]
сеп 01 17:34:51 haproxy2 rsyslogd[372726]: imuxsock: Acquired UNIX socket '/run/systemd/journal/syslog' (fd 3) from systemd.  [>
сеп 01 17:34:51 haproxy2 rsyslogd[372726]: [origin software="rsyslogd" swVersion="8.2102.0" x-pid="372726" x-info="https://www.

Do some testing with some tool like curl / wget / lynx / elinks etc. on each of the configured haproxy listeners and frontends and check whether everything ends up in the correct log files.
That's all folks enjoy ! 🙂
 

How to create multiple haproxy instance separate processes for different configuration listeners with systemd on single Linux server

Tuesday, August 30th, 2022

HAProxy-Multiple-instanes-with-systemd-on-same-host-howto-Load-Balance-Your-Servers

In this aticle will be explained, howto configure multiple haproxy instances with separate haproxy binary wrappers and configs to run on the same Linux server host
by creating and using systemd additional .services.

Usually haproxy as installed and  ran standard on Linux swapns 2 listener processes which are configured to serve any proxy configuration setup inside /etc/haproxy/haproxy.cfg.

Here is example:

[root@haproxy2:~ ]# ps -ef|grep -i haproxy
root      128464       1  0 Aug11 ?        00:01:19 /usr/sbin/haproxy -Ws -f /etc/haproxy/haproxy.cfg -p /run/haproxy.pid -S /run/haproxy-master.sock
haproxy   128466  128464  0 Aug11 ?        00:49:24 /usr/sbin/haproxy -Ws -f /etc/haproxy/haproxy.cfg -p /run/haproxy.pid -S /run/haproxy-master.sock

However what if you need to have a multiple services to be proxied and you need to have multiple configuration files separated under various
/etc/haproxy/ stored files (.e.g /etc/haproxy/haproxy-customer1.cfg /etc/haproxy-customer2.cfg /etc/haproxy-custmXYZ.fg) etc. , what then how this can be done ?

Besides the many down sides of involving systemd into Linux, there is some good sides of it, as on any modern Linux there is a separate service to manage haproxy as of year 2022 on most modern Linuxes Debian / CentOS / Redhat the location where usually systemd service scripts are located is under directory /usr/lib/systemd/system/ the systemd managed service files are with extension .service

[root@haproxy2:/usr/lib/systemd/system ]# ls -al haproxy.service
-rw-r–r– 1 root root 1509 Sep  5  2021 haproxy.service

[root@haproxy2:/usr/lib/systemd/system ]# ls -al cron.service
-rw-r–r– 1 root root 316 Feb 23  2021 cron.service

[root@haproxy2:/usr/lib/systemd/system ]# ls -al networking.service
-rw-r–r– 1 root root 643 Sep 21  2020 networking.service

[root@haproxy2:/usr/lib/systemd/system ]# ls -al systemd-journald.service
-rw-r–r– 1 root root 1812 Jul 13  2021 systemd-journald.service


1. Create new haproxy-custom.service and /etc/haproxy.cfg file copies
 

Adding new services that will be managed by systemd is pretty simple hence, you just need to have the original service file in that case this is haproxy.service and modify it a bit, original haproxy.service file on Red Hat Enterprise Linux release 8.5 (Ootpa) would look like this

Make exact copy of haproxy.service to haproxy-your-custom.service

[root@haproxy2:/usr/lib/systemd/system ]#  cp -vprf haproxy.service haproxy-customname.service
'haproxy.service' -> 'haproxy-customname.service'

[root@haproxy2:/usr/lib/systemd/system]# cp -vrpf /etc/haproxy/haproxy.cfg /etc/haproxy/haproxy_customname_prod.cfg
'/etc/haproxy/haproxy.cfg' -> '/etc/haproxy/haproxy_customname_prod.cfg'


2. Modify the new haproxy-customname.service and haproxy-custoname.cfg

a) Create hardlink copy of /usr/sbin/haproxy binary

It is a good idea to separte the haproxy executable binary for the additional systemd haproxy instance. This can be done either by copying /usr/sbin/haproxy to something like /usr/sbin/haproxy-customname-wrapper or by creating a hard link. As i'm cautious to keep the haproxy-customname-wrapper binary up2date and updated together once the haproxy rpm package / deb package is updated either with yum or apt depending on the Linux distro, hard link  use is always better.
Just for reference hardlink does keep an own copy of the binary data and occupies additional Filesystem inodes, but at the same time the first inode of the binary does point to the original binary, meaning that a package update will make the hardlink be updated up to the latest version of the file and no extra management of the hard linked haproxy-customname-wrapper is necessery.

[root@haproxy2:/usr/sbin ]# ln haproxy haproxy-custname-wrapper

[root@haproxy2:/usr/sbin ]#  ls -al haproxy-custname-wrapper
-rwxr-xr-x 2 root root 2541848 Sep  5  2021 haproxy-custname-wrapper*
root@haproxy2:/usr/sbin# ls -al haproxy
-rwxr-xr-x 2 root root 2541848 Sep  5  2021 haproxy*


b) Modify haproxy-custoname.service systemd instance

The original service file will have content like

[Unit]
Description=HAProxy Load Balancer
After=network-online.target
Wants=network-online.target

[Service]
Environment="CONFIG=/etc/haproxy/haproxy.cfg" "PIDFILE=/run/haproxy.pid"
EnvironmentFile=/etc/sysconfig/haproxy
ExecStartPre=/usr/sbin/haproxy -f $CONFIG -c -q $OPTIONS
ExecStart=/usr/sbin/haproxy -Ws -f $CONFIG -p $PIDFILE $OPTIONS
ExecReload=/usr/sbin/haproxy -f $CONFIG -c -q $OPTIONS

ExecReload=/bin/kill -USR2 $MAINPID
SuccessExitStatus=143
KillMode=mixed
Type=notify

[Install]
WantedBy=multi-user.target


The modified one for the customname.service should have content similar to:
 

[Unit]
Description=HAProxy Load Balancer
After=network-online.target
Wants=network-online.target

[Service]
Environment="CONFIG=/etc/haproxy/haproxy_customname_prod.cfg" "PIDFILE=/run/haproxy_customname_prod.pid"
EnvironmentFile=/etc/sysconfig/haproxy
ExecStartPre=/usr/sbin/haproxy_customname -f $CONFIG -c -q $OPTIONS
ExecStart=/usr/sbin/haproxy_customname -Ws -f $CONFIG -p $PIDFILE $OPTIONS
ExecReload=/usr/sbin/haproxy_customname -f $CONFIG -c -q $OPTIONS

ExecReload=/bin/kill -USR2 $MAINPID
SuccessExitStatus=143
KillMode=mixed
Type=notify

[Install]
WantedBy=multi-user.target

c) modify haproxy_customname_prod.cfg

Do the required config and save the file, below is minimal config sample:

[root@haproxy2:/etc/haproxy ]#  vim /etc/haproxy/haproxy_customname_prod.cfg
 

#———————————————————————
# Global settings
#———————————————————————
global
    log          127.0.0.1 local6 debug
    chroot       /var/lib/haproxy
    pidfile      /run/haproxy.pid
    stats socket /var/lib/haproxy/haproxy.sock mode 0600 level admin
    maxconn      4000
    user         haproxy
    group        haproxy
    daemon
    #debug
    #quiet

#———————————————————————
# common defaults that all the 'listen' and 'backend' sections will
# use if not designated in their block
#———————————————————————
defaults
    mode        tcp
    log         global
#    option      dontlognull
#    option      httpclose
#    option      httplog
#    option      forwardfor
    option      redispatch
    option      log-health-checks
    timeout connect 10000 # default 10 second time out if a backend is not found
    timeout client 300000
    timeout server 300000
    maxconn     60000
    retries     3


#———————————————————————
# round robin balancing between the various backends
#———————————————————————

frontend Frotnend_customname1
        bind 10.10.10.1:15000
        mode tcp
        option tcplog
        #log global
        log-format [%t]\ %ci:%cp\ %bi:%bp\ %b/%s:%sp\ %Tw/%Tc/%Tt\ %B\ %ts\ %ac/%fc/%bc/%sc/%rc\ %sq/%bq

       default_backend Frontend_customname1

backend Frontend_customname1
        balance roundrobin
        timeout client 350000
        timeout server 350000
        timeout connect 35000
        server backend-server1 10.10.10.50:15000 weight 1 check port 15000
        server backend-server2 10.10.10.51:15000 weight 2  check port 15000


3. Reload systemd to make haproxy-customname.service known to systemctl, restart the freshly created service
and check its status


a) Execute daemon-reload to refresh known .service files in systemd

[root@haproxy2:/etc/haproxy ]# systemctl daemon-reload
[root@haproxy2:/etc/haproxy ]#


b) Restart haproxy-customname

[root@haproxy2:/usr/lib/systemd/system ]# systemctl restart haproxy-customname
[root@haproxy2:/usr/lib/systemd/system ]#

c) Check status is active running and process is properly forked

[root@haproxy2:/usr/lib/systemd/system ]# systemctl status haproxy-customname
● haproxy-customname.service – HAProxy Load Balancer
     Loaded: loaded (/lib/systemd/system/haproxy-customname.service; disabled; vendor preset: enabled)
     Active: active (running) since Tue 2022-08-30 13:15:35 EEST; 16s ago
       Docs: man:haproxy(1)
             file:/usr/share/doc/haproxy/configuration.txt.gz
    Process: 346635 ExecStartPre=/usr/sbin/haproxy-customname-wrapper -f $CONFIG -c -q $EXTRAOPTS (code=exited, status=0/SUCCES>
   Main PID: 346637 (haproxy-customn)
      Tasks: 3 (limit: 4654)
     Memory: 14.5M
        CPU: 68ms
     CGroup: /system.slice/haproxy-customname.service
             ├─346637 /usr/sbin/haproxy-customname-wrapper -Ws -f /etc/haproxy/haproxy_customname_prod.cfg -p /run/haproxy_cust>
             └─346639 /usr/sbin/haproxy-customname-wrapper -Ws -f /etc/haproxy/haproxy_customname_prod.cfg -p /run/haproxy_cust>

Aug 30 13:15:35 haproxy2 haproxy-customname-wrapper[346637]:    | timeouts are set to a non-zero value: 'client', 'connect', 's>
Aug 30 13:15:35 haproxy2 haproxy-customname-wrapper[346637]: [NOTICE] 241/131535 (346637) : New worker #1 (346639) forked
Aug 30 13:15:35 haproxy2 haproxy-customname-wrapper[346637]: Proxy webservers_http started.
Aug 30 13:15:35 haproxy2 haproxy-customname-wrapper[346637]: Proxy https-in started.
Aug 30 13:15:35 haproxy2 haproxy-customname-wrapper[346637]: Proxy webservers-https started.
Aug 30 13:15:35 haproxy2 haproxy-customname-wrapper[346637]: Proxy stats started.

The new haproxy-customname.service processes will be visible in process list together with the normal haproxy.service spawned processes:

[root@haproxy2:/usr/lib/systemd/system ]# ps -ef|grep -i hapro|grep -v grep
root      128464       1  0 Aug11 ?        00:01:19 /usr/sbin/haproxy -Ws -f /etc/haproxy/haproxy.cfg -p /run/haproxy.pid -S /run/haproxy-master.sock
haproxy   128466  128464  0 Aug11 ?        00:49:29 /usr/sbin/haproxy -Ws -f /etc/haproxy/haproxy.cfg -p /run/haproxy.pid -S /run/haproxy-master.sock

root      346637       1  0 13:15 ?        00:00:00 /usr/sbin/haproxy-customname-wrapper -Ws -f /etc/haproxy/haproxy_customname_prod.cfg -p /run/haproxy_customname_prod.pid -S /run/haproxy-customname-master.sock
haproxy   346639  346637  0 13:15 ?        00:00:00 /usr/sbin/haproxy-customname-wrapper -Ws -f /etc/haproxy/haproxy_customname_prod.cfg -p /run/haproxy_customname_prod.pid -S /run/haproxy-customname-master.sock


Following the same steps you can create as many separate haproxy instances as you like, but you have to be cautious not to intermix the listener ports for frontends. There is always risk when you copy from the original /etc/haproxy/haproxy.cfg to /etc/haproxy/haproxy-whatever.cfg to forget to change the listen port addresses in new config. 
Also note, that you might have problems, if you exceeed the usual maximum number of ports  65535 by using a high port ranges in the listeneres and due to that your additional systemd instances might refuse to start.

If you need to create a multiple bunch of systemd separte instances and haproxy configurations you can write easily a small script in bash that does this steps automatically.
Hope this article helped someone. If so drop me a thanks email or do your appreatiation for my blog by supporting my patreon.

Cheers ! 🙂

How to update expiring OpenSSL certificates without downtime on haproxy Pacemaker / Corosync PCS Cluster

Tuesday, July 19th, 2022

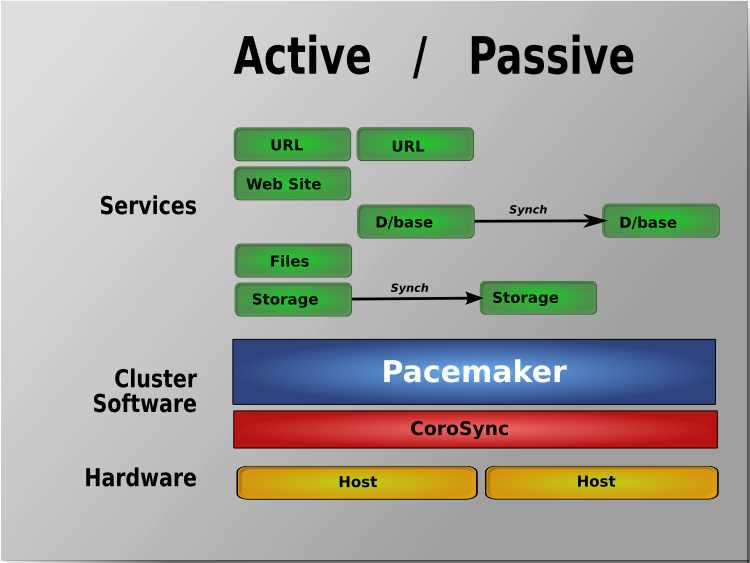
pcm-active-passive-scheme-corosync-pacemaker-openssl-renew-fix-certificate

Lets say you have a running PCS Haproxy cluster with 2 nodes and you have already a configuration in haproxy with a running VIP IP and this proxies
are tunneling traffic to a webserver such as Apache or directly to an Application and you end up in the situation where the configured certificates,
are about to expire soon. As you can guess having the cluster online makes replacing the old expiring SSL certificate with a new one relatively easy
task. But still there are a couple of steps to follow which seems easy but systemizing them and typing them down takes some time and effort.
In short you need to check the current certificates installed on the haproxy inside the Haproxy configuration files,
in my case the haproxy cluster was running 2 haproxy configs haproxyprod.cfg and haproxyqa.cfg and the certificates configured are places inside this
configuration.

Hence to do the certificate update, I had to follow few steps:

A. Find the old certificate key or generate a new one that will be used later together with the CSR (Certificate Request File) to generate the new Secure Socket Layer
certificate pair.
B. Either use the old .CSR (this is usually placed inside the old .CRT certificate file) or generate a new one
C. Copy those .CSR file to the Copy / Paste buffer and place it in the Website field on the step to fill in a CSR for the new certificate on the Domain registrer
such as NameCheap / GoDaddy / BlueHost / Entrust etc.
D. Registrar should then be able to generate files like the the new ServerCertificate.crt, Public Key Root Certificate Authority etc.
E. You should copy and store these files in some database for future perhaps inside some database such as .xdb
for example you can se the X – Certificate and Key management xca (google for xca download).
F. Copy this certificate and place it on the top of the old .crt file that is configured on the haproxies for each domain for which you have configured it on node2
G. standby node1 so the cluster sends the haproxy traffic to node2 (where you should already have the new configured certificate)
H. Prepare the .crt file used by haproxy by including the new ServerCertificate.crt content on top of the file on node1 as well
I. unstandby node1
J. Check in browser by accessing the URL the certificate is the new one based on the new expiry date that should be extended in future
K. Check the status of haproxy
L. If necessery check /var/log/haproxy.log on both clusters to check all works as expected

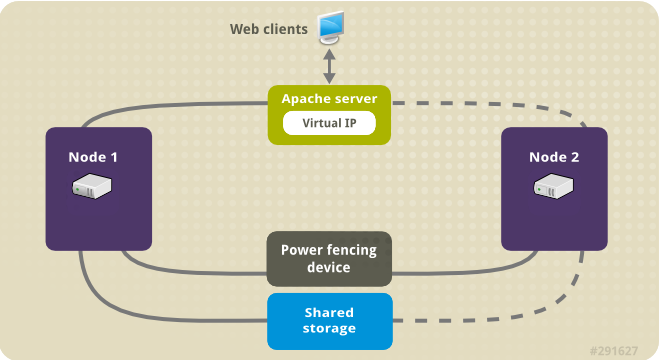
haserver_cluster_sample

Below are the overall commands to use to complete below jobs

Old extracted keys and crt files are located under /home/username/new-certs

1. Check certificate expiry start / end dates


[root@haproxy-serv01 certs]# openssl s_client -connect 10.40.18.88:443 2>/dev/null| openssl x509 -noout -enddate
notAfter=Aug 12 12:00:00 2022 GMT

2. Find Certificate location taken from /etc/haproxy/haproxyprod.cfg / /etc/haproxy/haproxyqa.cfg

# from Prod .cfg
   bind 10.40.18.88:443 ssl crt /etc/haproxy/certs/www.your-domain.com.crt ca-file /etc/haproxy/certs/ccnr-ca-prod.crt 
 

# from QA .cfg

    bind 10.50.18.87:443 ssl crt /etc/haproxy/certs/test.your-domain.com.crt ca-file /etc/haproxy/certs

3. Check  CRT cert expiry


# for haproxy-serv02 qa :443 listeners

[root@haproxy-serv01 certs]# openssl s_client -connect 10.50.18.87:443 2>/dev/null| openssl x509 -noout -enddate 
notAfter=Dec  9 13:24:00 2029 GMT


[root@haproxy-serv01 certs]# openssl x509 -enddate -noout -in /etc/haproxy/certs/www.your-domain.com.crt
notAfter=Aug 12 12:00:00 2022 GMT

[root@haproxy-serv01 certs]# openssl x509 -noout -dates -in /etc/haproxy/certs/www.your-domain.com.crt 
notBefore=May 13 00:00:00 2020 GMT
notAfter=Aug 12 12:00:00 2022 GMT


[root@haproxy-serv01 certs]# openssl x509 -noout -dates -in /etc/haproxy/certs/other-domain.your-domain.com.crt 
notBefore=Dec  6 13:52:00 2019 GMT
notAfter=Dec  9 13:52:00 2022 GMT

4. Check public website cert expiry in a Chrome / Firefox or Opera browser

In a Chrome browser go to updated URLs:

https://www.your-domain/login

https://test.your-domain/login

https://other-domain.your-domain/login

and check the certs

5. Login to one of haproxy nodes haproxy-serv02 or haproxy-serv01

Check what crm_mon (the cluster resource manager) reports of the consistancy of cluster and the belonging members
you should get some output similar to below:

[root@haproxy-serv01 certs]# crm_mon
Stack: corosync
Current DC: haproxy-serv01 (version 1.1.23-1.el7_9.1-9acf116022) – partition with quorum
Last updated: Fri Jul 15 16:39:17 2022
Last change: Thu Jul 14 17:36:17 2022 by root via cibadmin on haproxy-serv01

2 nodes configured
6 resource instances configured

Online: [ haproxy-serv01 haproxy-serv02 ]

Active resources:

 ccnrprodlbvip  (ocf::heartbeat:IPaddr2):       Started haproxy-serv01
 ccnrqalbvip    (ocf::heartbeat:IPaddr2):       Started haproxy-serv01
 Clone Set: haproxyqa-clone [haproxyqa]
     Started: [ haproxy-serv01 haproxy-serv02 ]
 Clone Set: haproxyprod-clone [haproxyprod]
     Started: [ haproxy-serv01 haproxy-serv02 ]


6. Create backup of existing certificates before proceeding to regenerate expiring
On both haproxy-serv01 / haproxy-serv02 run:


# cp -vrpf /etc/haproxy/certs/ /home/username/etc-haproxy-certs_bak_$(date +%d_%y_%m)/


7. Find the .key file etract it from latest version of file CCNR-Certificates-DB.xdb

Extract passes from XCA cert manager (if you're already using XCA if not take the certificate from keypass or wherever you have stored it.

+ For XCA cert manager ccnrlb pass
Find the location of the certificate inside the .xdb place etc.

+++++ www.your-domain.com.key file +++++

—–BEGIN PUBLIC KEY—–

—–END PUBLIC KEY—–


# Extracted from old file /etc/haproxy/certs/www.your-domain.com.crt
 

—–BEGIN RSA PRIVATE KEY—–

—–END RSA PRIVATE KEY—–


+++++

8. Renew Generate CSR out of RSA PRIV KEY and .CRT

[root@haproxy-serv01 certs]# openssl x509 -noout -fingerprint -sha256 -inform pem -in www.your-domain.com.crt
SHA256 Fingerprint=24:F2:04:F0:3D:00:17:84:BE:EC:BB:54:85:52:B7:AC:63:FD:E4:1E:17:6B:43:DF:19:EA:F4:99:L3:18:A6:CD

# for haproxy-serv01 prod :443 listeners

[root@haproxy-serv02 certs]# openssl x509 -x509toreq -in www.your-domain.com.crt -out www.your-domain.com.csr -signkey www.your-domain.com.key


9. Move (Standby) traffic from haproxy-serv01 to ccnrl0b2 to test cert works fine

[root@haproxy-serv01 certs]# pcs cluster standby haproxy-serv01


10. Proceed the same steps on haproxy-serv01 and if ok unstandby

[root@haproxy-serv01 certs]# pcs cluster unstandby haproxy-serv01


11. Check all is fine with openssl client with new certificate


Check Root-Chain certificates:

# openssl verify -verbose -x509_strict -CAfile /etc/haproxy/certs/ccnr-ca-prod.crt -CApath  /etc/haproxy/certs/other-domain.your-domain.com.crt{.pem?)
/etc/haproxy/certs/other-domain.your-domain.com.crt: OK

# openssl verify -verbose -x509_strict -CAfile /etc/haproxy/certs/thawte-ca.crt -CApath  /etc/haproxy/certs/www.your-domain.com.crt
/etc/haproxy/certs/www.your-domain.com.crt: OK

################# For other-domain.your-domain.com.crt ##############
Do the same

12. Check cert expiry on /etc/haproxy/certs/other-domain.your-domain.com.crt

# for haproxy-serv02 qa :15443 listeners
[root@haproxy-serv01 certs]# openssl s_client -connect 10.40.18.88:15443 2>/dev/null| openssl x509 -noout -enddate
notAfter=Dec  9 13:52:00 2022 GMT

[root@haproxy-serv01 certs]#  openssl x509 -enddate -noout -in /etc/haproxy/certs/other-domain.your-domain.com.crt 
notAfter=Dec  9 13:52:00 2022 GMT


Check also for 
+++++ other-domain.your-domain.com..key file +++++
 

—–BEGIN PUBLIC KEY—–

—–END PUBLIC KEY—–


# Extracted from /etc/haproxy/certs/other-domain.your-domain.com.crt
 

—–BEGIN RSA PRIVATE KEY—–

—–END RSA PRIVATE KEY—–


+++++

13. Standby haproxy-serv01 node 1

[root@haproxy-serv01 certs]# pcs cluster standby haproxy-serv01

14. Renew Generate CSR out of RSA PRIV KEY and .CRT for second domain other-domain.your-domain.com

# for haproxy-serv01 prod :443 renew listeners
[root@haproxy-serv02 certs]# openssl x509 -x509toreq -in other-domain.your-domain.com.crt  -out domain-certificate.com.csr -signkey domain-certificate.com.key


And repeat the same steps e.g. fill the CSR inside the domain registrer and get the certificate and move to the proxy, check the fingerprint if necessery
 

[root@haproxy-serv01 certs]# openssl x509 -noout -fingerprint -sha256 -inform pem -in other-domain.your-domain.com.crt
SHA256 Fingerprint=60:B5:F0:14:38:F0:1C:51:7D:FD:4D:C1:72:EA:ED:E7:74:CA:53:A9:00:C6:F1:EB:B9:5A:A6:86:73:0A:32:8D


15. Check private key's SHA256 checksum

# openssl pkey -in terminals-priv.KEY -pubout -outform pem | sha256sum
# openssl x509 -in other-domain.your-domain.com.crt -pubkey -noout -outform pem | sha256sum

# openssl pkey -in  www.your-domain.com.crt-priv-KEY -pubout -outform pem | sha256sum

# openssl x509 -in  www.your-domain.com.crt -pubkey -noout -outform pem | sha256sum


16. Check haproxy config is okay before reload cert


# haproxy -c -V -f /etc/haproxy/haproxyprod.cfg
Configuration file is valid


# haproxy -c -V -f /etc/haproxy/haproxyqa.cfg
Configuration file is valid

Good so next we can the output of status of certificate

17.Check old certificates are reachable via VIP IP address

Considering that the cluster VIP Address is lets say 10.40.18.88 and running one of the both nodes cluster to check it do something like:
 

# curl -vvI https://10.40.18.88:443|grep -Ei 'start date|expire date'


As output you should get the old certificate


18. Reload Haproxies for Prod and QA on node1 and node2

You can reload the haproxy clusters processes gracefully something similar to kill -HUP but without loosing most of the current established connections with below cmds:

Login on node1 (haproxy-serv01) do:

# /usr/sbin/haproxy -f /etc/haproxy/haproxyprod.cfg -D -p /var/run/haproxyprod.pid  -sf $(cat /var/run/haproxyprod.pid)
# /usr/sbin/haproxy -f /etc/haproxy/haproxyqa.cfg -D -p /var/run/haproxyqa.pid  -sf $(cat /var/run/haproxyqa.pid)

repeat the same commands on haproxy-serv02 host

19.Check new certificates online and the the haproxy logs

# curl -vvI https://10.50.18.88:443|grep -Ei 'start date|expire date'

*       start date: Jul 15 08:19:46 2022 GMT
*       expire date: Jul 15 08:19:46 2025 GMT


You should get the new certificates Issueing start date and expiry date.

On both nodes (if necessery) do:

# tail -f /var/log/haproxy.log

Webserver farm behind Load Balancer Proxy or how to preserve incoming internet IP to local net IP Apache webservers by adding additional haproxy header with remoteip

Monday, April 18th, 2022

logo-haproxy-apache-remoteip-configure-and-check-to-have-logged-real-ip-address-inside-apache-forwarded-from-load-balancer

Having a Proxy server for Load Balancing is a common solutions to assure High Availability of Web Application service behind a proxy.
You can have for example 1 Apache HTTPD webservers serving traffic Actively on one Location (i.e. one city or Country) and 3 configured in the F5 LB or haproxy to silently keep up and wait for incoming connections as an (Active Failure) Backup solution

Lets say the Webservers usually are set to have local class C IPs as 192.168.0.XXX or 10.10.10.XXX and living in isolated DMZed well firewalled LAN network and Haproxy is configured to receive traffic via a Internet IP 109.104.212.13 address and send the traffic in mode tcp via a NATTed connection (e.g. due to the network address translation the source IP of the incoming connections from Intenet clients appears as the NATTed IP 192.168.1.50.

The result is that all incoming connections from haproxy -> webservers will be logged in Webservers /var/log/apache2/access.log wrongly as incoming from source IP: 192.168.1.50, meaning all the information on the source Internet Real IP gets lost.

load-balancer-high-availailibility-haproxy-apache
 

How to pass Real (Internet) Source IPs from Haproxy "mode tcp" to Local LAN Webservers  ?
 

Usually the normal way to work around this with Apache Reverse Proxies configured is to use HTTP_X_FORWARDED_FOR variable in haproxy when using HTTP traffic application that is proxied (.e.g haproxy.cfg has mode http configured), you have to add to listen listener_name directive or frontend Frontend_of_proxy

option forwardfor
option http-server-close

However unfortunately, IP Header preservation with X_FORWADED_FOR  HTTP-Header is not possible when haproxy is configured to forward traffic using mode tcp.

Thus when you're forced to use mode tcp to completely pass any traffic incoming to Haproxy from itself to End side, the solution is to
 

  • Use mod_remoteip infamous module that is part of standard Apache installs both on apache2 installed from (.deb) package  or httpd rpm (on redhats / centos).


1. Configure Haproxies to send received connects as send-proxy traffic


The idea is very simple all the received requests from outside clients to Haproxy are to be send via the haproxy to the webserver in a PROXY protocol string, this is done via send-proxy

             send-proxy  – send a PROXY protocol string

Rawly my current /etc/haproxy/haproxy.cfg looks like this:
 

global
        log /dev/log    local0
        log /dev/log    local1 notice
        chroot /var/lib/haproxy
        user haproxy
        group haproxy
        daemon
        maxconn 99999
        nbproc          1
        nbthread 2
        cpu-map         1 0
        cpu-map         2 1


defaults
        log     global
       mode    tcp


        timeout connect 5000
        timeout connect 30s
        timeout server 10s

    timeout queue 5s
    timeout tunnel 2m
    timeout client-fin 1s
    timeout server-fin 1s

                option forwardfor

    retries                 15


frontend http-in
                mode tcp

                option tcplog
        log global

                option logasap
                option forwardfor
                bind 109.104.212.130:80
    fullconn 20000
default_backend http-websrv
backend http-websrv
        balance source
                maxconn 3000

stick match src
    stick-table type ip size 200k expire 30m
        stick on src


        server ha1server-1 192.168.0.205:80 check send-proxy weight 254 backup
        server ha1server-2 192.168.1.15:80 check send-proxy weight 255
        server ha1server-3 192.168.2.30:80 check send-proxy weight 252 backup
        server ha1server-4 192.168.1.198:80 check send-proxy weight 253 backup
                server ha1server-5 192.168.0.1:80 maxconn 3000 check send-proxy weight 251 backup


frontend https-in
                mode tcp

                option tcplog
                log global

                option logasap
                option forwardfor
        maxconn 99999
           bind 109.104.212.130:443
        default_backend https-websrv
                backend https-websrv
        balance source
                maxconn 3000
        stick on src
    stick-table type ip size 200k expire 30m


                server ha1server-1 192.168.0.205:443 maxconn 8000 check send-proxy weight 254 backup
                server ha1server-2 192.168.1.15:443 maxconn 10000 check send-proxy weight 255
        server ha1server-3 192.168.2.30:443 maxconn 8000 check send-proxy weight 252 backup
        server ha1server-4 192.168.1.198:443 maxconn 10000 check send-proxy weight 253 backup
                server ha1server-5 192.168.0.1:443 maxconn 3000 check send-proxy weight 251 backup

listen stats
    mode http
    option httplog
    option http-server-close
    maxconn 10
    stats enable
    stats show-legends
    stats refresh 5s
    stats realm Haproxy\ Statistics
    stats admin if TRUE


After preparing your haproxy.cfg and reloading haproxy in /var/log/haproxy.log you should have the Real Source IPs logged in:
 

root@webserver:~# tail -n 10 /var/log/haproxy.log
Apr 15 22:47:34 pcfr_hware_local_ip haproxy[2914]: 159.223.65.16:58735 [15/Apr/2022:22:47:34.586] https-in https-websrv/ha1server-2 1/0/+0 +0 — 7/7/7/7/0 0/0
Apr 15 22:47:34 pcfr_hware_local_ip haproxy[2914]: 20.113.133.8:56405 [15/Apr/2022:22:47:34.744] https-in https-websrv/ha1server-2 1/0/+0 +0 — 7/7/7/7/0 0/0
Apr 15 22:47:35 pcfr_hware_local_ip haproxy[2914]: 54.36.148.248:15653 [15/Apr/2022:22:47:35.057] https-in https-websrv/ha1server-2 1/0/+0 +0 — 7/7/7/7/0 0/0
Apr 15 22:47:35 pcfr_hware_local_ip haproxy[2914]: 185.191.171.35:26564 [15/Apr/2022:22:47:35.071] https-in https-websrv/ha1server-2 1/0/+0 +0 — 8/8/8/8/0 0/0
Apr 15 22:47:35 pcfr_hware_local_ip haproxy[2914]: 213.183.53.58:42984 [15/Apr/2022:22:47:35.669] https-in https-websrv/ha1server-2 1/0/+0 +0 — 6/6/6/6/0 0/0
Apr 15 22:47:35 pcfr_hware_local_ip haproxy[2914]: 159.223.65.16:54006 [15/Apr/2022:22:47:35.703] https-in https-websrv/ha1server-2 1/0/+0 +0 — 7/7/7/7/0 0/0
Apr 15 22:47:36 pcfr_hware_local_ip haproxy[2914]: 192.241.113.203:30877 [15/Apr/2022:22:47:36.651] https-in https-websrv/ha1server-2 1/0/+0 +0 — 4/4/4/4/0 0/0
Apr 15 22:47:36 pcfr_hware_local_ip haproxy[2914]: 185.191.171.9:6776 [15/Apr/2022:22:47:36.683] https-in https-websrv/ha1server-2 1/0/+0 +0 — 5/5/5/5/0 0/0
Apr 15 22:47:36 pcfr_hware_local_ip haproxy[2914]: 159.223.65.16:64310 [15/Apr/2022:22:47:36.797] https-in https-websrv/ha1server-2 1/0/+0 +0 — 6/6/6/6/0 0/0
Apr 15 22:47:36 pcfr_hware_local_ip haproxy[2914]: 185.191.171.3:23364 [15/Apr/2022:22:47:36.834] https-in https-websrv/ha1server-2 1/1/+1 +0 — 7/7/7/7/0 0/0


2. Enable remoteip proxy protocol on Webservers

Login to each Apache HTTPD and to enable remoteip module run:
 

# a2enmod remoteip


On Debians, the command should produce a right symlink to mods-enabled/ directory
 

# ls -al /etc/apache2/mods-enabled/*remote*
lrwxrwxrwx 1 root root 31 Mar 30  2021 /etc/apache2/mods-enabled/remoteip.load -> ../mods-available/remoteip.load


3. Modify remoteip.conf file and allow IPs of haproxies or F5s


Configure RemoteIPTrustedProxy for every Source IP of haproxy to allow it to send X-Forwarded-For header to Apache,

Here are few examples, from my apache working config on Debian 11.2 (Bullseye):
 

webserver:~# cat remoteip.conf
RemoteIPHeader X-Forwarded-For
RemoteIPTrustedProxy 192.168.0.1
RemoteIPTrustedProxy 192.168.0.205
RemoteIPTrustedProxy 192.168.1.15
RemoteIPTrustedProxy 192.168.0.198
RemoteIPTrustedProxy 192.168.2.33
RemoteIPTrustedProxy 192.168.2.30
RemoteIPTrustedProxy 192.168.0.215
#RemoteIPTrustedProxy 51.89.232.41

On RedHat / Fedora other RPM based Linux distrubutions, you can do the same by including inside httpd.conf or virtualhost configuration something like:
 

<IfModule remoteip_module>
      RemoteIPHeader X-Forwarded-For
      RemoteIPInternalProxy 192.168.0.0/16
      RemoteIPTrustedProxy 192.168.0.215/32
</IfModule>


4. Enable RemoteIP Proxy Protocol in apache2.conf / httpd.conf or Virtualhost custom config
 

Modify both haproxy / haproxies config as well as enable the RemoteIP module on Apache webservers (VirtualHosts if such used) and either in <VirtualHost> block or in main http config include:

RemoteIPProxyProtocol On


5. Change default configured Apache LogFormat

In Domain Vhost or apache2.conf / httpd.conf

Default logging Format will be something like:
 

LogFormat "%h %l %u %t \"%r\" %>s %O \"%{Referer}i\" \"%{User-Agent}i\"" combined


or
 

LogFormat "%v:%p %h %l %u %t \"%r\" %>s %O \"%{Referer}i\" \"%{User-Agent}i\"" combined


Once you find it in /etc/apache2/apache2.conf / httpd.conf or Vhost, you have to comment out this by adding shebang infont of sentence make it look as follows:
 

LogFormat "%v:%p %a %l %u %t \"%r\" %>s %O \"%{Referer}i\" \"%{User-Agent}i\"" vhost_combined
LogFormat "%a %l %u %t \"%r\" %>s %O \"%{Referer}i\" \"%{User-Agent}i\"" combined
LogFormat "%a %l %u %t \"%r\" %>s %O" common
LogFormat "%{Referer}i -> %U" referer
LogFormat "%{User-agent}i" agent


The Changed LogFormat instructs Apache to log the client IP as recorded by mod_remoteip (%a) rather than hostname (%h). For a full explanation of all the options check the official HTTP Server documentation page apache_mod_config on Custom Log Formats.

and reload each Apache server.

on Debian:

# apache2ctl -k reload

On CentOS

# systemctl restart httpd


6. Check proxy protocol is properly enabled on Apaches


remoteip module will enable Apache to expect a proxy connect header passed to it otherwise it will respond with Bad Request, because it will detect a plain HTML request instead of Proxy Protocol CONNECT, here is the usual telnet test to fetch the index.htm page.

root@webserver:~# telnet localhost 80
Trying 127.0.0.1…
Connected to localhost.
Escape character is '^]'.
GET / HTTP/1.1

HTTP/1.1 400 Bad Request
Date: Fri, 15 Apr 2022 19:04:51 GMT
Server: Apache/2.4.51 (Debian)
Content-Length: 312
Connection: close
Content-Type: text/html; charset=iso-8859-1

<!DOCTYPE HTML PUBLIC "-//IETF//DTD HTML 2.0//EN">
<html><head>
<title>400 Bad Request</title>
</head><body>
<h1>Bad Request</h1>
<p>Your browser sent a request that this server could not understand.<br />
</p>
<hr>
<address>Apache/2.4.51 (Debian) Server at grafana.pc-freak.net Port 80</address>
</body></html>
Connection closed by foreign host.


root@webserver:~# telnet localhost 80
Trying 127.0.0.1…
Connected to localhost.
Escape character is '^]'.
HEAD / HTTP/1.1

HTTP/1.1 400 Bad Request
Date: Fri, 15 Apr 2022 19:05:07 GMT
Server: Apache/2.4.51 (Debian)
Connection: close
Content-Type: text/html; charset=iso-8859-1

Connection closed by foreign host.


To test it with telnet you can follow the Proxy CONNECT syntax and simulate you're connecting from a proxy server, like that:
 

root@webserver:~# telnet localhost 80
Trying 127.0.0.1…
Connected to localhost.
Escape character is '^]'.
CONNECT localhost:80 HTTP/1.0

HTTP/1.1 301 Moved Permanently
Date: Fri, 15 Apr 2022 19:13:38 GMT
Server: Apache/2.4.51 (Debian)
Location: https://zabbix.pc-freak.net
Cache-Control: max-age=900
Expires: Fri, 15 Apr 2022 19:28:38 GMT
Content-Length: 310
Connection: close
Content-Type: text/html; charset=iso-8859-1

<!DOCTYPE HTML PUBLIC "-//IETF//DTD HTML 2.0//EN">
<html><head>
<title>301 Moved Permanently</title>
</head><body>
<h1>Moved Permanently</h1>
<p>The document has moved <a href="https://zabbix.pc-freak.net">here</a>.</p>
<hr>
<address>Apache/2.4.51 (Debian) Server at localhost Port 80</address>
</body></html>
Connection closed by foreign host.

You can test with curl simulating the proxy protocol CONNECT with:

root@webserver:~# curl –insecure –haproxy-protocol https://192.168.2.30

<!DOCTYPE HTML PUBLIC "-//W3C//DTD HTML 4.01 Transitional//EN"
"http://w3.org/TR/html4/loose.dtd">
<html>
<head>
<meta name="generator" content="pc-freak.net tidy">
<script src="https://ssl.google-analytics.com/urchin.js" type="text/javascript">
</script>
<script type="text/javascript">
_uacct = "UA-2102595-3";
urchinTracker();
</script>
<script type="text/javascript">
var gaJsHost = (("https:" == document.location.protocol) ? "https://ssl." : "http://");
document.write(unescape("%3Cscript src='" + gaJsHost + "google-analytics.com/ga.js' type='text/javascript'%3E%3C/script%3E"));
</script>
<script type="text/javascript">
try {
var pageTracker = _gat._getTracker("UA-2102595-6");
pageTracker._trackPageview();
} catch(err) {}
</script>


      –haproxy-protocol
              (HTTP) Send a HAProxy PROXY protocol v1 header at the beginning of the connection. This is used by some load balancers and reverse proxies
              to indicate the client's true IP address and port.

              This option is primarily useful when sending test requests to a service that expects this header.

              Added in 7.60.0.


7. Check apache log if remote Real Internet Source IPs are properly logged
 

root@webserver:~# tail -n 10 /var/log/apache2/access.log

213.183.53.58 – – [15/Apr/2022:22:18:59 +0300] "GET /proxy/browse.php?u=https%3A%2F%2Fsteamcommunity.com%2Fmarket%2Fitemordershistogram%3Fcountry HTTP/1.1" 200 12701 "https://www.pc-freak.net" "Mozilla/5.0 (Windows NT 10.0; Win64; x64; rv:98.0) Gecko/20100101 Firefox/98.0"
88.198.48.184 – – [15/Apr/2022:22:18:58 +0300] "GET /blog/iq-world-rank-country-smartest-nations/?cid=1330192 HTTP/1.1" 200 29574 "-" "Mozilla/5.0 (compatible; DataForSeoBot/1.0; +https://dataforseo.com/dataforseo-bot)"
213.183.53.58 – – [15/Apr/2022:22:19:00 +0300] "GET /proxy/browse.php?u=https%3A%2F%2Fsteamcommunity.com%2Fmarket%2Fitemordershistogram%3Fcountry
HTTP/1.1" 200 9080 "https://www.pc-freak.net" "Mozilla/5.0 (Windows NT 10.0; Win64; x64; rv:98.0) Gecko/20100101 Firefox/98.0"
159.223.65.16 – – [15/Apr/2022:22:19:01 +0300] "POST //blog//xmlrpc.php HTTP/1.1" 200 5477 "-" "Mozilla/5.0 (Windows NT 10.0; Win64; x64) AppleWebKit/537.36 (KHTML, like Gecko) Chrome/89.0.4389.114 Safari/537.36"
159.223.65.16 – – [15/Apr/2022:22:19:02 +0300] "POST //blog//xmlrpc.php HTTP/1.1" 200 5477 "-" "Mozilla/5.0 (Windows NT 10.0; Win64; x64) AppleWebKit/537.36 (KHTML, like Gecko) Chrome/89.0.4389.114 Safari/537.36"
213.91.190.233 – – [15/Apr/2022:22:19:02 +0300] "POST /blog/wp-admin/admin-ajax.php HTTP/1.1" 200 1243 "https://www.pc-freak.net/blog/wp-admin/post.php?post=16754&action=edit" "Mozilla/5.0 (Windows NT 6.1; Win64; x64; rv:89.0) Gecko/20100101 Firefox/89.0"
46.10.215.119 – – [15/Apr/2022:22:19:02 +0300] "GET /images/saint-Paul-and-Peter-holy-icon.jpg HTTP/1.1" 200 134501 "https://www.google.com/" "Mozilla/5.0 (Windows NT 10.0; Win64; x64) AppleWebKit/537.36 (KHTML, like Gecko) Chrome/100.0.4896.75 Safari/537.36 Edg/100.0.1185.39"
185.191.171.42 – – [15/Apr/2022:22:19:03 +0300] "GET /index.html.latest/tutorials/tutorials/penguins/vestnik/penguins/faith/vestnik/ HTTP/1.1" 200 11684 "-" "Mozilla/5.0 (compatible; SemrushBot/7~bl; +http://www.semrush.com/bot.html)"

116.179.37.243 – – [15/Apr/2022:22:19:50 +0300] "GET /blog/wp-content/cookieconsent.min.js HTTP/1.1" 200 7625 "https://www.pc-freak.net/blog/how-to-disable-nginx-static-requests-access-log-logging/" "Mozilla/5.0 (compatible; Baiduspider-render/2.0; +http://www.baidu.com/search/spider.html)"
116.179.37.237 – – [15/Apr/2022:22:19:50 +0300] "GET /blog/wp-content/plugins/google-analytics-dashboard-for-wp/assets/js/frontend-gtag.min.js?ver=7.5.0 HTTP/1.1" 200 8898 "https://www.pc-freak.net/blog/how-to-disable-nginx-static-requests-access-log-logging/" "Mozilla/5.0 (compatible; Baiduspider-render/2.0; +http://www.baidu.com/search/spider.html)"


You see from above output remote Source IPs in green are properly logged, so haproxy Cluster is correctly forwarding connections passing on in the Haproxy generated Initial header the Real IP of its remote connect IPs.


Sum it up, What was done?


HTTP_X_FORWARD_FOR is impossible to set, when haproxy is used on mode tcp and all traffic is sent as received from TCP IPv4 / IPv6 Network stack, e.g. modifying any HTTP sent traffic inside the headers is not possible as this might break up the data.

Thus Haproxy was configured to send all its received data by sending initial proxy header with the X_FORWARDED usual Source IP data, then remoteip Apache module was used to make Apache receive and understand haproxy sent Header which contains the original Source IP via the send-proxy functionality and example was given on how to test the remoteip on Webserver is working correctly.

Finally you've seen how to check configured haproxy and webserver are able to send and receive the End Client data with the originator real source IP correctly and those Internet IP is properly logged inside both haproxy and apaches.

Create Linux High Availability Load Balancer Cluster with Keepalived and Haproxy on Linux

Tuesday, March 15th, 2022

keepalived-logo-linux

Configuring a Linux HA (High Availibiltiy) for an Application with Haproxy is already used across many Websites on the Internet and serious corporations that has a crucial infrastructure has long time
adopted and used keepalived to provide High Availability Application level Clustering.
Usually companies choose to use HA Clusters with Haproxy with Pacemaker and Corosync cluster tools.
However one common used alternative solution if you don't have the oportunity to bring up a High availability cluster with Pacemaker / Corosync / pcs (Pacemaker Configuration System) due to fact machines you need to configure the cluster on are not Physical but VMWare Virtual Machines which couldn't not have configured a separate Admin Lans and Heartbeat Lan as we usually do on a Pacemaker Cluster due to the fact the 5 Ethernet LAN Card Interfaces of the VMWare Hypervisor hosts are configured as a BOND (e.g. all the incoming traffic to the VMWare vSphere  HV is received on one Virtual Bond interface).

I assume you have 2 separate vSphere Hypervisor Physical Machines in separate Racks and separate switches hosting the two VMs.
For the article, I'll call the two brand new brought Virtual Machines with some installation automation software such as Terraform or Ansible – vm-server1 and vm-server2 which would have configured some recent version of Linux.

In that scenario to have a High Avaiability for the VMs on Application level and assure at least one of the two is available at a time if one gets broken due toe malfunction of the HV, a Network connectivity issue, or because the VM OS has crashed.
Then one relatively easily solution is to use keepalived and configurea single High Availability Virtual IP (VIP) Address, i.e. 10.10.10.1, which would float among two VMs using keepalived so at a time at least one of the two VMs would be reachable on the Network.

haproxy_keepalived-vip-ip-diagram-linux

Having a VIP IP is quite a common solution in corporate world, as it makes it pretty easy to add F5 Load Balancer in front of the keepalived cluster setup to have a 3 Level of security isolation, which usually consists of:

1. Physical (access to the hardware or Virtualization hosts)
2. System Access (The mechanism to access the system login credetials users / passes, proxies, entry servers leading to DMZ-ed network)
3. Application Level (access to different programs behind L2 and data based on the specific identity of the individual user,
special Secondary UserID,  Factor authentication, biometrics etc.)


1. Install keepalived and haproxy on machines

Depending on the type of Linux OS:

On both machines
 

[root@server1:~]# yum install -y keepalived haproxy

If you have to install keepalived / haproxy on Debian / Ubuntu and other Deb based Linux distros

[root@server1:~]# apt install keepalived haproxy –yes

2. Configure haproxy (haproxy.cfg) on both server1 and server2


Create some /etc/haproxy/haproxy.cfg configuration


[root@server1:~]vim /etc/haproxy/haproxy.cfg

#———————————————————————
# Global settings
#———————————————————————
global
    log          127.0.0.1 local6 debug
    chroot       /var/lib/haproxy
    pidfile      /run/haproxy.pid
    stats socket /var/lib/haproxy/haproxy.sock mode 0600 level admin 
    maxconn      4000
    user         haproxy
    group        haproxy
    daemon
    #debug
    #quiet

#———————————————————————
# common defaults that all the 'listen' and 'backend' sections will
# use if not designated in their block
#———————————————————————
defaults
    mode        tcp
    log         global
#    option      dontlognull
#    option      httpclose
#    option      httplog
#    option      forwardfor
    option      redispatch
    option      log-health-checks
    timeout connect 10000 # default 10 second time out if a backend is not found
    timeout client 300000
    timeout server 300000
    maxconn     60000
    retries     3

#———————————————————————
# round robin balancing between the various backends
#———————————————————————

listen FRONTEND_APPNAME1
        bind 10.10.10.1:15000
        mode tcp
        option tcplog
#        #log global
        log-format [%t]\ %ci:%cp\ %bi:%bp\ %b/%s:%sp\ %Tw/%Tc/%Tt\ %B\ %ts\ %ac/%fc/%bc/%sc/%rc\ %sq/%bq
        balance roundrobin
        timeout client 350000
        timeout server 350000
        timeout connect 35000
        server app-server1 10.10.10.55:30000 weight 1 check port 68888
        server app-server2 10.10.10.55:30000 weight 2 check port 68888

listen FRONTEND_APPNAME2
        bind 10.10.10.1:15000
        mode tcp
        option tcplog
        #log global
        log-format [%t]\ %ci:%cp\ %bi:%bp\ %b/%s:%sp\ %Tw/%Tc/%Tt\ %B\ %ts\ %ac/%fc/%bc/%sc/%rc\ %sq/%bq
        balance roundrobin
        timeout client 350000
        timeout server 350000
        timeout connect 35000
        server app-server1 10.10.10.55:30000 weight 5
        server app-server2 10.10.10.55:30000 weight 5 


You can get a copy of above haproxy.cfg configuration here.
Once configured roll it on.

[root@server1:~]#  systemctl start haproxy
 
[root@server1:~]# ps -ef|grep -i hapro
root      285047       1  0 Mar07 ?        00:00:00 /usr/sbin/haproxy -Ws -f /etc/haproxy/haproxy.cfg -p /run/haproxy.pid
haproxy   285050  285047  0 Mar07 ?        00:00:26 /usr/sbin/haproxy -Ws -f /etc/haproxy/haproxy.cfg -p /run/haproxy.pid

Bring up the haproxy also on server2 machine, by placing same configuration and starting up the proxy.
 

[root@server1:~]vim /etc/haproxy/haproxy.cfg


3. Configure keepalived on both servers

We'll be configuring 2 nodes with keepalived even though if necessery this can be easily extended and you can add more nodes.
First we make a copy of the original or existing server configuration keepalived.conf (just in case we need it later on or if you already had something other configured manually by someone – that could be so on inherited servers by other sysadmin)
 

[root@server1:~]# mv /etc/keepalived/keepalived.conf /etc/keepalived/keepalived.conf.orig
[root@server2:~]# mv /etc/keepalived/keepalived.conf /etc/keepalived/keepalived.conf.orig

a. Configure keepalived to serve as a MASTER Node


[root@server1:~]# vim /etc/keepalived/keepalived.conf

Master Node
global_defs {
  router_id server1-fqdn # The hostname of this host.
  
  enable_script_security
  # Synchro of the state of the connections between the LBs on the eth0 interface
   lvs_sync_daemon eth0
 
notification_email {
        linuxadmin@notify-domain.com     # Email address for notifications 
    }
 notification_email_from keepalived@server1-fqdn        # The from address for the notifications
    smtp_server 127.0.0.1                       # SMTP server address
    smtp_connect_timeout 15
}

vrrp_script haproxy {
  script "killall -0 haproxy"
  interval 2
  weight 2
  user root
}

vrrp_instance LB_VIP_QA {
  virtual_router_id 50
  advert_int 1
  priority 51

  state MASTER
  interface eth0
  smtp_alert          # Enable Notifications Via Email
  
  authentication {
              auth_type PASS
              auth_pass testp141

    }
### Commented because running on VM on VMWare
##    unicast_src_ip 10.44.192.134 # Private IP address of master
##    unicast_peer {
##        10.44.192.135           # Private IP address of the backup haproxy
##   }

#        }
# master node with higher priority preferred node for Virtual IP if both keepalived up
###  priority 51
###  state MASTER
###  interface eth0
  virtual_ipaddress {
     10.10.10.1 dev eth0 # The virtual IP address that will be shared between MASTER and BACKUP
  }
  track_script {
      haproxy
  }
}


 To dowload a copy of the Master keepalived.conf configuration click here

Below are few interesting configuration variables, worthy to mention few words on, most of them are obvious by their names but for more clarity I'll also give a list here with short description of each:


  • vrrp_instance – defines an individual instance of the VRRP protocol running on an interface.
  • state – defines the initial state that the instance should start in (i.e. MASTER / SLAVE )state –
  • interface – defines the interface that VRRP runs on.
  • virtual_router_id – should be unique value per Keepalived Node (otherwise slave master won't function properly)
  • priority – the advertised priority, the higher the priority the more important the respective configured keepalived node is.
  • advert_int – specifies the frequency that advertisements are sent at (1 second, in this case).
  • authentication – specifies the information necessary for servers participating in VRRP to authenticate with each other. In this case, a simple password is defined.
    only the first eight (8) characters will be used as described in  to note is Important thing
    man keepalived.conf – keepalived.conf variables documentation !!! Nota Bene !!! – Password set on each node should match for nodes to be able to authenticate !
  • virtual_ipaddress – defines the IP addresses (there can be multiple) that VRRP is responsible for.
  • notification_email – the notification email to which Alerts will be send in case if keepalived on 1 node is stopped (e.g. the MASTER node switches from host 1 to 2)
  • notification_email_from – email address sender from where email will originte
    ! NB ! In order for notification_email to be working you need to have configured MTA or Mail Relay (set to local MTA) to another SMTP – e.g. have configured something like Postfix, Qmail or Postfix

b. Configure keepalived to serve as a SLAVE Node

[root@server1:~]vim /etc/keepalived/keepalived.conf
 

#Slave keepalived
global_defs {
  router_id server2-fqdn # The hostname of this host!

  enable_script_security
  # Synchro of the state of the connections between the LBs on the eth0 interface
  lvs_sync_daemon eth0
 
notification_email {
        linuxadmin@notify-host.com     # Email address for notifications
    }
 notification_email_from keepalived@server2-fqdn        # The from address for the notifications
    smtp_server 127.0.0.1                       # SMTP server address
    smtp_connect_timeout 15
}

vrrp_script haproxy {
  script "killall -0 haproxy"
  interval 2
  weight 2
  user root
}

vrrp_instance LB_VIP_QA {
  virtual_router_id 50
  advert_int 1
  priority 50

  state BACKUP
  interface eth0
  smtp_alert          # Enable Notifications Via Email

authentication {
              auth_type PASS
              auth_pass testp141
}
### Commented because running on VM on VMWare    
##    unicast_src_ip 10.10.192.135 # Private IP address of master
##    unicast_peer {
##        10.10.192.134         # Private IP address of the backup haproxy
##   }

###  priority 50
###  state BACKUP
###  interface eth0
  virtual_ipaddress {
     10.10.10.1 dev eth0 # The virtual IP address that will be shared betwee MASTER and BACKUP.
  }
  track_script {
    haproxy
  }
}


Download the keepalived.conf slave config here


c. Set required sysctl parameters for haproxy to work as expected
 

[root@server1:~]vim /etc/sysctl.conf
#Haproxy config
# haproxy
net.core.somaxconn=65535
net.ipv4.ip_local_port_range = 1024 65000
net.ipv4.ip_nonlocal_bind = 1
net.ipv4.tcp_tw_reuse = 1
net.ipv4.tcp_max_syn_backlog = 10240
net.ipv4.tcp_max_tw_buckets = 400000
net.ipv4.tcp_max_orphans = 60000
net.ipv4.tcp_synack_retries = 3

4. Test Keepalived keepalived.conf configuration syntax is OK


[root@server1:~]keepalived –config-test
(/etc/keepalived/keepalived.conf: Line 7) Unknown keyword 'lvs_sync_daemon_interface'
(/etc/keepalived/keepalived.conf: Line 21) Unable to set default user for vrrp script haproxy – removing
(/etc/keepalived/keepalived.conf: Line 31) (LB_VIP_QA) Specifying lvs_sync_daemon_interface against a vrrp is deprecated.
(/etc/keepalived/keepalived.conf: Line 31)              Please use global lvs_sync_daemon
(/etc/keepalived/keepalived.conf: Line 35) Truncating auth_pass to 8 characters
(/etc/keepalived/keepalived.conf: Line 50) (LB_VIP_QA) track script haproxy not found, ignoring…

I've experienced this error because first time I've configured keepalived, I did not mention the user with which the vrrp script haproxy should run,
in prior versions of keepalived, leaving the field empty did automatically assumed you have the user with which the vrrp script runs to be set to root
as of RHELs keepalived-2.1.5-6.el8.x86_64, i've been using however this is no longer so and thus in prior configuration as you can see I've
set the user in respective section to root.
The error Unknown keyword 'lvs_sync_daemon_interface'
is also easily fixable by just substituting the lvs_sync_daemon_interface and lvs_sync_daemon and reloading
keepalived etc.

Once keepalived is started and you can see the process on both machines running in process list.

[root@server1:~]ps -ef |grep -i keepalived
root     1190884       1  0 18:50 ?        00:00:00 /usr/sbin/keepalived -D
root     1190885 1190884  0 18:50 ?        00:00:00 /usr/sbin/keepalived -D

Next step is to check the keepalived statuses as well as /var/log/keepalived.log

If everything is configured as expected on both keepalived on first node you should see one is master and one is slave either in the status or the log

[root@server1:~]#systemctl restart keepalived


[root@server1:~]systemctl status keepalived|grep -i state
Mar 14 18:59:02 server1-fqdn Keepalived_vrrp[1192003]: (LB_VIP_QA) Entering MASTER STATE

[root@server1:~]systemctl status keepalived

● keepalived.service – LVS and VRRP High Availability Monitor
   Loaded: loaded (/usr/lib/systemd/system/keepalived.service; enabled; vendor preset: disabled)
   Active: inactive (dead) since Mon 2022-03-14 18:15:51 CET; 32min ago
  Process: 1187587 ExecStart=/usr/sbin/keepalived $KEEPALIVED_OPTIONS (code=exited, status=0/SUCCESS)
 Main PID: 1187589 (code=exited, status=0/SUCCESS)

Mar 14 18:15:04 server1lb-fqdn Keepalived_vrrp[1187590]: Sending gratuitous ARP on eth0 for 10.44.192.142
Mar 14 18:15:50 server1lb-fqdn systemd[1]: Stopping LVS and VRRP High Availability Monitor…
Mar 14 18:15:50 server1lb-fqdn Keepalived[1187589]: Stopping
Mar 14 18:15:50 server1lb-fqdn Keepalived_vrrp[1187590]: (LB_VIP_QA) sent 0 priority
Mar 14 18:15:50 server1lb-fqdn Keepalived_vrrp[1187590]: (LB_VIP_QA) removing VIPs.
Mar 14 18:15:51 server1lb-fqdn Keepalived_vrrp[1187590]: Stopped – used 0.002007 user time, 0.016303 system time
Mar 14 18:15:51 server1lb-fqdn Keepalived[1187589]: CPU usage (self/children) user: 0.000000/0.038715 system: 0.001061/0.166434
Mar 14 18:15:51 server1lb-fqdn Keepalived[1187589]: Stopped Keepalived v2.1.5 (07/13,2020)
Mar 14 18:15:51 server1lb-fqdn systemd[1]: keepalived.service: Succeeded.
Mar 14 18:15:51 server1lb-fqdn systemd[1]: Stopped LVS and VRRP High Availability Monitor

[root@server2:~]systemctl status keepalived|grep -i state
Mar 14 18:59:02 server2-fqdn Keepalived_vrrp[297368]: (LB_VIP_QA) Entering BACKUP STATE

[root@server1:~]# grep -i state /var/log/keepalived.log
Mar 14 18:59:02 server1lb-fqdn Keepalived_vrrp[297368]: (LB_VIP_QA) Entering MASTER STATE
 

a. Fix Keepalived SECURITY VIOLATION – scripts are being executed but script_security not enabled.
 

When configurating keepalived for a first time we have faced the following strange error inside keepalived status inside keepalived.log 
 

Feb 23 14:28:41 server1 Keepalived_vrrp[945478]: SECURITY VIOLATION – scripts are being executed but script_security not enabled.


To fix keepalived SECURITY VIOLATION error:

Add to /etc/keepalived/keepalived.conf on the keepalived node hosts
inside 

global_defs {}

After chunk
 

enable_script_security

include

# Synchro of the state of the connections between the LBs on the eth0 interface
  lvs_sync_daemon_interface eth0


5. Prepare rsyslog configuration and Inlcude additional keepalived options
to force keepalived log into /var/log/keepalived.log

To force keepalived log into /var/log/keepalived.log on RHEL 8 / CentOS and other Redhat Package Manager (RPM) Linux distributions

[root@server1:~]# vim /etc/rsyslog.d/48_keepalived.conf

#2022/02/02: HAProxy logs to local6, save the messages
local7.*                                                /var/log/keepalived.log
if ($programname == 'Keepalived') then -/var/log/keepalived.log
if ($programname == 'Keepalived_vrrp') then -/var/log/keepalived.log
& stop

[root@server:~]# touch /var/log/keepalived.log

Reload rsyslog to load new config
 

[root@server:~]# systemctl restart rsyslog
[root@server:~]# systemctl status rsyslog


rsyslog.service – System Logging Service
   Loaded: loaded (/usr/lib/systemd/system/rsyslog.service; enabled; vendor preset: enabled)
  Drop-In: /etc/systemd/system/rsyslog.service.d
           └─rsyslog-service.conf
   Active: active (running) since Mon 2022-03-07 13:34:38 CET; 1 weeks 0 days ago
     Docs: man:rsyslogd(8)

           https://www.rsyslog.com/doc/
 Main PID: 269574 (rsyslogd)
    Tasks: 6 (limit: 100914)
   Memory: 5.1M
   CGroup: /system.slice/rsyslog.service
           └─269574 /usr/sbin/rsyslogd -n

Mar 15 08:15:16 server1lb-fqdn rsyslogd[269574]: — MARK —
Mar 15 08:35:16 server1lb-fqdn rsyslogd[269574]: — MARK —
Mar 15 08:55:16 server1lb-fqdn rsyslogd[269574]: — MARK —


If once keepalived is loaded but you still have no log written inside /var/log/keepalived.log

[root@server1:~]# vim /etc/sysconfig/keepalived
 KEEPALIVED_OPTIONS="-D -S 7"

[root@server2:~]# vim /etc/sysconfig/keepalived
 KEEPALIVED_OPTIONS="-D -S 7"

[root@server1:~]# systemctl restart keepalived.service
[root@server1:~]#  systemctl status keepalived

● keepalived.service – LVS and VRRP High Availability Monitor
   Loaded: loaded (/usr/lib/systemd/system/keepalived.service; enabled; vendor preset: disabled)
   Active: active (running) since Thu 2022-02-24 12:12:20 CET; 2 weeks 4 days ago
 Main PID: 1030501 (keepalived)
    Tasks: 2 (limit: 100914)
   Memory: 1.8M
   CGroup: /system.slice/keepalived.service
           ├─1030501 /usr/sbin/keepalived -D
           └─1030502 /usr/sbin/keepalived -D

Warning: Journal has been rotated since unit was started. Log output is incomplete or unavailable.

[root@server2:~]# systemctl restart keepalived.service
[root@server2:~]# systemctl status keepalived

6. Monitoring VRRP traffic of the two keepaliveds with tcpdump
 

Once both keepalived are up and running a good thing is to check the VRRP protocol traffic keeps fluently on both machines.
Keepalived VRRP keeps communicating over the TCP / IP Port 112 thus you can simply snoop TCP tracffic on its protocol.
 

[root@server1:~]# tcpdump proto 112

tcpdump: verbose output suppressed, use -v or -vv for full protocol decode
listening on eth0, link-type EN10MB (Ethernet), capture size 262144 bytes
11:08:07.356187 IP server1lb-fqdn > vrrp.mcast.net: VRRPv2, Advertisement, vrid 50, prio 53, authtype simple, intvl 1s, length 20
11:08:08.356297 IP server1lb-fqdn > vrrp.mcast.net: VRRPv2, Advertisement, vrid 50, prio 53, authtype simple, intvl 1s, length 20
11:08:09.356408 IP server1lb-fqdn > vrrp.mcast.net: VRRPv2, Advertisement, vrid 50, prio 53, authtype simple, intvl 1s, length 20
11:08:10.356511 IP server1lb-fqdn > vrrp.mcast.net: VRRPv2, Advertisement, vrid 50, prio 53, authtype simple, intvl 1s, length 20
11:08:11.356655 IP server1lb-fqdn > vrrp.mcast.net: VRRPv2, Advertisement, vrid 50, prio 53, authtype simple, intvl 1s, length 20

[root@server2:~]# tcpdump proto 112

tcpdump: verbose output suppressed, use -v or -vv for full protocol decode
​listening on eth0, link-type EN10MB (Ethernet), capture size 262144 bytes
11:08:07.356187 IP server1lb-fqdn > vrrp.mcast.net: VRRPv2, Advertisement, vrid 50, prio 53, authtype simple, intvl 1s, length 20
11:08:08.356297 IP server1lb-fqdn > vrrp.mcast.net: VRRPv2, Advertisement, vrid 50, prio 53, authtype simple, intvl 1s, length 20
11:08:09.356408 IP server1lb-fqdn > vrrp.mcast.net: VRRPv2, Advertisement, vrid 50, prio 53, authtype simple, intvl 1s, length 20
11:08:10.356511 IP server1lb-fqdn > vrrp.mcast.net: VRRPv2, Advertisement, vrid 50, prio 53, authtype simple, intvl 1s, length 20
11:08:11.356655 IP server1lb-fqdn > vrrp.mcast.net: VRRPv2, Advertisement, vrid 50, prio 53, authtype simple, intvl 1s, length 20

As you can see the VRRP traffic on the network is originating only from server1lb-fqdn, this is so because host server1lb-fqdn is the keepalived configured master node.

It is possible to spoof the password configured to authenticate between two nodes, thus if you're bringing up keepalived service cluster make sure your security is tight at best the machines should be in a special local LAN DMZ, do not configure DMZ on the internet !!! 🙂 Or if you eventually decide to configure keepalived in between remote hosts, make sure you somehow use encrypted VPN or SSH tunnels to tunnel the VRRP traffic.

[root@server1:~]tcpdump proto 112 -vv
tcpdump: listening on eth0, link-type EN10MB (Ethernet), capture size 262144 bytes
11:36:25.530772 IP (tos 0xc0, ttl 255, id 59838, offset 0, flags [none], proto VRRP (112), length 40)
    server1lb-fqdn > vrrp.mcast.net: vrrp server1lb-fqdn > vrrp.mcast.net: VRRPv2, Advertisement, vrid 50, prio 53, authtype simple, intvl 1s, length 20, addrs: VIPIP_QA auth "testp431"
11:36:26.530874 IP (tos 0xc0, ttl 255, id 59839, offset 0, flags [none], proto VRRP (112), length 40)
    server1lb-fqdn > vrrp.mcast.net: vrrp server1lb-fqdn > vrrp.mcast.net: VRRPv2, Advertisement, vrid 50, prio 53, authtype simple, intvl 1s, length 20, addrs: VIPIP_QA auth "testp431"

Lets also check what floating IP is configured on the machines:

[root@server1:~]# ip -brief address show
lo               UNKNOWN        127.0.0.1/8 
eth0             UP             10.10.10.5/26 10.10.10.1/32 

The 10.10.10.5 IP is the main IP set on LAN interface eth0, 10.10.10.1 is the floating IP which as you can see is currently set by keepalived to listen on first node.

[root@server2:~]# ip -brief address show |grep -i 10.10.10.1

An empty output is returned as floating IP is currently configured on server1

To double assure ourselves the IP is assigned on correct machine, lets ping it and check the IP assigned MAC  currently belongs to which machine.
 

[root@server2:~]# ping 10.10.10.1
PING 10.10.10.1 (10.10.10.1) 56(84) bytes of data.
64 bytes from 10.10.10.1: icmp_seq=1 ttl=64 time=0.526 ms
^C
— 10.10.10.1 ping statistics —
1 packets transmitted, 1 received, 0% packet loss, time 0ms
rtt min/avg/max/mdev = 0.526/0.526/0.526/0.000 ms

[root@server2:~]# arp -an |grep -i 10.44.192.142
? (10.10.10.1) at 00:48:54:91:83:7d [ether] on eth0
[root@server2:~]# ip a s|grep -i 00:48:54:91:83:7d
[root@server2:~]# 

As you can see from below output MAC is not found in configured IPs on server2.
 

[root@server1-fqdn:~]# /sbin/ip a s|grep -i 00:48:54:91:83:7d -B1 -A1
 eth0: <BROADCAST,MULTICAST,UP,LOWER_UP> mtu 1500 qdisc mq state UP group default qlen 1000
    link/ether 00:48:54:91:83:7d brd ff:ff:ff:ff:ff:ff
inet 10.10.10.1/26 brd 10.10.1.191 scope global noprefixroute eth0

Pretty much expected MAC is on keepalived node server1.


7. Testing keepalived on server1 and server2 maachines VIP floating IP really works
 

To test the overall configuration just created, you should stop keeaplived on the Master node and in meantime keep an eye on Slave node (server2), whether it can figure out the Master node is gone and switch its
state BACKUP to save MASTER. By changing the secondary (Slave) keepalived to master the floating IP: 10.10.10.1 will be brought up by the scripts on server2.

Lets assume that something went wrong with server1 VM host, for example the machine crashed due to service overload, DDoS or simply a kernel bug or whatever reason.
To simulate that we simply have to stop keepalived, then the broadcasted information on VRRP TCP/IP proto port 112 will be no longer available and keepalived on node server2, once
unable to communicate to server1 should chnage itself to state MASTER.

[root@server1:~]# systemctl stop keepalived
[root@server1:~]# systemctl status keepalived

● keepalived.service – LVS and VRRP High Availability Monitor
   Loaded: loaded (/usr/lib/systemd/system/keepalived.service; enabled; vendor preset: disabled)
   Active: inactive (dead) since Tue 2022-03-15 12:11:33 CET; 3s ago
  Process: 1192001 ExecStart=/usr/sbin/keepalived $KEEPALIVED_OPTIONS (code=exited, status=0/SUCCESS)
 Main PID: 1192002 (code=exited, status=0/SUCCESS)

Mar 14 18:59:07 server1lb-fqdn Keepalived_vrrp[1192003]: Sending gratuitous ARP on eth0 for 10.10.10.1
Mar 15 12:11:32 server1lb-fqdn systemd[1]: Stopping LVS and VRRP High Availability Monitor…
Mar 15 12:11:32 server1lb-fqdn Keepalived[1192002]: Stopping
Mar 15 12:11:32 server1lb-fqdn Keepalived_vrrp[1192003]: (LB_VIP_QA) sent 0 priority
Mar 15 12:11:32 server1lb-fqdn Keepalived_vrrp[1192003]: (LB_VIP_QA) removing VIPs.
Mar 15 12:11:33 server1lb-fqdn Keepalived_vrrp[1192003]: Stopped – used 2.145252 user time, 15.513454 system time
Mar 15 12:11:33 server1lb-fqdn Keepalived[1192002]: CPU usage (self/children) user: 0.000000/44.555362 system: 0.001151/170.118126
Mar 15 12:11:33 server1lb-fqdn Keepalived[1192002]: Stopped Keepalived v2.1.5 (07/13,2020)
Mar 15 12:11:33 server1lb-fqdn systemd[1]: keepalived.service: Succeeded.
Mar 15 12:11:33 server1lb-fqdn systemd[1]: Stopped LVS and VRRP High Availability Monitor.


On keepalived off, you will get also a notification Email on the Receipt Email configured from keepalived.conf from the working keepalived node with a simple message like:

=> VRRP Instance is no longer owning VRRP VIPs <=

Once keepalived is back up you will get another notification like:

=> VRRP Instance is now owning VRRP VIPs <=

[root@server2:~]# systemctl status keepalived
● keepalived.service – LVS and VRRP High Availability Monitor
   Loaded: loaded (/usr/lib/systemd/system/keepalived.service; enabled; vendor preset: disabled)
   Active: active (running) since Mon 2022-03-14 18:13:52 CET; 17h ago
  Process: 297366 ExecStart=/usr/sbin/keepalived $KEEPALIVED_OPTIONS (code=exited, status=0/SUCCESS)
 Main PID: 297367 (keepalived)
    Tasks: 2 (limit: 100914)
   Memory: 2.1M
   CGroup: /system.slice/keepalived.service
           ├─297367 /usr/sbin/keepalived -D -S 7
           └─297368 /usr/sbin/keepalived -D -S 7

Mar 15 12:11:33 server2lb-fqdn Keepalived_vrrp[297368]: Sending gratuitous ARP on eth0 for 10.10.10.1
Mar 15 12:11:33 server2lb-fqdn Keepalived_vrrp[297368]: Remote SMTP server [127.0.0.1]:25 connected.
Mar 15 12:11:33 server2lb-fqdn Keepalived_vrrp[297368]: SMTP alert successfully sent.
Mar 15 12:11:38 server2lb-fqdn Keepalived_vrrp[297368]: (LB_VIP_QA) Sending/queueing gratuitous ARPs on eth0 for 10.10.10.1
Mar 15 12:11:38 server2lb-fqdn Keepalived_vrrp[297368]: Sending gratuitous ARP on eth0 for 10.10.10.1

[root@server2:~]#  ip addr show|grep -i 10.10.10.1
    inet 10.10.10.1/32 scope global eth0
    

As you see the VIP is now set on server2, just like expected – that's OK, everything works as expected. If the IP did not move double check the keepalived.conf on both nodes for errors or misconfigurations.

To recover the initial order of things so server1 is MASTER and server2 SLAVE host, we just have to switch on the keepalived on server1 machine.

[root@server1:~]# systemctl start keepalived

The automatic change of server1 to MASTER node and respective move of the VIP IP is done because of the higher priority (of importance we previously configured on server1 in keepalived.conf).
 

What we learned?
 

So what we learned in  this article?
We have seen how to easily install and configure a High Availability Load balancer with Keepalived with single floating VIP IP address with 1 MASTER and 1 SLAVE host and a Haproxy example config with few frontends / App backends. We have seen how the config can be tested for potential errors and how we can monitor whether the VRRP2 network traffic flows between nodes and how to potentially debug it further if necessery.
Further on rawly explained some of the keepalived configurations but as keepalived can do pretty much more,for anyone seriously willing to deal with keepalived on a daily basis or just fine tune some already existing ones, you better read closely its manual page "man keepalived.conf" as well as the official Redhat Linux documentation page on setting up a Linux cluster with Keepalived (Be prepare for a small nightmare as the documentation of it seems to be a bit chaotic, and even I would say partly missing or opening questions on what does the developers did meant – not strange considering the havoc that is pretty much as everywhere these days.)

Finally once keepalived hosts are prepared, it was shown how to test the keepalived application cluster and Floating IP does move between nodes in case if one of the 2 keepalived nodes is inaccessible.

The same logic can be repeated multiple times and if necessery you can set multiple VIPs to expand the HA reachable IPs solution.

high-availability-with-two-vips-example-diagram

The presented idea is with haproxy forward Proxy server to proxy requests towards Application backend (servince machines), however if you need to set another set of server on the flow to  process HTML / XHTML / PHP / Perl / Python  programming code, with some common Webserver setup ( Nginx / Apache / Tomcat / JBOSS) and enable SSL Secure certificate with lets say Letsencrypt, this can be relatively easily done. If you want to implement letsencrypt and a webserver check this redundant SSL Load Balancing with haproxy & keepalived article.

That's all folks, hope you enjoyed.
If you need to configure keepalived Cluster or a consultancy write your query here 🙂

Fix weird double logging in haproxy.log file due to haproxy.cfg misconfiguration

Tuesday, March 8th, 2022

haproxy-logging-front-network-back-network-diagram

While we were building a new machine that will serve as a Haproxy server proxy frontend to tunnel some traffic to a number of backends, 
came across weird oddity. The call requests sent to the haproxy and redirected to backend servers, were being written in the log twice.

Since we have two backend Application servers hat are serving the request, my first guess was this is caused by the fact haproxy
tries to connect to both nodes on each sent request, or that the double logging is caused by the rsyslogd doing something strange on each
received query. The rsyslog configuration configured to send via local6 facility to rsyslog is like that:

$ModLoad imudp
$UDPServerAddress 127.0.0.1
$UDPServerRun 514
#2022/02/02: HAProxy logs to local6, save the messages
local6.*                                                /var/log/haproxy.log


The haproxy basic global and defaults and frontend section config is like that:
 

global
    log          127.0.0.1 local6 debug
    chroot       /var/lib/haproxy
    pidfile      /run/haproxy.pid
    stats socket /var/lib/haproxy/haproxy.sock mode 0600 level admin
    maxconn      4000
    user         haproxy
    group        haproxy
    daemon


defaults
    mode        tcp
    log         global
#    option      dontlognull
#    option      httpclose
#    option      httplog
#    option      forwardfor
    option      redispatch
    option      log-health-checks
    timeout connect 10000 # default 10 second time out if a backend is not found
    timeout client 300000
    timeout server 300000
    maxconn     60000
    retries     3
 

listen FRONTEND1
        bind 10.71.80.5:63750
        mode tcp
        option tcplog
        log global
        log-format [%t]\ %ci:%cp\ %bi:%bp\ %b/%s:%sp\ %Tw/%Tc/%Tt\ %B\ %ts\ %ac/%fc/%bc/%sc/%rc\ %sq/%bq
        balance roundrobin
        timeout client 350000
        timeout server 350000
        timeout connect 35000
        server backend-host1 10.80.50.1:13750 weight 1 check port 15000
        server backend-host2 10.80.50.2:13750 weight 2 check port 15000

After quick research online on why this odd double logging of request ends in /var/log/haproxy.log it turns out this is caused by the 

log global  defined double under the defaults section as well as in the frontend itself, hence to resolve simply had to comment out the log global in Frontend, so it looks like so:

listen FRONTEND1
        bind 10.71.80.5:63750
        mode tcp
        option tcplog
  #      log global
        log-format [%t]\ %ci:%cp\ %bi:%bp\ %b/%s:%sp\ %Tw/%Tc/%Tt\ %B\ %ts\ %ac/%fc/%bc/%sc/%rc\ %sq/%bq
        balance roundrobin
        timeout client 350000
        timeout server 350000
        timeout connect 35000
        server backend-host1 10.80.50.1:13750 weight 1 check port 15000
        server backend-host2 10.80.50.2:13750 weight 2 check port 15000


Next just reloaded haproxy and one request started leaving only one trail inside haproxy.log as expected 🙂
 

How to configure haproxy logging to separate file on Redhat Enterprise Linux 8.5 Ootpa

Thursday, February 3rd, 2022

haproxy-rsyslog-architecture-logging-picture

Configuring proper logging for haproxy is always a pain in the ass in Linux, because of rsyslogd various config syntax among versions, because of bugs in OS etc. 
Today we have been given 2 Redhat 8.5 Linux servers where we had a task to start configuring haproxies, to have an idea on what is going on of course we had to enable proper haproxy logging in separate log file under separate local, for the test one can use haproxy's 

log /dev/log local6

config, this is a general way to configure logging which I've described earlier in the article How to enable haproxy logging to a separate log /var/log/haproxy.log / prevent duplicate messages to appear in /var/log/messages
However this time I wanted to not use /dev/log as this device is also used by systemd / journald and theoretically could be used by other services and there might be multiple services logging to the same places possibly leading to some issue, thus I wanted to send and process the haproxy messages directly from rsyslog on RHEL 8.5.

Create a custom file that is loaded with the rest of configuration from /etc/rsyslog.conf with a line like:
 

# Include all config files in /etc/rsyslog.d/
include(file="/etc/rsyslog.d/*.conf" mode="optional")


Create 49_haproxy.conf with below content

[root@haproxy: ~]# vim /etc/rsyslog.d/49_haproxy.conf

$ModLoad imudp
$UDPServerAddress 127.0.0.1
$UDPServerRun 514
#2022/02/02: HAProxy logs to local6, save the messages
local6.*                                                /var/log/haproxy.log
if ($programname == 'haproxy') then -/var/log/haproxy.log
& stop

touch /var/log/haproxy.log
chown haproxy:haproxy /var/log/haproxy.log

In /etc/haproxy/haproxy.cfg under global section to print in verbose mode messages (i.e. check, the haproxy is receiving properly sent traffic) do configure something like:


global
  log          127.0.0.1 local6 debug


Eventually you might want to remove the debug word out of the config, if you don't want to log too much verbosily once everything is properly tested and configured

[root@haproxy: ~]# curl -v -c -k 10.10.192.135:16010
* Rebuilt URL to: 10.10.192.135:15010/
*   Trying 10.10.192.135…
* TCP_NODELAY set
* Connected to 10.10.192.135 (10.10.192.135) port 15010 (#0)
> GET / HTTP/1.1
> Host: 10.10.192.135:15010
> User-Agent: curl/7.61.1
> Accept: */*

* Empty reply from server
* Connection #0 to host 10.10.192.135 left intact
curl: (52) Empty reply from server


In /var/log/haproxy.log you should get some messages like:
 

Feb  3 14:16:44 localhost.localdomain haproxy[25029]: proxy IN_Traffic_Bak has no server available!
Feb  3 14:16:44 localhost.localdomain haproxy[25029]: proxy IN_Traffic_Bak has no server available!
Feb  3 15:59:50 localhost.localdomain haproxy[25029]: [03/Feb/2022:15:59:50.162] 10.44.192.135:1348 -:- IN_Traffic/<NOSRV>:- -1/-1/0 0 SC 1/1/0/0/0 0/0