Installing Zabbix is usually a trivial stuff, you either use the embedded distribution built packages if such are available this is for example defetch the right zabbix release repository that configures the Zabbix official repo in the system, configure the Zabbix server or Proxy if such is used inside /etc/zabbix/zabbix_agentd.conf and start the client, i.e. I expected that it will be a simple and straight forward also on the freshly installed CentOS 9 Linux cause placing a zabbix-agent monitroing is a trivial stuff however installing came to error:
Key import failed (code 2). Failing package is: zabbix-agent-6.0.3-1.el8.x86_64
This is what I've done
1. Download and install zabbix-release-6.0-1.el8.noarch.rpm directly from zabbix
I've followed the official documentation from zabbix.com and ran:
[root@centos9 /root ]# rpm -Uvh https://repo.zabbix.com/zabbix/6.0/rhel/8/x86_64/zabbix-release-6.0-1.el8.noarch.rpm
…
2. Install the zabbix-agent RPM package from the repositry
[root@centos9 rpm-gpg]# yum install zabbix-agent -y
Last metadata expiration check: 0:02:46 ago on Tue 12 Apr 2022 08:49:34 AM EDT.
Dependencies resolved.
=============================================
Package Architecture Version Repository Size
=============================================
Installing:
zabbix-agent x86_64 6.0.3-1.el8 zabbix 526 k
Installing dependencies:
compat-openssl11 x86_64 1:1.1.1k-3.el9 appstream 1.5 M
openldap-compat x86_64 2.4.59-4.el9 baseos 14 k
Transaction Summary
==============================================
Install 3 PackagesTotal size: 2.0 M
Installed size: 6.1 M
Downloading Packages:
[SKIPPED] openldap-compat-2.4.59-4.el9.x86_64.rpm: Already downloaded
[SKIPPED] compat-openssl11-1.1.1k-3.el9.x86_64.rpm: Already downloaded
[SKIPPED] zabbix-agent-6.0.3-1.el8.x86_64.rpm: Already downloaded
Zabbix Official Repository – x86_64 1.6 MB/s | 1.7 kB 00:00
Importing GPG key 0xA14FE591:
Userid : "Zabbix LLC <packager@zabbix.com>"
Fingerprint: A184 8F53 52D0 22B9 471D 83D0 082A B56B A14F E591
From : /etc/pki/rpm-gpg/RPM-GPG-KEY-ZABBIX-A14FE591
Key import failed (code 2). Failing package is: zabbix-agent-6.0.3-1.el8.x86_64
GPG Keys are configured as: file:///etc/pki/rpm-gpg/RPM-GPG-KEY-ZABBIX-A14FE591
The downloaded packages were saved in cache until the next successful transaction.
You can remove cached packages by e
xecuting 'yum clean packages'.
Error: GPG check FAILED
3. Work around to skip GPG to install zabbix-agent 6 on CentOS 9
With Linux everything becomes more and more of a hack …
The logical thing to was to first, check and it assure that the missing RPM GPG key is at place
[root@centos9 rpm-gpg]# ls -al /etc/pki/rpm-gpg/RPM-GPG-KEY-ZABBIX-A14FE591
-rw-r–r– 1 root root 1719 Feb 11 16:29 /etc/pki/rpm-gpg/RPM-GPG-KEY-ZABBIX-A14FE591
Strangely the key was in place.
Hence to have the key loaded I've tried to import the gpg key manually with gpg command:
[root@centos9 rpm-gpg]# gpg –import /etc/pki/rpm-gpg/RPM-GPG-KEY-ZABBIX-A14FE591
And attempted install again zabbix-agent once again:
[root@centos9 rpm-gpg]# yum install zabbix-agent -y
Last metadata expiration check: 0:02:46 ago on Tue 12 Apr 2022 08:49:34 AM EDT.
Dependencies resolved.
==============================================
Package Architecture Version Repository Size
==============================================
Installing:
zabbix-agent x86_64 6.0.3-1.el8 zabbix 526 k
Installing dependencies:
compat-openssl11 x86_64 1:1.1.1k-3.el9 appstream 1.5 M
openldap-compat x86_64 2.4.59-4.el9 baseos 14 k
Transaction Summary
==============================================
Install 3 Packages
Total size: 2.0 M
Installed size: 6.1 M
Downloading Packages:
[SKIPPED] openldap-compat-2.4.59-4.el9.x86_64.rpm: Already downloaded
[SKIPPED] compat-openssl11-1.1.1k-3.el9.x86_64.rpm: Already downloaded
[SKIPPED] zabbix-agent-6.0.3-1.el8.x86_64.rpm: Already downloaded
Zabbix Official Repository – x86_64 1.6 MB/s | 1.7 kB 00:00
Importing GPG key 0xA14FE591:
Userid : "Zabbix LLC <packager@zabbix.com>"
Fingerprint: A184 8F53 52D0 22B9 471D 83D0 082A B56B A14F E591
From : /etc/pki/rpm-gpg/RPM-GPG-KEY-ZABBIX-A14FE591
Key import failed (code 2). Failing package is: zabbix-agent-6.0.3-1.el8.x86_64
GPG Keys are configured as: file:///etc/pki/rpm-gpg/RPM-GPG-KEY-ZABBIX-A14FE591
The downloaded packages were saved in cache until the next successful transaction.
You can remove cached packages by executing 'yum clean packages'.
Error: GPG check FAILED
Unfortunately that was not a go, so totally pissed off I've disabled the gpgcheck for packages completely as a very raw bad and unrecommended work-around to eventually install the zabbix-agentd like that.
Usually the RPM gpg key failures check on RPM packages could be could be workaround with in dnf, so I've tried that one without success.
[root@centos9 rpm-gpg]# dnf update –nogpgcheck
Total 181 kB/s | 526 kB 00:02
Zabbix Official Repository – x86_64 1.6 MB/s | 1.7 kB 00:00
Importing GPG key 0xA14FE591:
Userid : "Zabbix LLC <packager@zabbix.com>"
Fingerprint: A184 8F53 52D0 22B9 471D 83D0 082A B56B A14F E591
From : /etc/pki/rpm-gpg/RPM-GPG-KEY-ZABBIX-A14FE591
Is this ok [y/N]: y
Key import failed (code 2). Failing package is: zabbix-agent-6.0.3-1.el8.x86_64
GPG Keys are configured as: file:///etc/pki/rpm-gpg/RPM-GPG-KEY-ZABBIX-A14FE591
The downloaded packages were saved in cache until the next successful transaction.
You can remove cached packages by executing 'dnf clean packages'.
Error: GPG check FAILED
Further tried to use the –nogpgpcheck
which according to its man page:
–nogpgpcheck
Skip checking GPG signatures on packages (if RPM policy allows).
In yum the nogpgcheck option according to its man yum does exactly the same thing
[root@centos9 rpm-gpg]# yum install zabbix-agent –nogpgcheck -y
Dependencies resolved.
===============================================
Package Architecture Version Repository Size
===============================================
Installing:
zabbix-agent x86_64 6.0.3-1.el8 zabbix 526 k
Transaction Summary
===============================================
Total size: 526 k
Installed size: 2.3 M
Is this ok [y/N]: y
Downloading Packages:
…
Running transaction check
Transaction check succeeded.
Running transaction test
Transaction test succeeded.
Running transaction
Preparing : 1/1
Running scriptlet: zabbix-agent-6.0.3-1.el8.x86_64 1/2
Reinstalling : zabbix-agent-6.0.3-1.el8.x86_64 1/2
Running scriptlet: zabbix-agent-6.0.3-1.el8.x86_64 1/2
Running scriptlet: zabbix-agent-6.0.3-1.el8.x86_64 2/2
Cleanup : zabbix-agent-6.0.3-1.el8.x86_64 2/2
Running scriptlet: zabbix-agent-6.0.3-1.el8.x86_64 2/2
Verifying : zabbix-agent-6.0.3-1.el8.x86_64 1/2
Verifying : zabbix-agent-6.0.3-1.el8.x86_64 2/2
Installed:
zabbix-agent-6.0.3-1.el8.x86_64
Complete!
[root@centos9 ~]#
Voila! zabbix-agentd on CentOS 9 Install succeeded!
Yes I know disabling a GPG check is not really secure and seems to be an ugly solution but since I'm cut of time in the moment and it is just for experimental install of zabbix-agent on CentOS
plus we already trusted the zabbix package repository anyways, I guess it doesn't much matter.
4. Configure Zabbix-agent on the machine
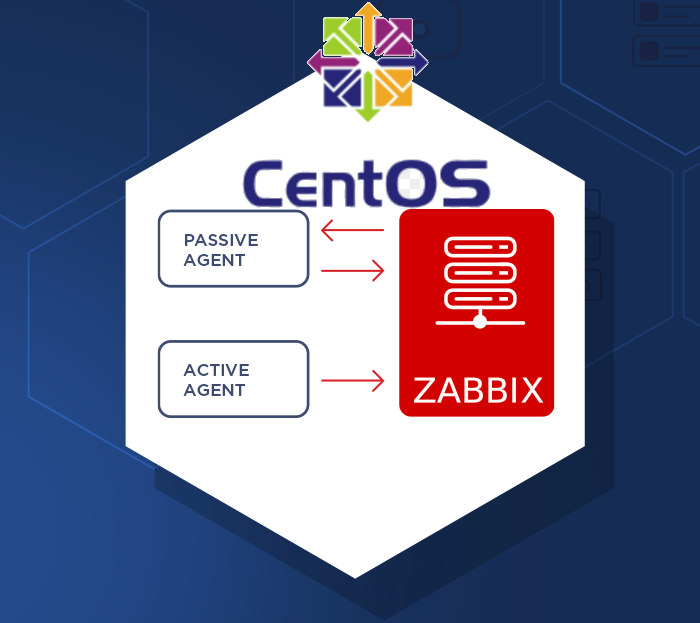
Once you choose how the zabbix-agent should sent the data to the zabbix-server (e.g. Active or Passive) mode the The minimum set of configuration you should
have at place should be something like mine:
[root@centos9 ~]# grep -v '\#' /etc/zabbix/zabbix_agentd.conf | sed /^$/d
PidFile=/var/run/zabbix/zabbix_agentd.pid
LogFile=/var/log/zabbix/zabbix_agentd.log
LogFileSize=0
Server=192.168.1.70,127.0.0.1
ServerActive=192.168.1.70,127.0.0.1
Hostname=centos9
Include=/etc/zabbix/zabbix_agentd.d/*.conf
5. Start and Enable zabbix-agent client
To have it up and running
[root@centos9 ~]# systemct start zabbix-agent
[root@centos9 ~]# systemctl enable zabbix-agent
6. Disable SELinux to prevent it interfere with zabbix-agentd
Other amazement was that even though I've now had configured Active check and a Server and correct configuration the Zabbix-Server could not reach the zabbix-agent for some weird reason.
I thought that it might be selinux and checked it and seems by default in the fresh installed CentOS 9 Linux selinux is already automatically set to enabled.
After stopping it i made sure, SeLinux would block for security reasons client connectivity to the zabbix-server until you either allow zabbix exception in SeLinux or until completely disable it.
[root@centos9 ~]# sestatus
SELinux status: enabled
SELinuxfs mount: /sys/fs/selinux
SELinux root directory: /etc/selinux
Loaded policy name: targeted
Current mode: enforcing
Mode from config file: enforcing
Policy MLS status: enabled
Policy deny_unknown status: allowed
Memory protection checking: actual (secure)
Max kernel policy version: 31
To temporarily change the mode from its default targeted to permissive mode
[root@centos9 ~]# setenforce 0
[root@centos9 ~]# sestatus
SELinux status: enabled
SELinuxfs mount: /sys/fs/selinux
SELinux root directory: /etc/selinux
Loaded policy name: targeted
Current mode: permissive
Mode from config file: permissive
Policy MLS status: enabled
Policy deny_unknown status: allowed
Memory protection checking: actual (secure)
Max kernel policy version: 31
That would work for current session but won't take affect on next reboot, thus it is much better to disable selinux on next boot:
[root@centos9 ~]# cat /etc/selinux/config
# This file controls the state of SELinux on the system.
# SELINUX= can take one of these three values:
# enforcing – SELinux security policy is enforced.
# permissive – SELinux prints warnings instead of enforcing.
# disabled – No SELinux policy is loaded.
SELINUX=permissive
# SELINUXTYPE= can take one of these three values:
# targeted – Targeted processes are protected,
# minimum – Modification of targeted policy. Only selected processes are protected.
# mls – Multi Level Security protection.
SELINUXTYPE=targeted
To disable selinux change:
SELINUXTYPE=disabled
[root@centos9 ~]# grep -v \# /etc/selinux/config
SELINUX=disabled
SELINUXTYPE=targeted
To make the OS disable selinux and test it is disabled you will have to reboot
[root@centos9 ~]# reboot
Check its status again, it should be:
[root@centos9 ~]# sestatus
SELinux status: disabled
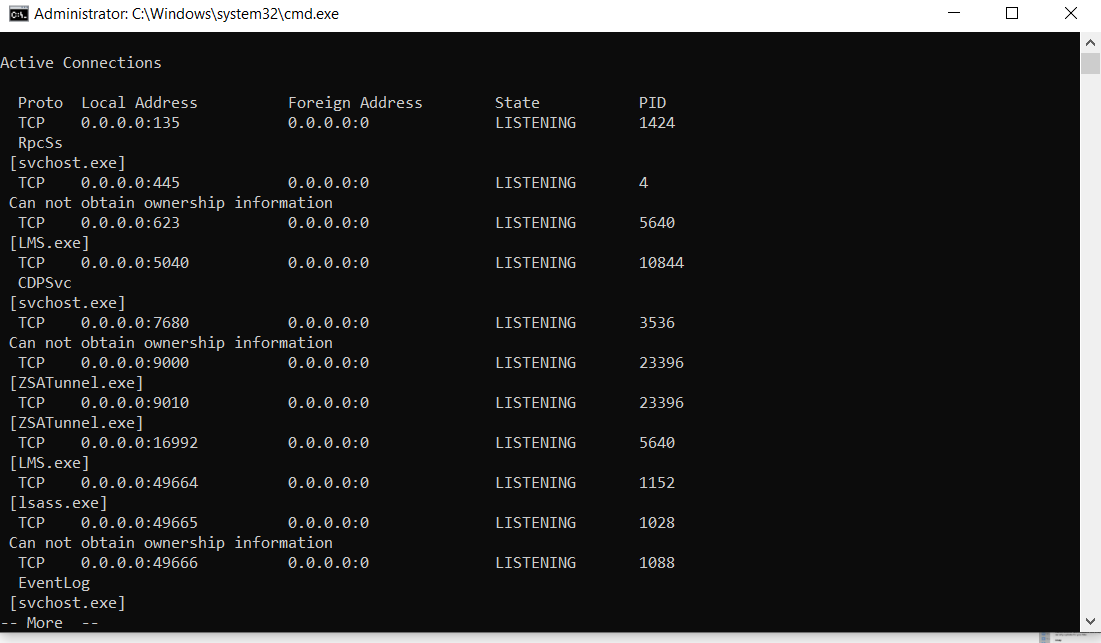
7. Enable zabbix-agent through firewall or disable firewalld service completely
By default CentOS 9 has the firewalld also enabled and either you have to enable zabbix to communicate to the remote server host.
To enable access for from and to zabbix-agentd in both Active / Passive mode:
#firewall settings:
[root@centos9 rpm-gpg]# firewall-cmd –permanent –add-port=10050/tcp
[root@centos9 rpm-gpg]# firewall-cmd –permanent –add-port=10051/tcp
[root@centos9 rpm-gpg]# firewall-cmd –reload
[root@centos9 rpm-gpg]# systemctl restart firewalld
[root@centos9 rpm-gpg]# systemctl restart zabbix-agent
If the machine is in a local DMZ-ed network with tightly configured firewall router in front of it, you could completely disable firewalld.
[root@centos9 rpm-gpg]# systemctl stop firewalld
[root@centos9 rpm-gpg]# systemctl disable firewalld
Removed /etc/systemd/system/multi-user.target.wants/firewalld.service.
Removed /etc/systemd/system/dbus-org.fedoraproject.FirewallD1.service.
Next login to Zabbix-server web interface with administrator and from Configuration -> Hosts -> Create the centos9 hostname and add it a template of choice. The data from the added machine should shortly appear after another zabbix restart:
[root@centos9 rpm-gpg]# systemctl restart zabbix-agentd
8. Tracking other oddities with the zabbix-agent through log
If anyways still zabbix have issues connectin to remote node, increase the debug log level section
[root@centos9 rpm-gpg]# vim /etc/zabbix/zabbix_agentd.conf
DebugLevel 5
### Option: DebugLevel
# Specifies debug level:
# 0 – basic information about starting and stopping of Zabbix processes
# 1 – critical information
# 2 – error information
# 3 – warnings
# 4 – for debugging (produces lots of information)
# 5 – extended debugging (produces even more information)
#
# Mandatory: no
# Range: 0-5
# Default:
# DebugLevel=3
[root@centos9 rpm-gpg]# systemctl restart zabbix-agent
Keep in mind that debugging will be too verbose, so once you make the machine being seen in zabbix, don't forget to comment out the line and restart agent to turn it off.
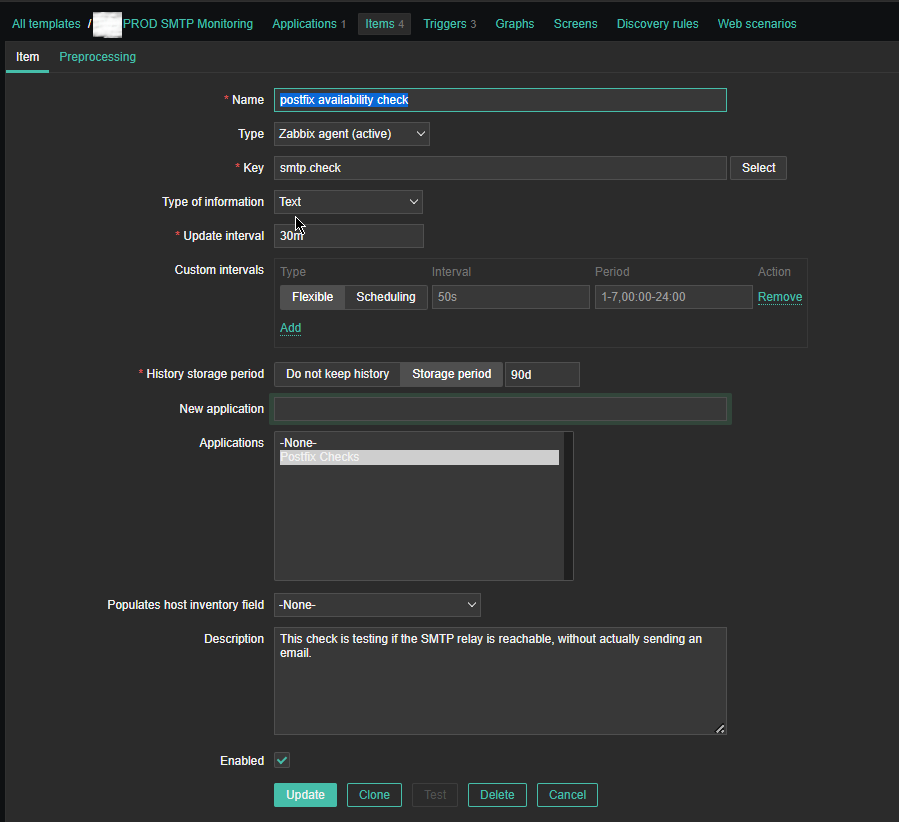
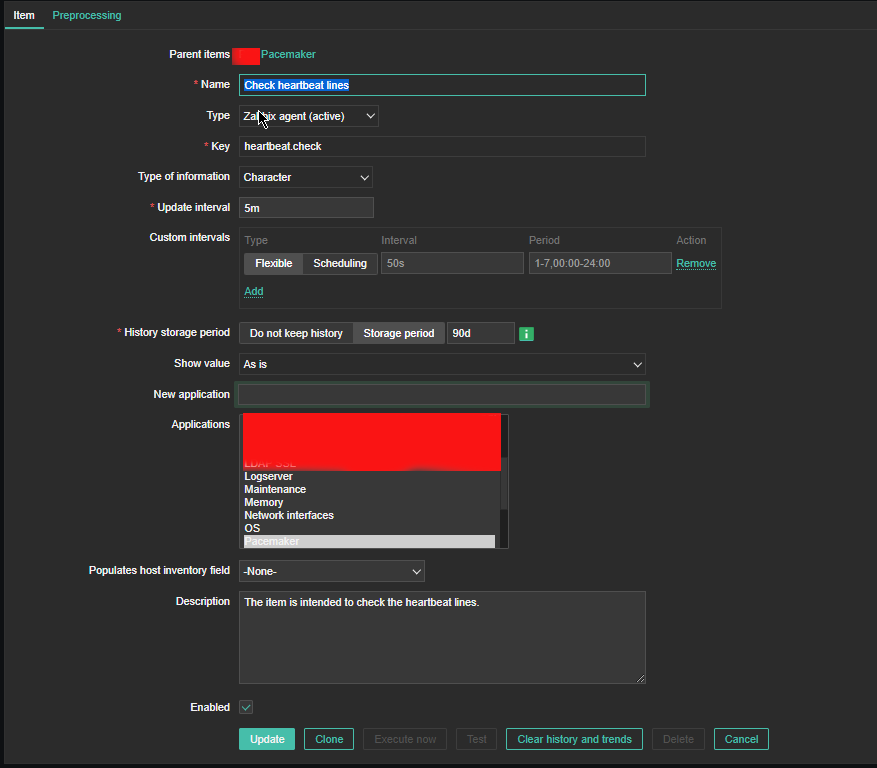
9. Testing zabbix-agent, How to send an alert to specific item key
Usually when writting userparameter scripts, data collected from scripts is being sent to zabbix serveria via Item keys.
Thus one way to check the zabbix-agent -> zabbix server data send works fine is to send some simultaneous data via a key
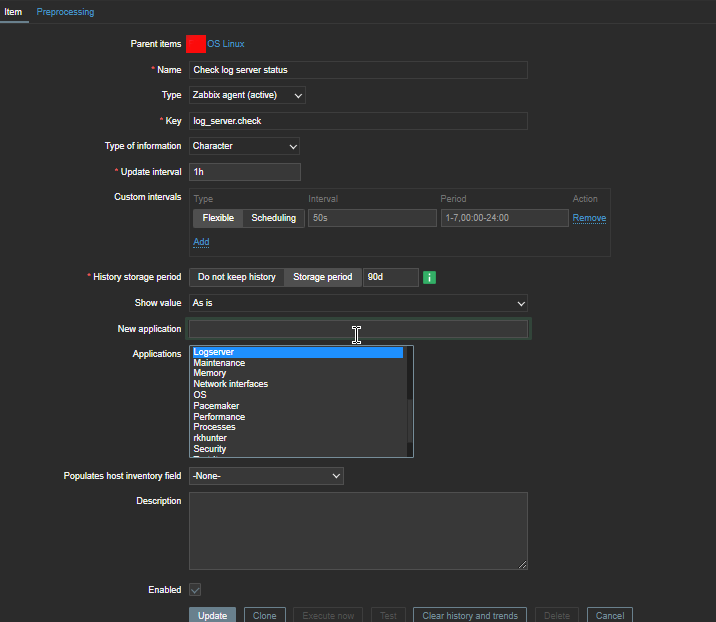
Once zabbix-agent is configured on the machine
In this case we will use something like ApplicationSupport-Item as an item.
[root@centos9 rpm-gpg]# /usr/bin/zabbix_sender -c "/etc/zabbix/zabbix_agentd.conf" -k "ApplicationSupport-Item" -o "here is the message"
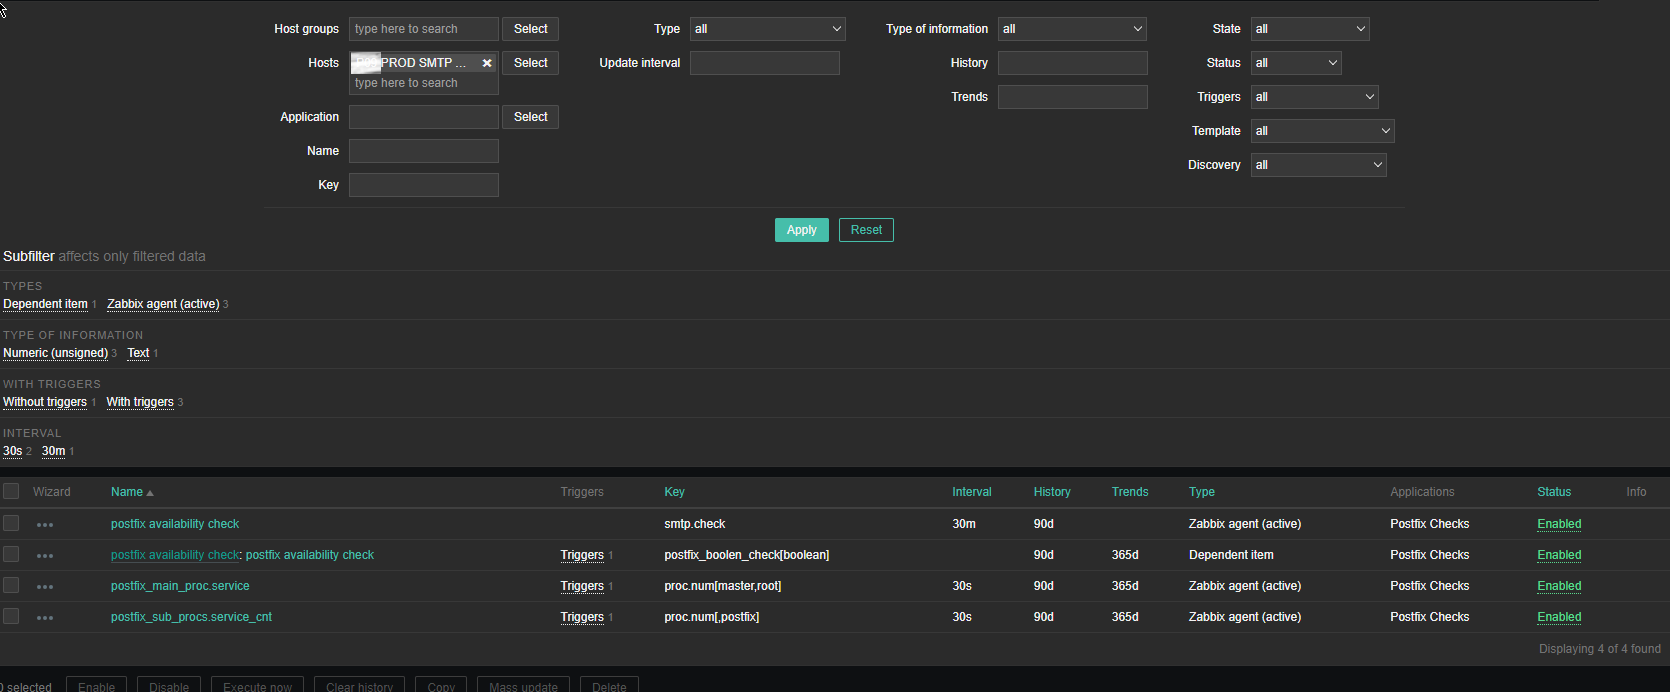
Assuming you have created the newly prepared zabbix-agent host into Zabbix Server, you should be shortly able to see the data come in Latest data.

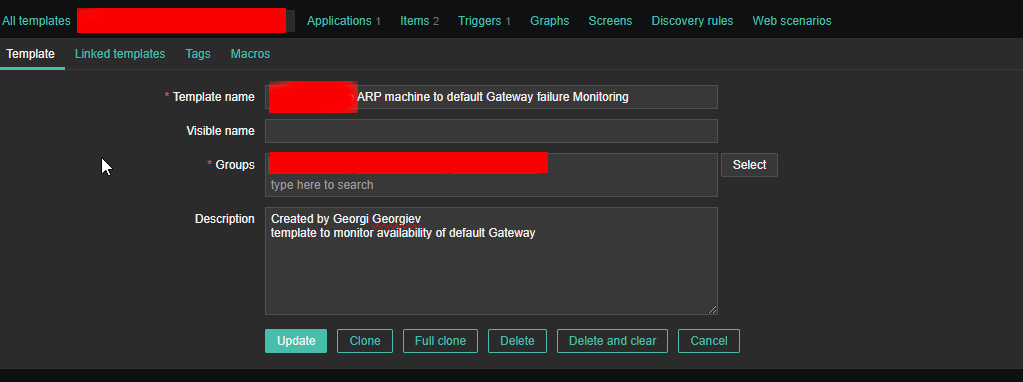

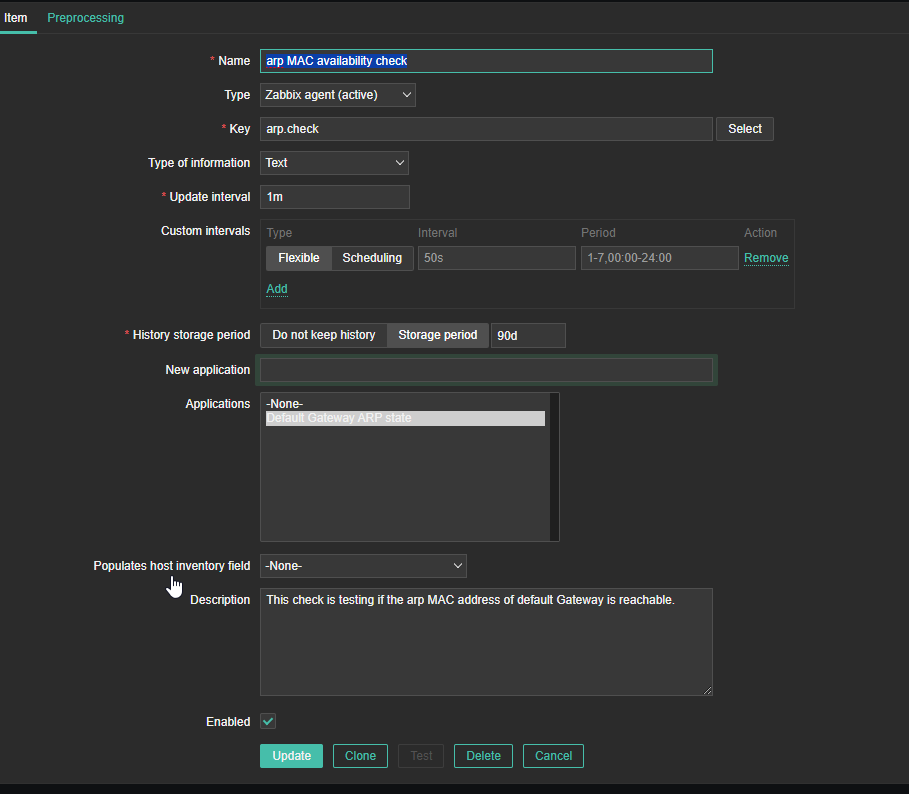
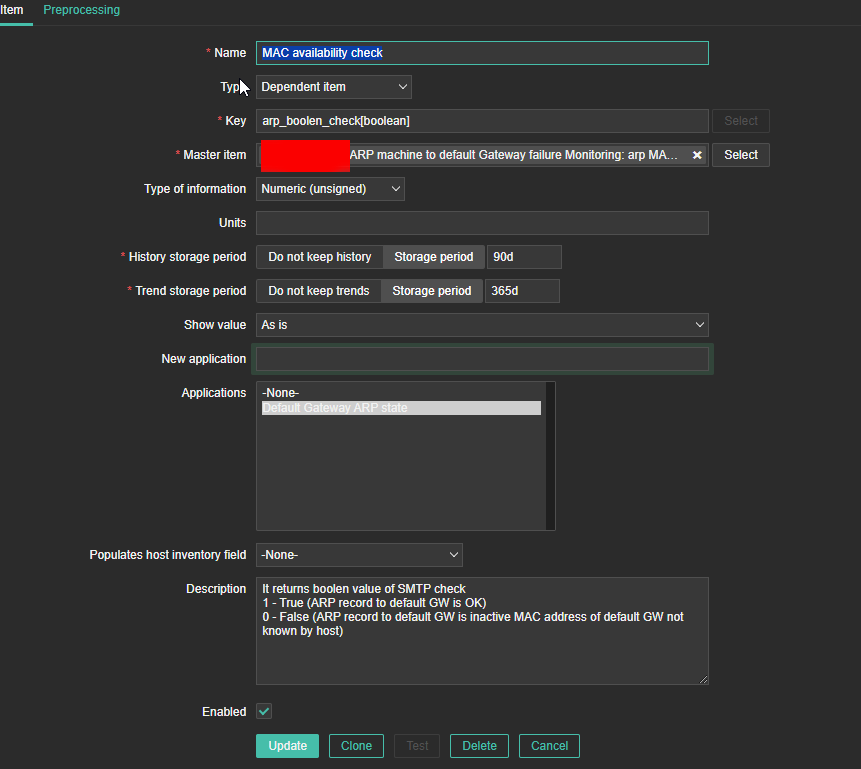
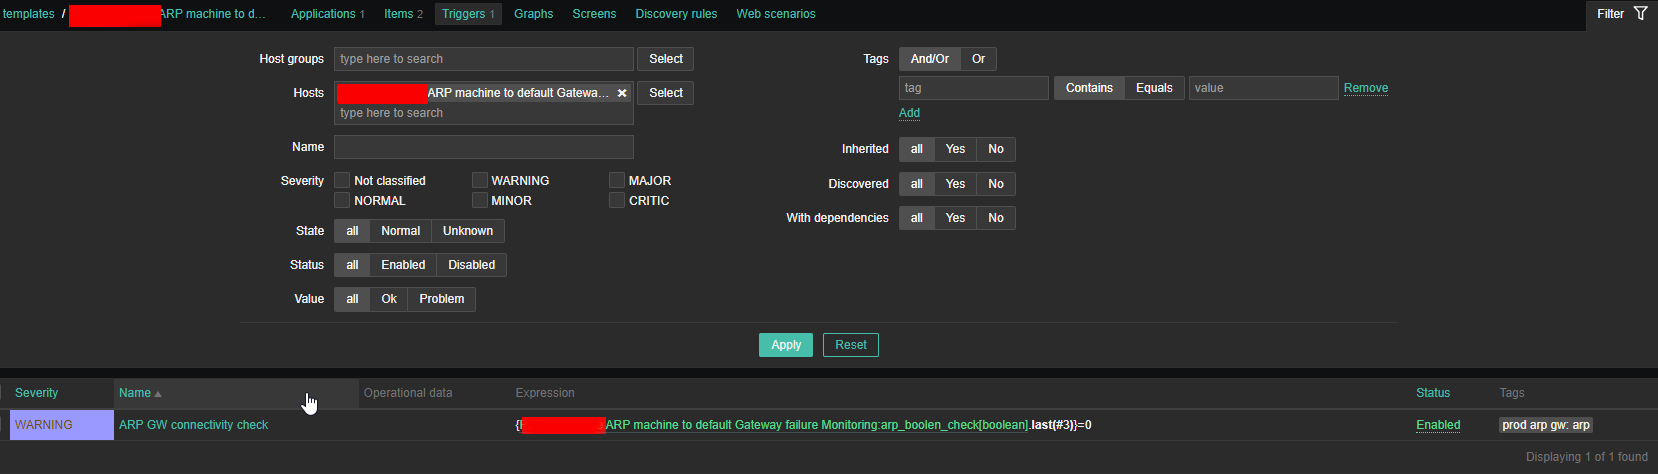
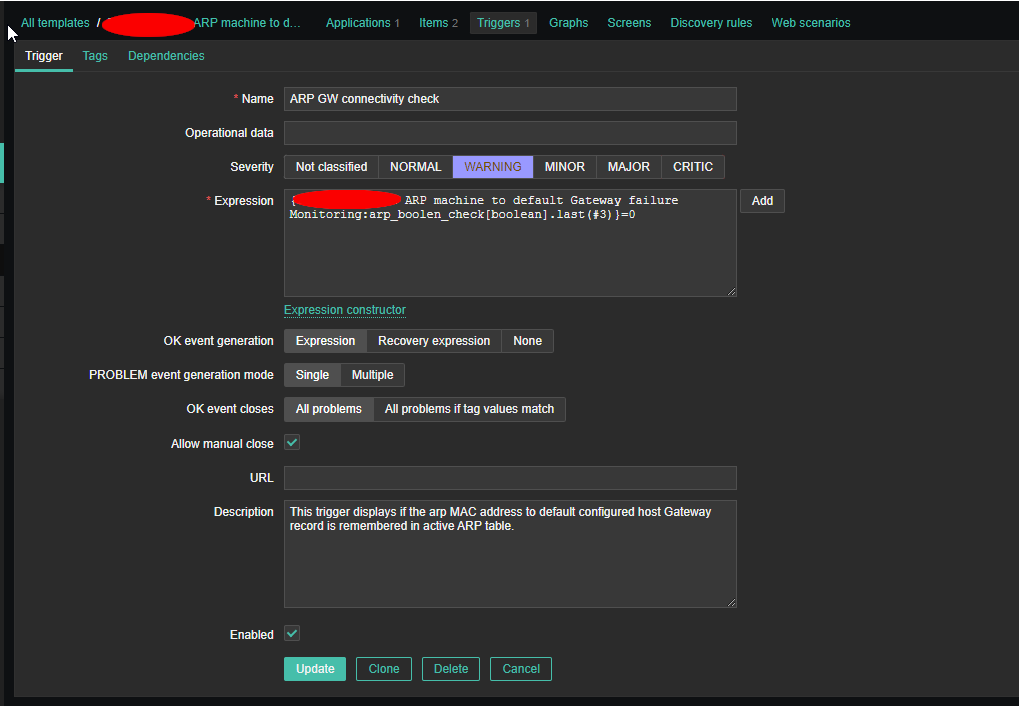


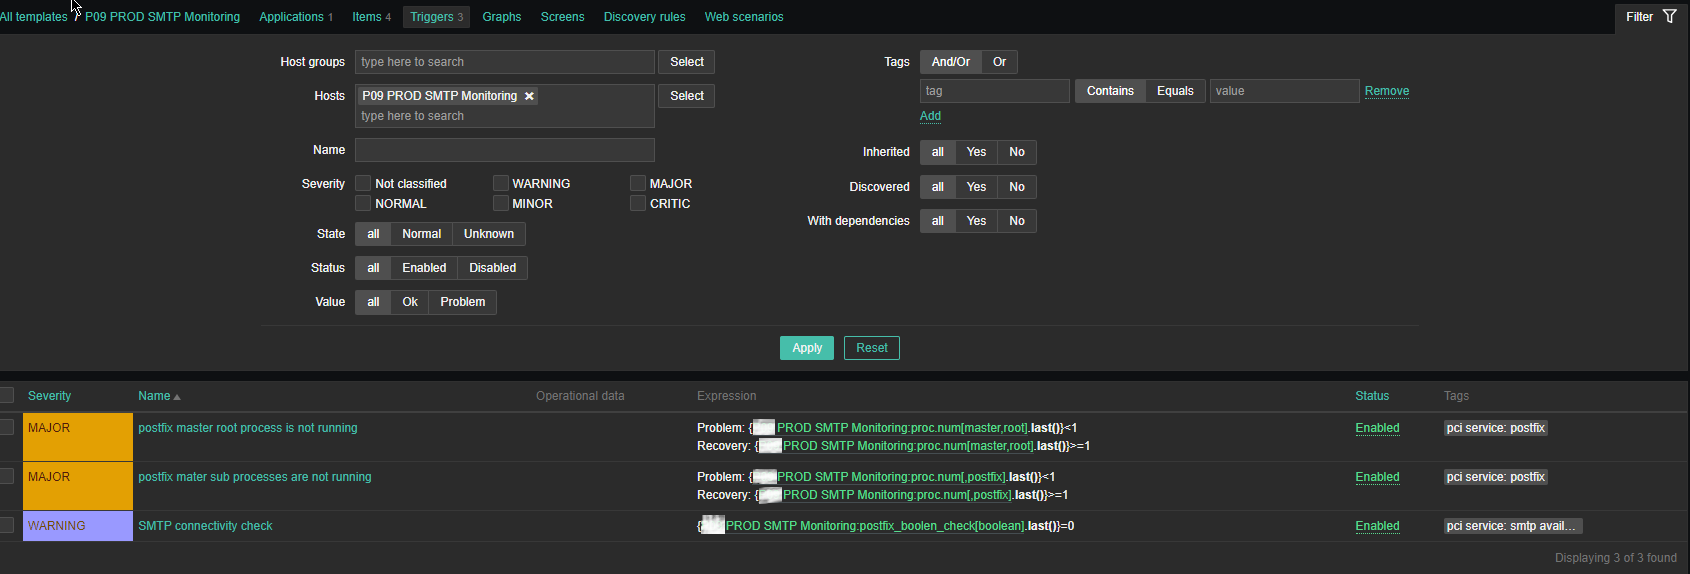
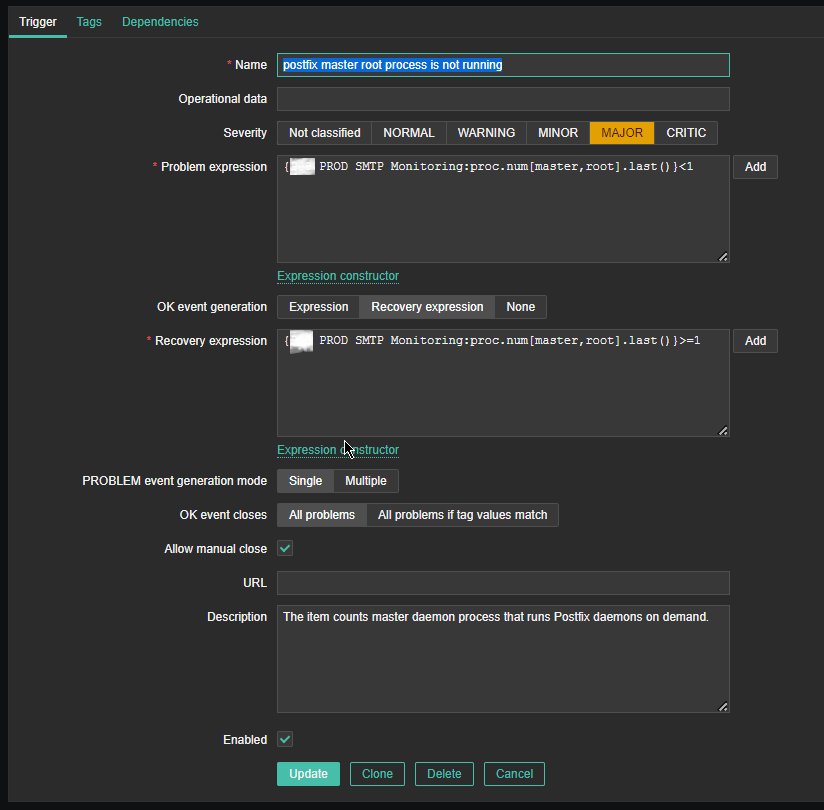
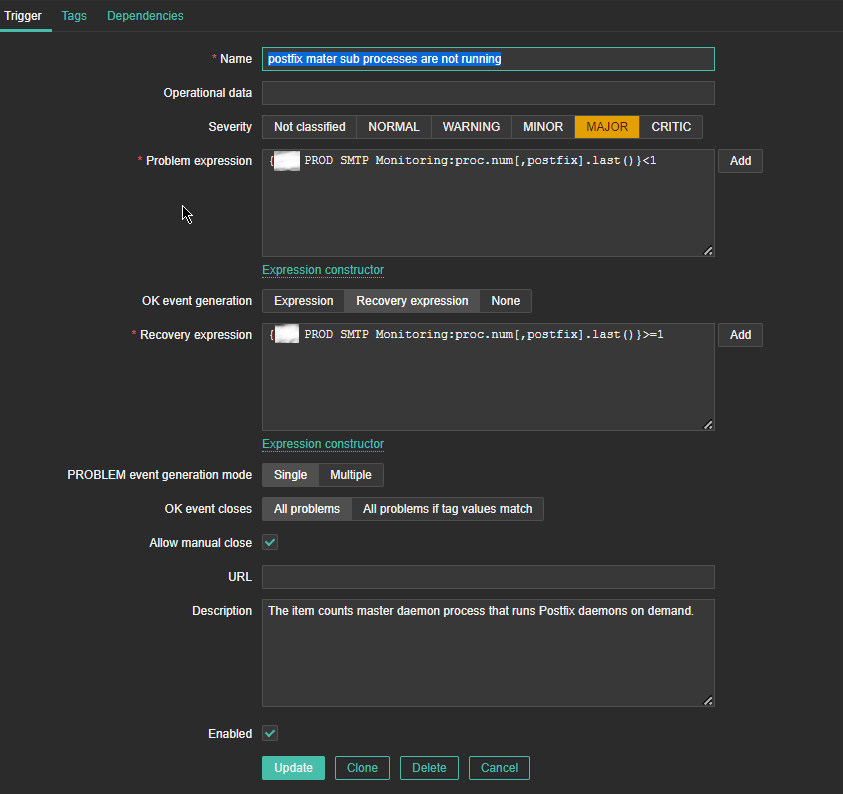
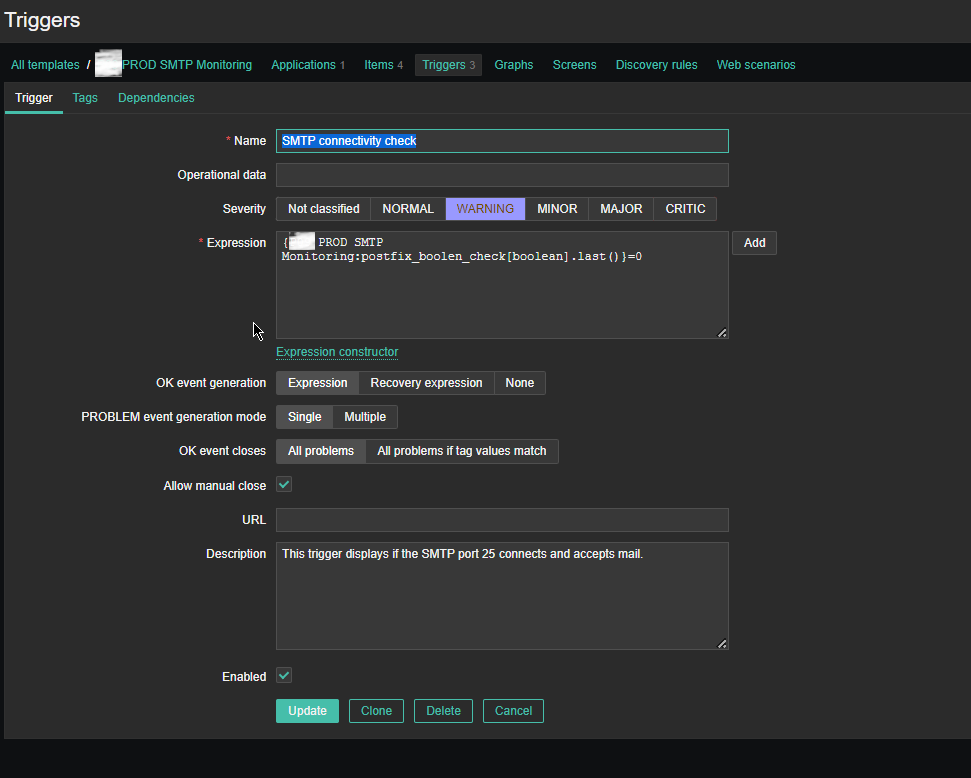


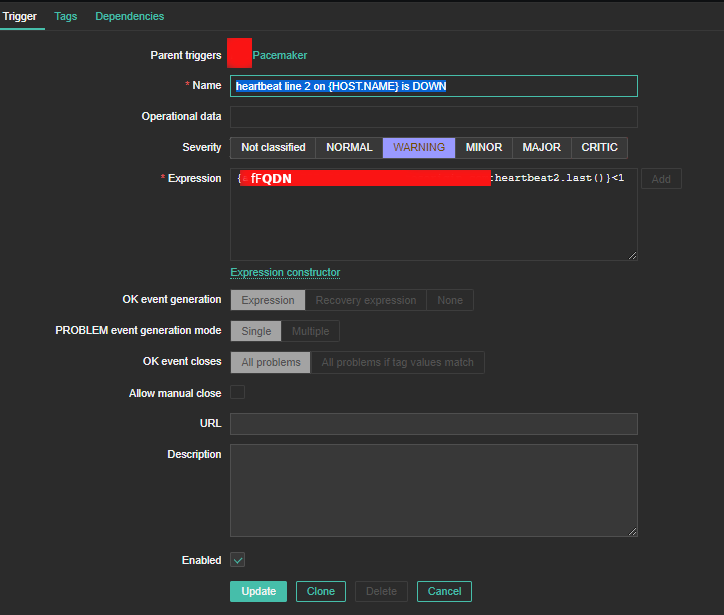
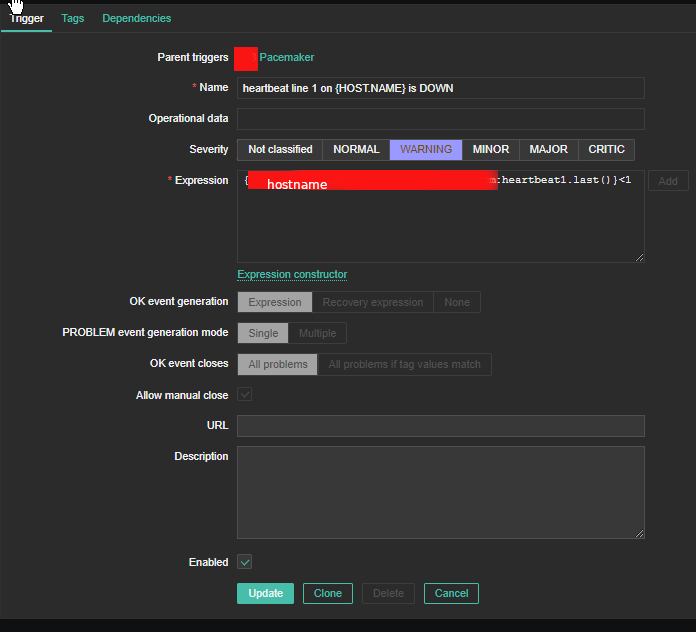
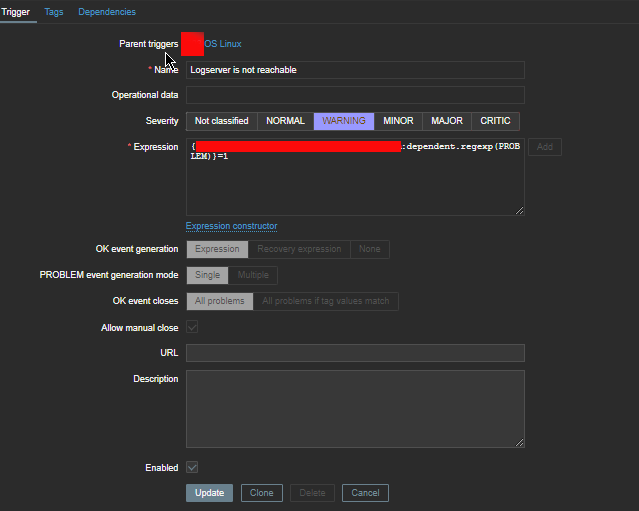
 4. Create a Zabbix trigger