If you're Linux ystem administrator in Webhosting company providing WordPress / Joomla / Drupal web-sites hosting and your UNIX servers suffer from periodic denial of service attacks, because some of the site customers business is a target of competitor company who is trying to ruin your client business sites through DoS or DDOS attacks, then the best thing you can do is to identify who and how is the Linux server being hammered. If you find out DoS is not on a network level but Apache gets crashing because of memory leaks and connections to Apache are so much that the CPU is being stoned, the best thing to do is to check which IP addresses are causing the excessive GET / POST / HEAD requests in logged.
There is the Apachetop tool that can give you the most accessed webserver URLs in a refreshed screen like UNIX top command, however Apachetop does not show which IP does most URL hits on Apache / Nginx webserver.
1. Get basic information on which IPs accesses Apache / Nginx the most using shell cmds
Before examining the Webserver logs it is useful to get a general picture on who is flooding you on a TCP / IP network level, with netstat like so:
# here is howto check clients count connected to your server
netstat -ntu | awk '{print $5}' | cut -d: -f1 | sort | uniq -c | sort -n
If you get an extensive number of connected various IPs / hosts (like 10000 or something huge as a number), depending on the type of hardware the server is running and the previous scaling planned for the system you can determine whether the count as huge as this can be handled normally by server, if like in most cases the server is planned to serve a couple of hundreds or thousands of clients and you get over 10000 connections hanging, then your server is under attack or if its Internet server suddenly your website become famous like someone posted an article on some major website and you suddenly received a tons of hits.
There is a way using standard shell tools, to get some basic information on which IP accesses the webserver the most with:
tail -n 500 /var/log/apache2/access.log | cut -d' ' -f1 | sort | uniq -c | sort -gr
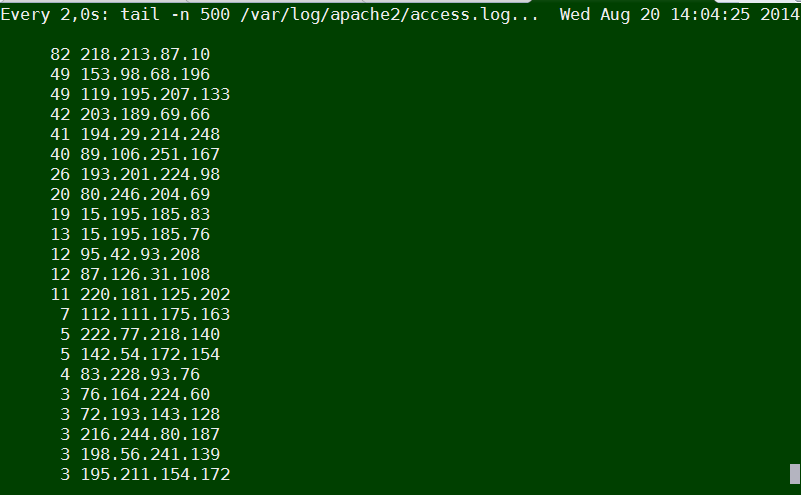
Or if you want to keep it refreshing periodically every few seconds run it through watch command:
watch "tail -n 500 /var/log/apache2/access.log | cut -d' ' -f1 | sort | uniq -c | sort -gr"
Another useful combination of shell commands is to Monitor POST / GET / HEAD requests number in access.log :
awk '{print $6}' access.log | sort | uniq -c | sort -n
1 "alihack<%eval
1 "CONNECT
1 "fhxeaxb0xeex97x0fxe2-x19Fx87xd1xa0x9axf5x^xd0x125x0fx88x19"x84xc1xb3^v2xe9xpx98`X'dxcd.7ix8fx8fxd6_xcdx834x0c"
1 "x16x03x01"
1 "xe2
2 "mgmanager&file=imgmanager&version=1576&cid=20
6 "4–"
7 "PUT
22 "–"
22 "OPTIONS
38 "PROPFIND
1476 "HEAD
1539 "-"
65113 "POST
537122 "GET
However using shell commands combination is plenty of typing and hard to remember, plus above tools does not show you, approximately how frequenty IP hits the webserver
2. Real-time monitoring IP addresses with highest URL reqests with logtop
Real-time monitoring on IP addresses with highest URL requests is possible with no need of "console ninja skills" through – logtop.
2.1 Install logtop on Debian / Ubuntu and deb derivatives Linux
a) Installing Logtop the debian way
LogTop is easily installable on Debian and Ubuntu in newer releases of Debian – Debian 7.0 and Ubuntu 13/14 Linux it is part of default package repositories and can be straightly apt-get-ed with:
apt-get install –yes logtop
b) Installing Logtop from source code (install on older deb based Linuxes)
On older Debian – Debian 6 and Ubuntu 7-12 servers to install logtop compile from source code – read the README installation instructions or if lazy copy / paste below:
cd /usr/local/src
wget https://github.com/JulienPalard/logtop/tarball/master
mv master JulienPalard-logtop.tar.gz
tar -zxf JulienPalard-logtop.tar.gz
cd JulienPalard-logtop-*/
aptitude install libncurses5-dev uthash-dev
…
aptitude install python-dev swig
…
make python-module
…
python setup.py install
…
make
…
make install
mkdir -p /usr/bin/
cp logtop /usr/bin/
2.2 Install Logtop on CentOS 6.5 / 7.0 / Fedora / RHEL and rest of RPM based Linux-es
b) Install logtop on CentOS 6.5 and CentOS 7 Linux
– For CentOS 6.5 you need to rpm install epel-release-6-8.noarch.rpm
wget http://dl.fedoraproject.org/pub/epel/6/x86_64/epel-release-6-8.noarch.rpm
rpm -ivh epel-release-6-8.noarch.rpm
links http://dl.fedoraproject.org/pub/epel/6/SRPMS/uthash-1.9.9-6.el6.src.rpm
rpmbuild –rebuild uthash-1.9.9-6.el6.src.rpm
cd /root/rpmbuild/RPMS/noarch
rpm -ivh uthash-devel-1.9.9-6.el6.noarch.rpm
– For CentOS 7 you need to rpm install epel-release-7-0.2.noarch.rpm
links http://download.fedoraproject.org/pub/epel/beta/7/x86_64/repoview/epel-release.html
Click on and download epel-release-7-0.2.noarch.rpm
rpm -ivh epel-release-7-0.2.noarch
rpm –import /etc/pki/rpm-gpg/RPM-GPG-KEY-EPEL-7
yum -y install git ncurses-devel uthash-devel
git clone https://github.com/JulienPalard/logtop.git
cd logtop
make
make install
2.3 Some Logtop use examples and short explanation
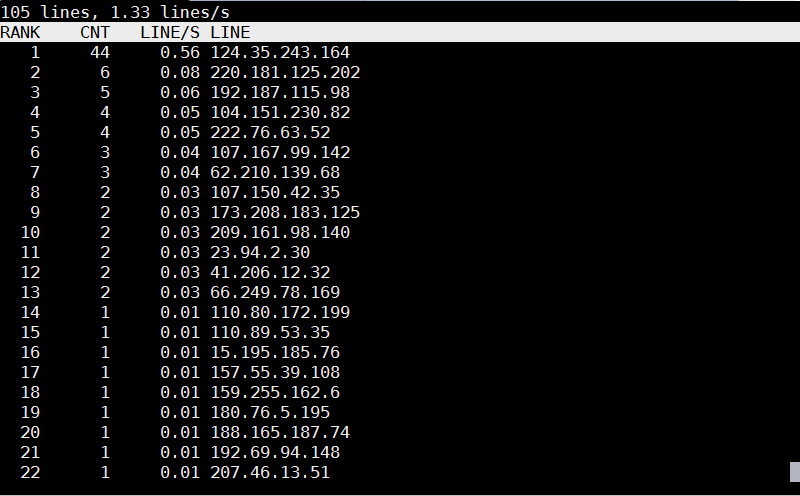
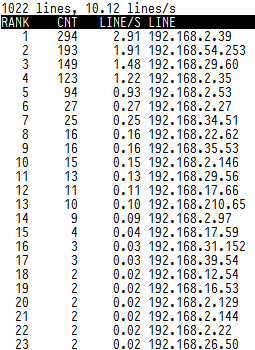
logtop shows 4 columns as follows – Line number, Count, Frequency, and Actual line
The quickest way to visualize which IP is stoning your Apache / Nginx webserver on Debian?
tail -f access.log | awk {'print $1; fflush();'} | logtop
On CentOS / RHEL
tail -f /var/log/httpd/access_log | awk {'print $1; fflush();'} | logtop
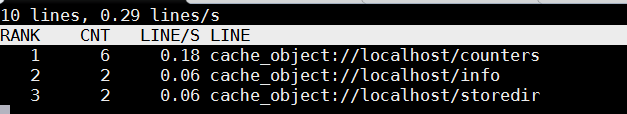
Using LogTop even Squid Proxy caching server access.log can be monitored.
To get squid Top users by IP listed:
tail -f /var/log/squid/access.log | awk {'print $1; fflush();'} | logtop
Or you might visualize in real-time squid cache top requested URLs
tail -f /var/log/squid/access.log | awk {'print $7; fflush();'} | logtop
3. Automatically Filter IP addresses causing Apache / Nginx Webservices Denial of Service with fail2ban
Once you identify the problem if the sites hosted on server are target of Distributed DoS, probably your best thing to do is to use fail2ban to automatically filter (ban) IP addresses doing excessive queries to system services. Assuming that you have already installed fail2ban as explained in above link (On Debian / Ubuntu Linux) with:
apt-get install –yes fail2ban
To make fail2ban start filtering DoS attack IP addresses, you will have to set the following configurations:
vim /etc/fail2ban/jail.conf
Paste in file:
[http-get-dos]
enabled = true
port = http,https
filter = http-get-dos
logpath = /var/log/apache2/WEB_SERVER-access.log
# maxretry is how many GETs we can have in the findtime period before getting narky
maxretry = 300
# findtime is the time period in seconds in which we're counting "retries" (300 seconds = 5 mins)
findtime = 300
# bantime is how long we should drop incoming GET requests for a given IP for, in this case it's 5 minutes
bantime = 300
action = iptables[name=HTTP, port=http, protocol=tcp]
Before you paste make sure you put the proper logpath = location of webserver (default one is /var/log/apache2/access.log), if you're using multiple logs for each and every of hosted websites, you will probably want to write a script to automatically loop through all logs directory get log file names and automatically add auto-modified version of above [http-get-dos] configuration. Also configure maxtretry per IP, findtime and bantime, in above example values are a bit low and for heavy loaded websites which has to serve thousands of simultaneous connections originating from office networks using Network address translation (NAT), this might be low and tuned to prevent situations, where even the customer of yours can't access there websites 🙂
To finalize fail2ban configuration, you have to create fail2ban filter file:
vim /etc/fail2ban/filters.d/http-get-dos.conf
Paste:
# Fail2Ban configuration file
#
# Author: http://www.go2linux.org
#
[Definition]
# Option: failregex
# Note: This regex will match any GET entry in your logs, so basically all valid and not valid entries are a match.
# You should set up in the jail.conf file, the maxretry and findtime carefully in order to avoid false positives.
failregex = ^<HOST> -.*"(GET|POST).*
# Option: ignoreregex
# Notes.: regex to ignore. If this regex matches, the line is ignored.
# Values: TEXT
#
ignoreregex =
To make fail2ban load new created configs restart it:
/etc/init.d/fail2ban restart
If you want to test whether it is working you can use Apache webserver Benchmark tools such as ab or siege.
The quickest way to test, whether excessive IP requests get filtered – and make your IP banned temporary:
ab -n 1000 -c 20 http://your-web-site-dot-com/
This will make 1000 page loads in 20 concurrent connections and will add your IP to temporary be banned for (300 seconds) = 5 minutes. The ban will be logged in /var/log/fail2ban.log, there you will get smth like:
2014-08-20 10:40:11,943 fail2ban.actions: WARNING [http-get-dos] Ban 192.168.100.5
2013-08-20 10:44:12,341 fail2ban.actions: WARNING [http-get-dos] Unban 192.168.100.5