Configuring a Linux HA (High Availibiltiy) for an Application with Haproxy is already used across many Websites on the Internet and serious corporations that has a crucial infrastructure has long time
adopted and used keepalived to provide High Availability Application level Clustering.
Usually companies choose to use HA Clusters with Haproxy with Pacemaker and Corosync cluster tools.
However one common used alternative solution if you don't have the oportunity to bring up a High availability cluster with Pacemaker / Corosync / pcs (Pacemaker Configuration System) due to fact machines you need to configure the cluster on are not Physical but VMWare Virtual Machines which couldn't not have configured a separate Admin Lans and Heartbeat Lan as we usually do on a Pacemaker Cluster due to the fact the 5 Ethernet LAN Card Interfaces of the VMWare Hypervisor hosts are configured as a BOND (e.g. all the incoming traffic to the VMWare vSphere HV is received on one Virtual Bond interface).
I assume you have 2 separate vSphere Hypervisor Physical Machines in separate Racks and separate switches hosting the two VMs.
For the article, I'll call the two brand new brought Virtual Machines with some installation automation software such as Terraform or Ansible – vm-server1 and vm-server2 which would have configured some recent version of Linux.
In that scenario to have a High Avaiability for the VMs on Application level and assure at least one of the two is available at a time if one gets broken due toe malfunction of the HV, a Network connectivity issue, or because the VM OS has crashed.
Then one relatively easily solution is to use keepalived and configurea single High Availability Virtual IP (VIP) Address, i.e. 10.10.10.1, which would float among two VMs using keepalived so at a time at least one of the two VMs would be reachable on the Network.
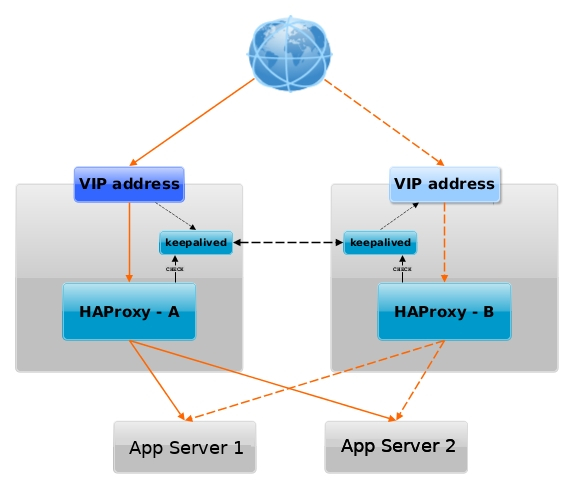
Having a VIP IP is quite a common solution in corporate world, as it makes it pretty easy to add F5 Load Balancer in front of the keepalived cluster setup to have a 3 Level of security isolation, which usually consists of:
1. Physical (access to the hardware or Virtualization hosts)
2. System Access (The mechanism to access the system login credetials users / passes, proxies, entry servers leading to DMZ-ed network)
3. Application Level (access to different programs behind L2 and data based on the specific identity of the individual user,
special Secondary UserID, Factor authentication, biometrics etc.)
1. Install keepalived and haproxy on machines
Depending on the type of Linux OS:
On both machines
[root@server1:~]# yum install -y keepalived haproxy
…
If you have to install keepalived / haproxy on Debian / Ubuntu and other Deb based Linux distros
[root@server1:~]# apt install keepalived haproxy –yes
…
2. Configure haproxy (haproxy.cfg) on both server1 and server2
Create some /etc/haproxy/haproxy.cfg configuration
[root@server1:~]# vim /etc/haproxy/haproxy.cfg
#———————————————————————
# Global settings
#———————————————————————
global
log 127.0.0.1 local6 debug
chroot /var/lib/haproxy
pidfile /run/haproxy.pid
stats socket /var/lib/haproxy/haproxy.sock mode 0600 level admin
maxconn 4000
user haproxy
group haproxy
daemon
#debug
#quiet
#———————————————————————
# common defaults that all the 'listen' and 'backend' sections will
# use if not designated in their block
#———————————————————————
defaults
mode tcp
log global
# option dontlognull
# option httpclose
# option httplog
# option forwardfor
option redispatch
option log-health-checks
timeout connect 10000 # default 10 second time out if a backend is not found
timeout client 300000
timeout server 300000
maxconn 60000
retries 3
#———————————————————————
# round robin balancing between the various backends
#———————————————————————
listen FRONTEND_APPNAME1
bind 10.10.10.1:15000
mode tcp
option tcplog
# #log global
log-format [%t]\ %ci:%cp\ %bi:%bp\ %b/%s:%sp\ %Tw/%Tc/%Tt\ %B\ %ts\ %ac/%fc/%bc/%sc/%rc\ %sq/%bq
balance roundrobin
timeout client 350000
timeout server 350000
timeout connect 35000
server app-server1 10.10.10.55:30000 weight 1 check port 68888
server app-server2 10.10.10.55:30000 weight 2 check port 68888
listen FRONTEND_APPNAME2
bind 10.10.10.1:15000
mode tcp
option tcplog
#log global
log-format [%t]\ %ci:%cp\ %bi:%bp\ %b/%s:%sp\ %Tw/%Tc/%Tt\ %B\ %ts\ %ac/%fc/%bc/%sc/%rc\ %sq/%bq
balance roundrobin
timeout client 350000
timeout server 350000
timeout connect 35000
server app-server1 10.10.10.55:30000 weight 5
server app-server2 10.10.10.55:30000 weight 5
You can get a copy of above haproxy.cfg configuration here.
Once configured roll it on.
[root@server1:~]# systemctl start haproxy
[root@server1:~]# ps -ef|grep -i hapro
root 285047 1 0 Mar07 ? 00:00:00 /usr/sbin/haproxy -Ws -f /etc/haproxy/haproxy.cfg -p /run/haproxy.pid
haproxy 285050 285047 0 Mar07 ? 00:00:26 /usr/sbin/haproxy -Ws -f /etc/haproxy/haproxy.cfg -p /run/haproxy.pid
Bring up the haproxy also on server2 machine, by placing same configuration and starting up the proxy.
[root@server1:~]# vim /etc/haproxy/haproxy.cfg
…
…
3. Configure keepalived on both servers
We'll be configuring 2 nodes with keepalived even though if necessery this can be easily extended and you can add more nodes.
First we make a copy of the original or existing server configuration keepalived.conf (just in case we need it later on or if you already had something other configured manually by someone – that could be so on inherited servers by other sysadmin)
[root@server1:~]# mv /etc/keepalived/keepalived.conf /etc/keepalived/keepalived.conf.orig
[root@server2:~]# mv /etc/keepalived/keepalived.conf /etc/keepalived/keepalived.conf.orig
a. Configure keepalived to serve as a MASTER Node
[root@server1:~]# vim /etc/keepalived/keepalived.conf
Master Node
global_defs {
router_id server1-fqdn # The hostname of this host.
enable_script_security
# Synchro of the state of the connections between the LBs on the eth0 interface
lvs_sync_daemon eth0
notification_email {
linuxadmin@notify-domain.com # Email address for notifications
}
notification_email_from keepalived@server1-fqdn # The from address for the notifications
smtp_server 127.0.0.1 # SMTP server address
smtp_connect_timeout 15
}
vrrp_script haproxy {
script "killall -0 haproxy"
interval 2
weight 2
user root
}
vrrp_instance LB_VIP_QA {
virtual_router_id 50
advert_int 1
priority 51
state MASTER
interface eth0
smtp_alert # Enable Notifications Via Email
authentication {
auth_type PASS
auth_pass testp141
}
### Commented because running on VM on VMWare
## unicast_src_ip 10.44.192.134 # Private IP address of master
## unicast_peer {
## 10.44.192.135 # Private IP address of the backup haproxy
## }
# }
# master node with higher priority preferred node for Virtual IP if both keepalived up
### priority 51
### state MASTER
### interface eth0
virtual_ipaddress {
10.10.10.1 dev eth0 # The virtual IP address that will be shared between MASTER and BACKUP
}
track_script {
haproxy
}
}
To dowload a copy of the Master keepalived.conf configuration click here
Below are few interesting configuration variables, worthy to mention few words on, most of them are obvious by their names but for more clarity I'll also give a list here with short description of each:
- vrrp_instance – defines an individual instance of the VRRP protocol running on an interface.
- state – defines the initial state that the instance should start in (i.e. MASTER / SLAVE )state –
- interface – defines the interface that VRRP runs on.
- virtual_router_id – should be unique value per Keepalived Node (otherwise slave master won't function properly)
- priority – the advertised priority, the higher the priority the more important the respective configured keepalived node is.
- advert_int – specifies the frequency that advertisements are sent at (1 second, in this case).
- authentication – specifies the information necessary for servers participating in VRRP to authenticate with each other. In this case, a simple password is defined.
only the first eight (8) characters will be used as described in to note is Important thing
man keepalived.conf – keepalived.conf variables documentation !!! Nota Bene !!! – Password set on each node should match for nodes to be able to authenticate ! - virtual_ipaddress – defines the IP addresses (there can be multiple) that VRRP is responsible for.
- notification_email – the notification email to which Alerts will be send in case if keepalived on 1 node is stopped (e.g. the MASTER node switches from host 1 to 2)
- notification_email_from – email address sender from where email will originte
! NB ! In order for notification_email to be working you need to have configured MTA or Mail Relay (set to local MTA) to another SMTP – e.g. have configured something like Postfix, Qmail or Postfix
b. Configure keepalived to serve as a SLAVE Node
[root@server1:~]# vim /etc/keepalived/keepalived.conf
#Slave keepalived
global_defs {
router_id server2-fqdn # The hostname of this host!
enable_script_security
# Synchro of the state of the connections between the LBs on the eth0 interface
lvs_sync_daemon eth0
notification_email {
linuxadmin@notify-host.com # Email address for notifications
}
notification_email_from keepalived@server2-fqdn # The from address for the notifications
smtp_server 127.0.0.1 # SMTP server address
smtp_connect_timeout 15
}
vrrp_script haproxy {
script "killall -0 haproxy"
interval 2
weight 2
user root
}
vrrp_instance LB_VIP_QA {
virtual_router_id 50
advert_int 1
priority 50
state BACKUP
interface eth0
smtp_alert # Enable Notifications Via Email
authentication {
auth_type PASS
auth_pass testp141
}
### Commented because running on VM on VMWare
## unicast_src_ip 10.10.192.135 # Private IP address of master
## unicast_peer {
## 10.10.192.134 # Private IP address of the backup haproxy
## }
### priority 50
### state BACKUP
### interface eth0
virtual_ipaddress {
10.10.10.1 dev eth0 # The virtual IP address that will be shared betwee MASTER and BACKUP.
}
track_script {
haproxy
}
}
Download the keepalived.conf slave config here
c. Set required sysctl parameters for haproxy to work as expected
[root@server1:~]# vim /etc/sysctl.conf
#Haproxy config
# haproxy
net.core.somaxconn=65535
net.ipv4.ip_local_port_range = 1024 65000
net.ipv4.ip_nonlocal_bind = 1
net.ipv4.tcp_tw_reuse = 1
net.ipv4.tcp_max_syn_backlog = 10240
net.ipv4.tcp_max_tw_buckets = 400000
net.ipv4.tcp_max_orphans = 60000
net.ipv4.tcp_synack_retries = 3
4. Test Keepalived keepalived.conf configuration syntax is OK
[root@server1:~]# keepalived –config-test
(/etc/keepalived/keepalived.conf: Line 7) Unknown keyword 'lvs_sync_daemon_interface'
(/etc/keepalived/keepalived.conf: Line 21) Unable to set default user for vrrp script haproxy – removing
(/etc/keepalived/keepalived.conf: Line 31) (LB_VIP_QA) Specifying lvs_sync_daemon_interface against a vrrp is deprecated.
(/etc/keepalived/keepalived.conf: Line 31) Please use global lvs_sync_daemon
(/etc/keepalived/keepalived.conf: Line 35) Truncating auth_pass to 8 characters
(/etc/keepalived/keepalived.conf: Line 50) (LB_VIP_QA) track script haproxy not found, ignoring…
I've experienced this error because first time I've configured keepalived, I did not mention the user with which the vrrp script haproxy should run,
in prior versions of keepalived, leaving the field empty did automatically assumed you have the user with which the vrrp script runs to be set to root
as of RHELs keepalived-2.1.5-6.el8.x86_64, i've been using however this is no longer so and thus in prior configuration as you can see I've
set the user in respective section to root.
The error Unknown keyword 'lvs_sync_daemon_interface' is also easily fixable by just substituting the lvs_sync_daemon_interface and lvs_sync_daemon and reloading
keepalived etc.
Once keepalived is started and you can see the process on both machines running in process list.
[root@server1:~]# ps -ef |grep -i keepalived
root 1190884 1 0 18:50 ? 00:00:00 /usr/sbin/keepalived -D
root 1190885 1190884 0 18:50 ? 00:00:00 /usr/sbin/keepalived -D
Next step is to check the keepalived statuses as well as /var/log/keepalived.log
If everything is configured as expected on both keepalived on first node you should see one is master and one is slave either in the status or the log
[root@server1:~]#systemctl restart keepalived
[root@server1:~]# systemctl status keepalived|grep -i state
Mar 14 18:59:02 server1-fqdn Keepalived_vrrp[1192003]: (LB_VIP_QA) Entering MASTER STATE
[root@server1:~]# systemctl status keepalived
● keepalived.service – LVS and VRRP High Availability Monitor
Loaded: loaded (/usr/lib/systemd/system/keepalived.service; enabled; vendor preset: disabled)
Active: inactive (dead) since Mon 2022-03-14 18:15:51 CET; 32min ago
Process: 1187587 ExecStart=/usr/sbin/keepalived $KEEPALIVED_OPTIONS (code=exited, status=0/SUCCESS)
Main PID: 1187589 (code=exited, status=0/SUCCESS)
Mar 14 18:15:04 server1lb-fqdn Keepalived_vrrp[1187590]: Sending gratuitous ARP on eth0 for 10.44.192.142
Mar 14 18:15:50 server1lb-fqdn systemd[1]: Stopping LVS and VRRP High Availability Monitor…
Mar 14 18:15:50 server1lb-fqdn Keepalived[1187589]: Stopping
Mar 14 18:15:50 server1lb-fqdn Keepalived_vrrp[1187590]: (LB_VIP_QA) sent 0 priority
Mar 14 18:15:50 server1lb-fqdn Keepalived_vrrp[1187590]: (LB_VIP_QA) removing VIPs.
Mar 14 18:15:51 server1lb-fqdn Keepalived_vrrp[1187590]: Stopped – used 0.002007 user time, 0.016303 system time
Mar 14 18:15:51 server1lb-fqdn Keepalived[1187589]: CPU usage (self/children) user: 0.000000/0.038715 system: 0.001061/0.166434
Mar 14 18:15:51 server1lb-fqdn Keepalived[1187589]: Stopped Keepalived v2.1.5 (07/13,2020)
Mar 14 18:15:51 server1lb-fqdn systemd[1]: keepalived.service: Succeeded.
Mar 14 18:15:51 server1lb-fqdn systemd[1]: Stopped LVS and VRRP High Availability Monitor
[root@server2:~]# systemctl status keepalived|grep -i state
Mar 14 18:59:02 server2-fqdn Keepalived_vrrp[297368]: (LB_VIP_QA) Entering BACKUP STATE
[root@server1:~]# grep -i state /var/log/keepalived.log
Mar 14 18:59:02 server1lb-fqdn Keepalived_vrrp[297368]: (LB_VIP_QA) Entering MASTER STATE
a. Fix Keepalived SECURITY VIOLATION – scripts are being executed but script_security not enabled.
When configurating keepalived for a first time we have faced the following strange error inside keepalived status inside keepalived.log
Feb 23 14:28:41 server1 Keepalived_vrrp[945478]: SECURITY VIOLATION – scripts are being executed but script_security not enabled.
To fix keepalived SECURITY VIOLATION error:
Add to /etc/keepalived/keepalived.conf on the keepalived node hosts
inside
global_defs {}
After chunk
enable_script_security
include
# Synchro of the state of the connections between the LBs on the eth0 interface
lvs_sync_daemon_interface eth0
5. Prepare rsyslog configuration and Inlcude additional keepalived options
to force keepalived log into /var/log/keepalived.log
To force keepalived log into /var/log/keepalived.log on RHEL 8 / CentOS and other Redhat Package Manager (RPM) Linux distributions
[root@server1:~]# vim /etc/rsyslog.d/48_keepalived.conf
#2022/02/02: HAProxy logs to local6, save the messages
local7.* /var/log/keepalived.log
if ($programname == 'Keepalived') then -/var/log/keepalived.log
if ($programname == 'Keepalived_vrrp') then -/var/log/keepalived.log
& stop
[root@server:~]# touch /var/log/keepalived.log
Reload rsyslog to load new config
[root@server:~]# systemctl restart rsyslog
[root@server:~]# systemctl status rsyslog
● rsyslog.service – System Logging Service
Loaded: loaded (/usr/lib/systemd/system/rsyslog.service; enabled; vendor preset: enabled)
Drop-In: /etc/systemd/system/rsyslog.service.d
└─rsyslog-service.conf
Active: active (running) since Mon 2022-03-07 13:34:38 CET; 1 weeks 0 days ago
Docs: man:rsyslogd(8)
https://www.rsyslog.com/doc/
Main PID: 269574 (rsyslogd)
Tasks: 6 (limit: 100914)
Memory: 5.1M
CGroup: /system.slice/rsyslog.service
└─269574 /usr/sbin/rsyslogd -n
Mar 15 08:15:16 server1lb-fqdn rsyslogd[269574]: — MARK —
Mar 15 08:35:16 server1lb-fqdn rsyslogd[269574]: — MARK —
Mar 15 08:55:16 server1lb-fqdn rsyslogd[269574]: — MARK —
If once keepalived is loaded but you still have no log written inside /var/log/keepalived.log
[root@server1:~]# vim /etc/sysconfig/keepalived
KEEPALIVED_OPTIONS="-D -S 7"
[root@server2:~]# vim /etc/sysconfig/keepalived
KEEPALIVED_OPTIONS="-D -S 7"
[root@server1:~]# systemctl restart keepalived.service
[root@server1:~]# systemctl status keepalived
● keepalived.service – LVS and VRRP High Availability Monitor
Loaded: loaded (/usr/lib/systemd/system/keepalived.service; enabled; vendor preset: disabled)
Active: active (running) since Thu 2022-02-24 12:12:20 CET; 2 weeks 4 days ago
Main PID: 1030501 (keepalived)
Tasks: 2 (limit: 100914)
Memory: 1.8M
CGroup: /system.slice/keepalived.service
├─1030501 /usr/sbin/keepalived -D
└─1030502 /usr/sbin/keepalived -D
Warning: Journal has been rotated since unit was started. Log output is incomplete or unavailable.
[root@server2:~]# systemctl restart keepalived.service
[root@server2:~]# systemctl status keepalived
…
6. Monitoring VRRP traffic of the two keepaliveds with tcpdump
Once both keepalived are up and running a good thing is to check the VRRP protocol traffic keeps fluently on both machines.
Keepalived VRRP keeps communicating over the TCP / IP Port 112 thus you can simply snoop TCP tracffic on its protocol.
[root@server1:~]# tcpdump proto 112
tcpdump: verbose output suppressed, use -v or -vv for full protocol decode
listening on eth0, link-type EN10MB (Ethernet), capture size 262144 bytes
11:08:07.356187 IP server1lb-fqdn > vrrp.mcast.net: VRRPv2, Advertisement, vrid 50, prio 53, authtype simple, intvl 1s, length 20
11:08:08.356297 IP server1lb-fqdn > vrrp.mcast.net: VRRPv2, Advertisement, vrid 50, prio 53, authtype simple, intvl 1s, length 20
11:08:09.356408 IP server1lb-fqdn > vrrp.mcast.net: VRRPv2, Advertisement, vrid 50, prio 53, authtype simple, intvl 1s, length 20
11:08:10.356511 IP server1lb-fqdn > vrrp.mcast.net: VRRPv2, Advertisement, vrid 50, prio 53, authtype simple, intvl 1s, length 20
11:08:11.356655 IP server1lb-fqdn > vrrp.mcast.net: VRRPv2, Advertisement, vrid 50, prio 53, authtype simple, intvl 1s, length 20
[root@server2:~]# tcpdump proto 112
tcpdump: verbose output suppressed, use -v or -vv for full protocol decode
listening on eth0, link-type EN10MB (Ethernet), capture size 262144 bytes
11:08:07.356187 IP server1lb-fqdn > vrrp.mcast.net: VRRPv2, Advertisement, vrid 50, prio 53, authtype simple, intvl 1s, length 20
11:08:08.356297 IP server1lb-fqdn > vrrp.mcast.net: VRRPv2, Advertisement, vrid 50, prio 53, authtype simple, intvl 1s, length 20
11:08:09.356408 IP server1lb-fqdn > vrrp.mcast.net: VRRPv2, Advertisement, vrid 50, prio 53, authtype simple, intvl 1s, length 20
11:08:10.356511 IP server1lb-fqdn > vrrp.mcast.net: VRRPv2, Advertisement, vrid 50, prio 53, authtype simple, intvl 1s, length 20
11:08:11.356655 IP server1lb-fqdn > vrrp.mcast.net: VRRPv2, Advertisement, vrid 50, prio 53, authtype simple, intvl 1s, length 20
As you can see the VRRP traffic on the network is originating only from server1lb-fqdn, this is so because host server1lb-fqdn is the keepalived configured master node.
It is possible to spoof the password configured to authenticate between two nodes, thus if you're bringing up keepalived service cluster make sure your security is tight at best the machines should be in a special local LAN DMZ, do not configure DMZ on the internet !!! 🙂 Or if you eventually decide to configure keepalived in between remote hosts, make sure you somehow use encrypted VPN or SSH tunnels to tunnel the VRRP traffic.
[root@server1:~]# tcpdump proto 112 -vv
tcpdump: listening on eth0, link-type EN10MB (Ethernet), capture size 262144 bytes
11:36:25.530772 IP (tos 0xc0, ttl 255, id 59838, offset 0, flags [none], proto VRRP (112), length 40)
server1lb-fqdn > vrrp.mcast.net: vrrp server1lb-fqdn > vrrp.mcast.net: VRRPv2, Advertisement, vrid 50, prio 53, authtype simple, intvl 1s, length 20, addrs: VIPIP_QA auth "testp431"
11:36:26.530874 IP (tos 0xc0, ttl 255, id 59839, offset 0, flags [none], proto VRRP (112), length 40)
server1lb-fqdn > vrrp.mcast.net: vrrp server1lb-fqdn > vrrp.mcast.net: VRRPv2, Advertisement, vrid 50, prio 53, authtype simple, intvl 1s, length 20, addrs: VIPIP_QA auth "testp431"
Lets also check what floating IP is configured on the machines:
[root@server1:~]# ip -brief address show
lo UNKNOWN 127.0.0.1/8
eth0 UP 10.10.10.5/26 10.10.10.1/32
The 10.10.10.5 IP is the main IP set on LAN interface eth0, 10.10.10.1 is the floating IP which as you can see is currently set by keepalived to listen on first node.
[root@server2:~]# ip -brief address show |grep -i 10.10.10.1
An empty output is returned as floating IP is currently configured on server1
To double assure ourselves the IP is assigned on correct machine, lets ping it and check the IP assigned MAC currently belongs to which machine.
[root@server2:~]# ping 10.10.10.1
PING 10.10.10.1 (10.10.10.1) 56(84) bytes of data.
64 bytes from 10.10.10.1: icmp_seq=1 ttl=64 time=0.526 ms
^C
— 10.10.10.1 ping statistics —
1 packets transmitted, 1 received, 0% packet loss, time 0ms
rtt min/avg/max/mdev = 0.526/0.526/0.526/0.000 ms
[root@server2:~]# arp -an |grep -i 10.44.192.142
? (10.10.10.1) at 00:48:54:91:83:7d [ether] on eth0
[root@server2:~]# ip a s|grep -i 00:48:54:91:83:7d
[root@server2:~]#
As you can see from below output MAC is not found in configured IPs on server2.
[root@server1-fqdn:~]# /sbin/ip a s|grep -i 00:48:54:91:83:7d -B1 -A1
eth0: <BROADCAST,MULTICAST,UP,LOWER_UP> mtu 1500 qdisc mq state UP group default qlen 1000
link/ether 00:48:54:91:83:7d brd ff:ff:ff:ff:ff:ff
inet 10.10.10.1/26 brd 10.10.1.191 scope global noprefixroute eth0
Pretty much expected MAC is on keepalived node server1.
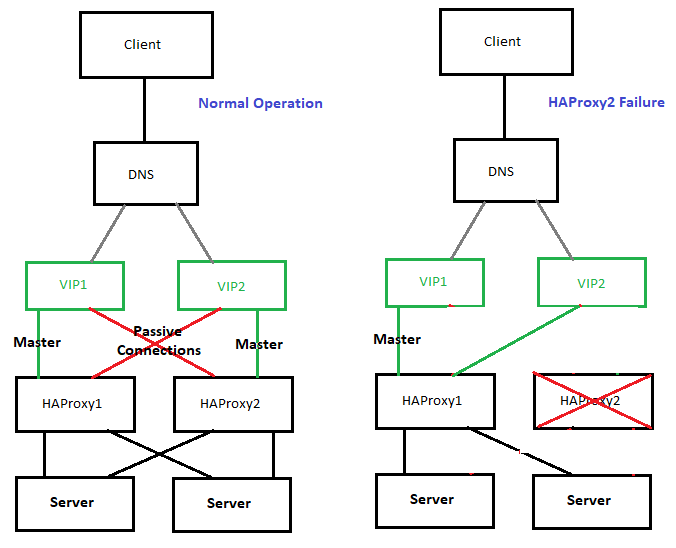
7. Testing keepalived on server1 and server2 maachines VIP floating IP really works
To test the overall configuration just created, you should stop keeaplived on the Master node and in meantime keep an eye on Slave node (server2), whether it can figure out the Master node is gone and switch its
state BACKUP to save MASTER. By changing the secondary (Slave) keepalived to master the floating IP: 10.10.10.1 will be brought up by the scripts on server2.
Lets assume that something went wrong with server1 VM host, for example the machine crashed due to service overload, DDoS or simply a kernel bug or whatever reason.
To simulate that we simply have to stop keepalived, then the broadcasted information on VRRP TCP/IP proto port 112 will be no longer available and keepalived on node server2, once
unable to communicate to server1 should chnage itself to state MASTER.
[root@server1:~]# systemctl stop keepalived
[root@server1:~]# systemctl status keepalived
● keepalived.service – LVS and VRRP High Availability Monitor
Loaded: loaded (/usr/lib/systemd/system/keepalived.service; enabled; vendor preset: disabled)
Active: inactive (dead) since Tue 2022-03-15 12:11:33 CET; 3s ago
Process: 1192001 ExecStart=/usr/sbin/keepalived $KEEPALIVED_OPTIONS (code=exited, status=0/SUCCESS)
Main PID: 1192002 (code=exited, status=0/SUCCESS)
Mar 14 18:59:07 server1lb-fqdn Keepalived_vrrp[1192003]: Sending gratuitous ARP on eth0 for 10.10.10.1
Mar 15 12:11:32 server1lb-fqdn systemd[1]: Stopping LVS and VRRP High Availability Monitor…
Mar 15 12:11:32 server1lb-fqdn Keepalived[1192002]: Stopping
Mar 15 12:11:32 server1lb-fqdn Keepalived_vrrp[1192003]: (LB_VIP_QA) sent 0 priority
Mar 15 12:11:32 server1lb-fqdn Keepalived_vrrp[1192003]: (LB_VIP_QA) removing VIPs.
Mar 15 12:11:33 server1lb-fqdn Keepalived_vrrp[1192003]: Stopped – used 2.145252 user time, 15.513454 system time
Mar 15 12:11:33 server1lb-fqdn Keepalived[1192002]: CPU usage (self/children) user: 0.000000/44.555362 system: 0.001151/170.118126
Mar 15 12:11:33 server1lb-fqdn Keepalived[1192002]: Stopped Keepalived v2.1.5 (07/13,2020)
Mar 15 12:11:33 server1lb-fqdn systemd[1]: keepalived.service: Succeeded.
Mar 15 12:11:33 server1lb-fqdn systemd[1]: Stopped LVS and VRRP High Availability Monitor.
On keepalived off, you will get also a notification Email on the Receipt Email configured from keepalived.conf from the working keepalived node with a simple message like:
=> VRRP Instance is no longer owning VRRP VIPs <=
Once keepalived is back up you will get another notification like:
=> VRRP Instance is now owning VRRP VIPs <=
[root@server2:~]# systemctl status keepalived
● keepalived.service – LVS and VRRP High Availability Monitor
Loaded: loaded (/usr/lib/systemd/system/keepalived.service; enabled; vendor preset: disabled)
Active: active (running) since Mon 2022-03-14 18:13:52 CET; 17h ago
Process: 297366 ExecStart=/usr/sbin/keepalived $KEEPALIVED_OPTIONS (code=exited, status=0/SUCCESS)
Main PID: 297367 (keepalived)
Tasks: 2 (limit: 100914)
Memory: 2.1M
CGroup: /system.slice/keepalived.service
├─297367 /usr/sbin/keepalived -D -S 7
└─297368 /usr/sbin/keepalived -D -S 7
Mar 15 12:11:33 server2lb-fqdn Keepalived_vrrp[297368]: Sending gratuitous ARP on eth0 for 10.10.10.1
Mar 15 12:11:33 server2lb-fqdn Keepalived_vrrp[297368]: Sending gratuitous ARP on eth0 for 10.10.10.1
Mar 15 12:11:33 server2lb-fqdn Keepalived_vrrp[297368]: Remote SMTP server [127.0.0.1]:25 connected.
Mar 15 12:11:33 server2lb-fqdn Keepalived_vrrp[297368]: SMTP alert successfully sent.
Mar 15 12:11:38 server2lb-fqdn Keepalived_vrrp[297368]: (LB_VIP_QA) Sending/queueing gratuitous ARPs on eth0 for 10.10.10.1
Mar 15 12:11:38 server2lb-fqdn Keepalived_vrrp[297368]: Sending gratuitous ARP on eth0 for 10.10.10.1
Mar 15 12:11:38 server2lb-fqdn Keepalived_vrrp[297368]: Sending gratuitous ARP on eth0 for 10.10.10.1
Mar 15 12:11:38 server2lb-fqdn Keepalived_vrrp[297368]: Sending gratuitous ARP on eth0 for 10.10.10.1
Mar 15 12:11:38 server2lb-fqdn Keepalived_vrrp[297368]: Sending gratuitous ARP on eth0 for 10.10.10.1
Mar 15 12:11:38 server2lb-fqdn Keepalived_vrrp[297368]: Sending gratuitous ARP on eth0 for 10.10.10.1
[root@server2:~]# ip addr show|grep -i 10.10.10.1
inet 10.10.10.1/32 scope global eth0
As you see the VIP is now set on server2, just like expected – that's OK, everything works as expected. If the IP did not move double check the keepalived.conf on both nodes for errors or misconfigurations.
To recover the initial order of things so server1 is MASTER and server2 SLAVE host, we just have to switch on the keepalived on server1 machine.
[root@server1:~]# systemctl start keepalived
The automatic change of server1 to MASTER node and respective move of the VIP IP is done because of the higher priority (of importance we previously configured on server1 in keepalived.conf).
What we learned?
So what we learned in this article?
We have seen how to easily install and configure a High Availability Load balancer with Keepalived with single floating VIP IP address with 1 MASTER and 1 SLAVE host and a Haproxy example config with few frontends / App backends. We have seen how the config can be tested for potential errors and how we can monitor whether the VRRP2 network traffic flows between nodes and how to potentially debug it further if necessery.
Further on rawly explained some of the keepalived configurations but as keepalived can do pretty much more,for anyone seriously willing to deal with keepalived on a daily basis or just fine tune some already existing ones, you better read closely its manual page "man keepalived.conf" as well as the official Redhat Linux documentation page on setting up a Linux cluster with Keepalived (Be prepare for a small nightmare as the documentation of it seems to be a bit chaotic, and even I would say partly missing or opening questions on what does the developers did meant – not strange considering the havoc that is pretty much as everywhere these days.)
Finally once keepalived hosts are prepared, it was shown how to test the keepalived application cluster and Floating IP does move between nodes in case if one of the 2 keepalived nodes is inaccessible.
The same logic can be repeated multiple times and if necessery you can set multiple VIPs to expand the HA reachable IPs solution.
The presented idea is with haproxy forward Proxy server to proxy requests towards Application backend (servince machines), however if you need to set another set of server on the flow to process HTML / XHTML / PHP / Perl / Python programming code, with some common Webserver setup ( Nginx / Apache / Tomcat / JBOSS) and enable SSL Secure certificate with lets say Letsencrypt, this can be relatively easily done. If you want to implement letsencrypt and a webserver check this redundant SSL Load Balancing with haproxy & keepalived article.
That's all folks, hope you enjoyed.
If you need to configure keepalived Cluster or a consultancy write your query here 🙂