Archive for the ‘Performance Tuning’ Category

Best Home Wi-Fi settings for Maximum Speed and Internet coverage in Europe

Tuesday, July 21st, 2026

best-home-wifi-settings-for-maximum-speed-and-internet-coverage-europe-simple-steps-to-improve-your-home-wifi-signal

A fast broadband subscription is only part of the equation to have excellent internet air connectivity configuration for a home / work Wi-Fi Internet Router.
Even if you pay for good stable gigabit fiber options connection, poor Wi-Fi configuration can reduce your real-world speeds by more than half which might make working with devices have annoying temporary slownesses or even disruptions, when exchanging data to internet.

Our modern homes are filled with smart TVs, streaming devices, gaming consoles, laptops, smartphones, and IoT devices – all competing to take over fastest and stablest connectivity to the wireless device bandwidth.
Thus optimizing Wi-Fi router connectivity settings is no longer optional but is kind oa  in year 2026.

This snall guide would covers most of the best practices for configuring a home Wi-Fi network for maximum speed, stability, and security across Europe.

1. Choose the Right Wi-Fi Standard

Your router determines the maximum performance of your wireless network.


Recommended standards:

  • Wi-Fi 6 (802.11ax): Best value for most homes
  • Wi-Fi 6E: Excellent if your devices support the new 6 GHz band
  • Wi-Fi 7: Future-proof and ideal for multi-gigabit internet connections

! Avoid, using older Wi-Fi 5 or Wi-Fi 4 equipment unless upgrading is not possible !

2. Use the Best Frequency Band

Modern routers typically broadcast multiple wireless bands.


2.4 GHz Advantages:

  • Longer range
  • Better wall penetration
  • Disadvantages:
  • Lower speeds
  • More interference
  • Congested in apartments


2.4GHz Ideal for:

  • Smart home devices
  • Printers
  • Cameras

5 GHz Advantages:


  • Higher throughput
  • Lower latency
  • Less interference
  • Ideal for:
  • Streaming
  • Gaming
  • Video conferencing
  • Workstations


6 GHz (Wi-Fi 6E / Wi-Fi 7) Advantages:


  • Extremely low interference
  • Highest available speeds
  • Very low latency


6Ghz Wifi is usual use is:

With most modern Devices, such as (IoT connected devices, Wifi Gaming PCs, High-performance laptops, For large files transfer), tech quipment that looking for best Internet connectivity via air.. 

3. Position Your Router Correctly

best-wifi-router-placement-location-position-your-wireless-router-correctly-for-optimial-internet-air-speed

Router placement has a greater impact than many people realize.

Best practices for Router Positioning:

  • Place the router near the center of your home.
  • Position it on a shelf or table rather than on the floor.
  • Avoid placing it inside cabinets.
  • Keep it away from large metal objects.
  • Maintain distance from microwaves and cordless phones.
  • Keep antennas vertical unless the manufacturer recommends otherwise.
  • In multi-story homes, position the router between floors whenever possible.

4. Select the Best Wireless Channel

Channel congestion is one of the biggest causes of slow Wi-Fi.

For Europe (European Union countries):

For 2.4 GHz Wifi;

Use signal spread only:

  • Channel 1
  • Channel 6
  • Channel 11


These channels minimize overlap.

For 5 GHz;


Enable automatic channel selection or manually choose a channel with low congestion using a Wi-Fi analyzer.

5. Use the Correct Channel Width

For 2.4 GHz WiFi


Use:
+ 20 MHz
Avoid:
– 40 MHz unless there are very few neighboring networks.

For 5 GHz

Recommended:
+ 80 MHz
+ Use 160 MHz only if:
+ Few neighboring networks exist
+ Your devices support it

For 6 GHz

Use:
160 MHz or wider when available.

6. Enable WPA3 Security


Best WPA3 selection:

WPA3-Personal


For older devices require Backwards compatibility (keep enabled):
WPA2/WPA3 Mixed Mode

Avoid:
– WEP
– WPA
– Open networks
– Strong security helps prevent unauthorized users from consuming bandwidth.


7. Separate IoT Devices in different network

Many smart home devices generate unnecessary wireless traffic.
Create seperate networks for:

  • Main networ
  • Guest network
  • IoT network

This improves performance and enhances security.

8. Enable OFDMA and MU-MIMO

Modern Wi-Fi 6 routers support technologies that improve efficiency.
OFDMA

Allows multiple devices to share wireless resources efficiently.
MU-MIMO
Enables simultaneous communication with multiple devices.

Both should remain enabled.

9. Update Router Firmware

Manufacturers regularly release updates that improve the Performance, Security, Stability, Compatibility.
As script kiddie "hackers" threaths raise seriously day by day, when possible always, do:

  • Enable automatic firmware updates whenever possible.

10. Use Quality of Service (QoS)


Use the router to QoS prioritizes important traffic
Usual candidates for higher priorty internet traffics configs are:

  • Streaming, Work VPN traffic
  • Gaming, Video calls


Se as Lower priority ones :

  • Downloads
  • Cloud automated backups, etc.

11. Disable Legacy Wi-Fi Modes


Older compatibility modes, has advantages for interoperability but does reduce network efficiency, so most people would like to disable it.

Disable wifi mode transmission:

– 802.11b
– 802.11g


For Performance use instead the newer transmissions:

+ 802.11n
+ 802.11ac
+ 802.11ax

12. Always Prefer Wired Connections for High-Bandwidth Devices

alwayes-prefer-wired-connections-for-high-bandwidth-devices-cable-network-connection-should-be-always-first-choice

Connect these devices via Ethernet whenever possible:

  • NAS systems (Storages), Desktop PCs (most important candidates for UTP connectivity)
  • Gaming consoles, Smart TVs, Streaming boxes (secondary but also important to not disrupt your fun time)


Note !:
 Every cable connected device would have possible impact on any other connected Wi-Fi devices such as Mobile phones.
Every wired device reduces wireless congestion!

13. Use Mesh Wi-Fi for large sized sq. meter homes

If your home exceeds approximately 150–200 m² or has multiple floors, consider a mesh Wi-Fi system instead of relying on a single router.


Benefits includes:

  • Better coverage
  • Seamless roaming
  • Higher overall speeds
  • Reduced dead zones

14. Monitor Network Usage


Many routers provide tools to identify bottlenecks. Some common ones are

  • Bandwidth-heavy devices, Weak connections


    Review these statistics as regular as possible to optimize your network and have decent internet connectivty.

  • Congested channels, Signal quality issues

15. Understand European Wi-Fi Regulations

European countries follow ETSI regulations for wireless spectrum.
Most routers sold in Europe automatically comply with regional requirements, including:

Permitted transmit power, DFS (Dynamic Frequency Selection), follow approved set wireless channels.

! Avoid changing the router's region setting, as this may violate local regulations and reduce compatibility. !

Example Configuration for a Modern European Home (Recommended Value Settings)
 

  1. Wi-Fi Standard    Wi-Fi 6 or newer
  2. Security    WPA3-Personal
  3. 2.4 GHz Channel    1, 6, or 11
  4. 2.4 GHz Width    20 MHz
  5. 5 GHz Width    80 MHz
  6. 6 GHz Width    160 MHz (if supported)
  7. Firmware    Automatic updates enabled
  8. QoS    Enabled
  9. OFDMA    Enabled
  10. MU-MIMO    Enabled
  11. Smart Connect    Enabled unless manual band control is preferred
  12. DNS    ISP, Cloudflare (1.1.1.1), or Google Public DNS (8.8.8.8)


Common mistakes to avoid


  • Placing the router inside a cabinet.
  • Using outdated firmware.
  • Running all devices on the 2.4 GHz band.
  • Selecting crowded wireless channels.
  • Leaving the default administrator password unchanged.
  • Using Wi-Fi extenders instead of a proper mesh system in large homes.
  • Connecting high-bandwidth devices wirelessly when Ethernet is available.

Conclusion

Optimizing a home Wi-Fi network involves more than purchasing a fast router. Proper placement, choosing the right frequency bands, selecting appropriate channels, keeping firmware updated, and enabling modern Wi-Fi features such as OFDMA and MU-MIMO can significantly improve speed, reliability, and coverage.
For most European households, a centrally located Wi-Fi 6 router configured with WPA3 security, 80 MHz channels on the 5 GHz band, and Ethernet connections for high-bandwidth devices provides an excellent balance of performance, security, and future readiness.

Why modern Linux systems feel Slow and how to Speed it up. Common RAM, CPU, and performance Linux problems in 2026 explained

Monday, May 18th, 2026

For years Linux we the Linux users proudly mocked Windows for bloated resource usage and that was a reason for many enthusiasts like me to start in the Linux realm.
There used to be the good old times where, lightweight distributions running comfortably inside 128MB of RAM were once common, and old computers and the hackers good old ThinkPads series were perfect for becoming a computer professional.

Fast-forward trip to 2026 and many modern GNU / Linux desktop's resource hunger has topped UP and a typical GUI environment such as Gnome is consuming as minimum 2 GB of RAM and often  4GB of RAM immediately after enters through the Login manager and machine. So many of the old computers if even running for 7-8 years and served well once updated or reused with Linux on a fresh install  prformance feels really bad. There of course work arounds to that as there are distributions such PuppyLinux / Tiny Core Linux / Linux Lite / Lubutuntu and even multiple articles online suggesting on how to place an ordinary Debian on Ubuntu and optimize it to work better on older hardware but still this article might be of help not only for old school Linux fans who install on old harware but also for sysadmins who has to deploy and install brand new Linux distributions and want to squeeze best of performance from the machine and make it as minimimalistic as possible in order to reduce the number of problems that might occur for system management.

So What happened, to make Linux performance degrade so dramatically over last 15 years ?

Old Hardware feels Slower Even With Linux

People often install Linux expecting miracles on ancient hardware.

Modern workloads assume:

  • SSD storage
  • multiple CPU cores
  • AVX instructions
  • GPU acceleration
  • large memory pools

Even lightweight Linux distributions struggle when rendering modern web applications on decade-old CPUs.

A 2007 machine browsing modern JavaScript-heavy websites experiences a fundamentally different workload than it did originally.

Web site use became computationally expensive.


Modern Linux Is Carrying the Weight of the development of Tech and Internet industry

A contemporary Linux desktop is no longer just:

  • X11
  • a window manager
  • a browser
  • a terminal emulator

Modern systems now run dozens of background services (as people run into complexity more and more instead of minimalism). Even a basic Linux install often runs by default things such as:
telemetry collectors, hardware abstraction layers, sandboxing frameworks, package management daemons, web server management platforms, indexing systems, GPU compositors, browser engines that resemble miniature operating systems and even with some specific distros embedded containers.

A typical desktop session environment on Linux today often includes as a base a bunch of software that is not always necessery such as:

  • systemd
  • dbus-daemon
  • pipewire
  • wireplumber
  • NetworkManager
  • xdg-desktop-portal
  • gvfsd
  • tracker-miner
  • udisksd
  • polkitd
  • bluetoothd
  • ModemManager
  • cupsd
  • flatpak-session-helper

Many younger users won't  never notice the burden of having those services running all time on the hardware as hardware today is mostly powerful and modern PC and notebooks often ship with 16GB or even some gaiming machines have 32 GB of memory.

As the default amount of memory on a laptop PC has become so abundant as 16GB RAM has become  "normal / standard ",  so software developers stopped aggressively optimizing memory consumption, plus the inclusing of AI vibe coding today and the abundant resource makes things with program optimization even more bloated.

The result of all this is more and more software entropy (the tendency of software systems to become more disorganized, complex, and harder to maintain over time).

The older UNIX philosophy no longer remembered by newer developers is completely forgotten. The old unix thinking was "Do one thing well.",
the new is "use everything no matter the efficiency if that would save you time"

As a result modern desktop applications instead ship entire browser engines for  simple things as displaying buttons.
This is exactly where Linux desktop gets heavily loaded and cause for whole system to work sluggish even on newer hardware. 
Very large part of those ineffiicient developed is caused by Electron:

Electron Framework for building Desktop apps worsened Linux performance

One of the largest reasons modern Desktop Linux / Windows systems is Electron (a framework for building desktop applications using JavaScript, HTML, and CSS).

Electron bundles essentially with:

  • Chromium
  • Node.js
  • V8 JavaScript engine
  • application runtime
  • UI rendering engine

and this is used in …inside many of the third party applications, which unfurtunately has to be used also on Linux, few examples that has heavy electron use are:

  • Discord client
  • Slack client
  • VS Code
  • Element 
  • Spotify
  • Visual Studio Code
  • Discord
  • Signal Desktop
  • Postman
  • Countless App launchers part of extra packages that one needs to use on Linux Desktop

…are frequently separate Chromium instances or use large part of chromium libs pretending to be native applications.

1. Finding top resource hungry Apps on Linux

To get a list of most memory heavy Apps on a Linux system:

# ps aux –sort=-%mem | head


You may discover that “lightweight desktop apps” and background services are consuming much more RAM than imagined.

Measuring Real Resource Usage Properly

Many users misunderstand Linux memory reporting.

Linux aggressively uses RAM for:

  • filesystem cache
  • buffers
  • inode caching

Note! Unused RAM is wasted RAM.

# free -h

Focus on:

  • available memory
  • swap activity
  • sustained pressure

Better command tools to optimize OS include:

htop
btop
smem
iotop
vmstat

Systemd  Useful but running default unused services

Mentioning systemd still starts wars on Linux forums.

Reality is nuanced.

Systemd solved real problems:

  • dependency management
  • predictable service startup
  • cgroup integration
  • journal logging
  • parallel boot
  • service supervision

However, it also dramatically expanded the scope of PID 1 responsibilities.

Leading to many Linux-es to now launch numerous services laying around, not known by the users and never (intially needed).

If you want to check and optimize systemd ecosystem to improve performance

2. Check systemd OS boot chain and disable unnecessery services

# systemd-analyze blame

And inspect active systemd units:

# systemctl list-units –type=service

Many Linux distributions has by default setup of unused:

  • printer services on systems without printers
  • modem services on desktops without modems
  • Bluetooth stacks on machines without Bluetooth devices
  • indexing daemons nobody uses

Disable unnecessary services carefully:

sudo systemctl disable –now ModemManager
sudo systemctl disable –now bluetooth
sudo systemctl disable –now cups


This alone will reduce memory usage and boot time.
A common set of unused Apps on Desktop and servers goes like this:
 

# Printing system (disable if you never use printers)

# systemctl disable –now cups.service cups-browsed.service

# Bluetooth support (disable if you don’t use Bluetooth devices)

# systemctl disable –now bluetooth.service

# Mobile broadband / modem support (disable if no 4G / 5G dongles)

# systemctl disable –now ModemManager.service

# Network discovery (AirPrint, LAN service discovery; disable if not needed)

# systemctl disable –now avahi-daemon.service

# Location services for apps/browser geolocation (disable if not used)

# systemctl disable –now geoclue.service

# Ubuntu crash reporting services (safe to disable for privacy/no reporting)

# systemctl disable –now apport.service whoopsie.service

# Desktop search indexing (GNOME file search; disable if you don’t use fast search)

# systemctl disable –now tracker-miner-fs.service tracker-extract.service tracker-store.service


For deeper analysis check out systemd cg groups use:

# systemd-cgtop

Or inspect slab allocator usage:

slabtop


3. Avoid using Flatpak and Snap for extra Apps

Flatpak and Snap Increase Isolation, provides many modern Apps that are not default shipped by Debian / Ubuntu / Fedora OS  etc (Deb / RPM) repos and keeps packages easily at latest but also puts great worthless overhead on system.
 

a) Modern packaging systems like Flatpak and Snap (Pros) prioritize:

  • sandboxing
  • dependency isolation
  • reproducibility
  • cross-distribution compatibility

This is good for security, however it comes at a cost.

b) Use of Flatpak and Snap pack. managers downsides

Flatpak applications frequently duplicate:

  • runtimes
  • libraries
  • graphics stacks
  • helper services

Snap packages compress applications into loop-mounted filesystem images which increase startup overhead and general memory fragmentation.

Inspect mounted Snap filesystems

# mount | grep snap


Inspect Flatpak runtimes:

# flatpak list


Considering that, traditional native packages remain significantly leaner in many cases.

4. Use Minimalistic GUI Desktop environment to reduce resource and use of complexity on Linux

Being mimimalist nowadays in a world of abundancy is considered wrong. However minimalism has its well known provent benefits. 

Wayland Is Efficient,  but X11 env with Minimalist GUI is better

Wayland itself is not inherently bloated.

However, modern compositors increasingly rely on:

  • GPU acceleration
  • animation pipelines
  • texture buffering
  • fractional scaling
  • HDR rendering
  • Vulkan / OpenGL abstractions

This improves:

  • smoothness
  • latency
  • security
  • multi-monitor support

…but increases baseline GPU and memory usage and still for performance cautious desktop users it is most likely not the best option.

For example, try to compare CPU / Mem / Disk use of:

  • Openbox on X11
  • KDE Plasma on Wayland with effects enabled

The performance difference is dramatic.


If you want to be a Linux Minimalist (benefit) and get astonishingly low resource usage try:

  • dwm
  • i3
  • bspwm
  • Openbox
  • Wmaker
  • XFCE
  • IceWM

Switching to one of those Linux ecosystem instead of the default heavy GNOME or KDE permits even further optimizations on Graphical environment level,  if users intentionally choose it. The downsides of that is twitching it will take you usually longer but if you setup one and the same desktop with the basic minimalist environment and you keep using it for daily work / development for years, invested time is worth.

5. Use browser extensions, habits or a lightweight  browser. 

Web browser a common source of slowness 

Web Browsers, became nowadays a fully featured Operating Systems. On many machines they are the largest consumers of RAM on Linux systems and on old computers main source of slowness. On older PCs try to use other small browser alternatives

A single browser tab may include:

  • isolated sandbox process
  • JavaScript runtime
  • GPU process
  • extension subsystem
  • video decoder
  • site isolation sandbox
  • service workers

a) Inspect Chromium process trees

# ps -ef | grep chromium

b) Inspect Firefox process trees

about:processes


A few “simple” tabs can easily consume several gigabytes.

The modern web itself is bloated:

  • gigantic JavaScript frameworks
  • endless analytics
  • autoplay video
  • AI scripts
  • tracking engines
  • real-time rendering

Shamefully, many websites today consume more RAM than entire operating systems from the early 2000s.

If you have to work on a PC with 4 or 8 GB with Linux maybe you can try to use a GUI browser only when necessery and for general reading and stuff use a minimalist version of browsers such as using a text / console web  browser and ones that are capable to support ncurses and javascript partially, a good candidate for a real console maniac or an old school hacker will be some of below:

  • Lynx (lightest, pure text)
  • w3m (text browser but supports javascripts partially)
  • Links / Links2 (fast, ultra-lightweight web browser works in both text and gui modes)
    NetSurf (graphical web browser built from scratch with its own independent layout and rendering engine, performs poor with javascript)
  • Browsh (can be often used instead of fully functional browser but buggy)

xlinks2-graphical-mode-lightweight-browser-linux

c) Use Lightweight Browsing Habits

Extensions matter enormously.

Block:

  • ads
  • trackers
  • autoplay
  • unnecessary scripts

uBlock Origin (free and open source browser block extension) alone can dramatically reduce CPU and RAM consumption.

Final words; the modern computing efficiency degredal

What a paradox, Modern hardware is unbelievably powerful, yet modern software consumes resources at almost the same rate hardware improves.

This phenomenon is partially explained by:abstraction layers, developer convenience, use of cross-platform frameworks, increased security isolation, the web technologies heaviness and reduced optimization pressure.

Even though the degredal in perforamance on old hardware, Linux itself remains extremely efficient at the kernel level.

The bloat largely exists and widens though in:

  • userland
  • desktop ecosystems
  • browser-centric software culture
     

The computing as we know it changed.

What once was: terminal-centric, native, lightweight,locally optimized, inter-dependent

turned over  last 10 years: browser-centricm, all time cloud-connected, sandboxed, abstraction-heavy, outer dependent

The good news is that GNU / Linux still gives users freedom, even though the freedom has reduced.

Even though the performance reduced,  Linux still remains one of the few environments where users retain meaningful control over their data and system complexity in the AI, Clouds era


Why SSH Login Is Slow on Linux and How to Fix It

Thursday, December 18th, 2025

openssh_debug-and-fix-slow-connections-to-linux-how-to-original-openssh-logo

Slow SSH logins are one of those problems that don’t look serious at first — until you realize every connection takes 20–30 seconds to respond. The shell eventually appears, but the delay is long enough to break automation, frustrate users, and make admins suspicious of deeper system issues.

This article walks through some common causes of slow SSH logins and how to diagnose them efficiently on Linux servers.

1. DNS Lookups: The Most Common Culprit

By default, sshd performs a reverse DNS lookup on the connecting IP address. If DNS is misconfigured or unreachable, SSH will wait.

How to Test

From the server (measure how many seconds it takes to do ssh to the machine):
 

$ time ssh localhost

If localhost logins are instant but remote logins are slow, suspect DNS.

Check /etc/ssh/sshd_config:

UseDNS yes

Fix

Disable DNS lookups (at least temporary to test):

UseDNS no

Then restart SSH:

# systemctl restart sshd

Note: This does not reduce security in most environments and is safe for the majority of servers.

2. Broken or Slow PAM Modules

PAM (Pluggable Authentication Modules) can introduce delays — especially if modules depend on:

  • LDAP
  • Kerberos
  • Network home directories
  • Smart card services

Debug with Verbose SSH

From the client:

$ ssh -vvv user@remote-server

Look for pauses during:

debug1: Authentications that can continue:

Test PAM Delay

Temporarily disable PAM in /etc/ssh/sshd_config:

UsePAM no

Restart SSH and test again.
If login becomes instant, inspect /etc/pam.d/sshd.

3. Entropy Shortage on Virtual Machines

Older kernels or low-activity VMs can run out of entropy, causing SSH key operations to block.

Check Entropy Level

# cat /proc/sys/kernel/random/entropy_avail

Values below 100 may cause delays.

Fix

Install an entropy daemon (if on Deb based distro):

# apt install haveged

or on CentOS / RHEL / Fedora

# yum install rng-tools

Then start the service:

# systemctl enable –now haveged

4. GSSAPI Authentication Delay

SSH attempts Kerberos authentication even when not used.

Symptom

Delay occurs before password prompt appears.

Fix

Edit /etc/ssh/sshd_config:

GSSAPIAuthentication no

GSSAPICleanupCredentials no

Restart SSH afterward.

5. Slow Home Directory or Shell Initialization

Sometimes SSH is fast, but the shell is slow.

Test with a Minimal Shell

$ ssh user@server /bin/sh

If this is instant, check:

  • .bashrc
  • .profile
  • .bash_logout

Common mistakes:

  • Network calls (curl, wget)
  • Mounted NFS home directories
  • Broken PATH exports
  • Commands waiting on unavailable resources

6. Logging and Timing the Login Process

Enable SSH debug logging in /etc/ssh/sshd_config:

LogLevel DEBUG

Then watch logs:

# journalctl -u sshd -f

or:

# tail -f /var/log/auth.log

This allows you to see exactly where the delay happens.

7. A Systematic Troubleshooting Checklist

  1. Disable DNS lookups (UseDNS no)
  2. Disable GSSAPI
  3. Test PAM
  4. Check entropy
  5. Test minimal shell
  6. Review auth logs

In practice, 90% of slow SSH issues are DNS or PAM related.

Conclusion

But wait there might be much more behind the SSH slowness such as misconfigured LDAP or other infrastructure in the middle.
Slow SSH logins are rarely “just SSH.", and though this guide should help you with some sporadic random server issues, if the issues is present on a complex infra with multiple ssh servers, then  that is almost always a symptom of:

  • Network misconfiguration
  • Over-engineered authentication
  • Broken assumptions about system dependencies

Approaching the problem methodically saves hours of guesswork and restores what SSH is supposed to be, work without glitches.

How to boost Linux Server Speed with tmpfs and few smart Optimization tweaks

Monday, October 20th, 2025

speed-up-accelerate-wordpress-joomla-drupal-cms-and-mysql-server-with-tmpfs_ramfs_decrease-pageload-times-with-ram-caching.png

If you’ve ever managed a busy Linux server, you’ve probably noticed how I/O bottlenecks can make your system feel sluggish – even when CPU and memory usage look fine. I recently faced this problem on a Debian box running Nginx, PHP-FPM, and MySQL / MariaDB. The fix turned out to be surprisingly simple: using tmpfs for temporary directories and tweaking a few kernel parameters.

1. Identify the resource issue Bottleneck

Running iostat -x 1 showed my /var/lib/mysql drive constantly pegged at 100% utilization, while CPU load stayed low. Classic disk-bound performance issue.

I checked swap usage:

# swapon –show

# free -h

The system was swapping occasionally — not good for performance-critical workloads.

2. Use tmpfs for Cache and Temporary Files

Linux allows you to use part of your RAM as a fast, volatile filesystem. Perfect for things like cache and sessions.

I edited /etc/fstab and added:

tmpfs   /tmp            tmpfs   defaults,noatime,mode=1777,size=1G  0  0

tmpfs   /var/cache/nginx tmpfs  defaults,noatime,mode=0755,size=512M 0 0

Then:

# mount -a

Immediately, I noticed fewer disk I/O spikes. Nginx’s cache hits were lightning-fast, and PHP temporary files were written in memory instead of SSD.

3. Tune Kernel Parameters

Adding these lines to /etc/sysctl.conf helped reduce swapping and improve responsiveness:

vm.swappiness=10

vm.vfs_cache_pressure=50

Then apply:

# sysctl -p

4. Use tmpfs for MySQL / MariaDB tmpdir (Optional)

If you have enough RAM, move MySQL’s temporary directory to tmpfs:

# mkdir -p /mnt/mysqltmp

# mount -t tmpfs -o size=512M tmpfs /mnt/mysqltmp

# chown mysql:mysql /mnt/mysqltmp

Then set in /etc/mysql/my.cnf: / /etc/mysql/mariadb.cnf

tmpdir = /mnt/mysqltmp

This dramatically speeds up large sorts and temporary table creation.

5. Monitor the Effects and tune up if necessery

After applying these changes, iostat showed disk utilization dropping from 95% to under 20% under the same workload.
Average response times from Nginx dropped by around 30–40%, and the server felt much more responsive.
However other cases might be different so it is a good idea to play around with tmpfs side according to your CPU / Memory system parameters etc. and find out the best values that would fit your Linux setup best.

Short rephrasal

tmpfs is one of those underused Linux features that can make a real-world difference for sysadmins and self-hosters. Just remember that data in tmpfs disappears after reboot, so only use it for volatile data (cache, temp files, etc.).

If you’re running a VPS or small dedicated box and looking for a quick, low-cost performance boost — give tmpfs a try. You might be surprised how much smoother your system feels.


Optimizing Linux Server Performance Through Digital Minimalism and Running Services and System Cleanup

Friday, October 3rd, 2025

linux-logo-optimizing-linux-server-performance-digital-minimalism-software-cleanup

In today’s landscape of bloated software stacks, automated dependency chains, and background services that consume memory and CPU without notice, Linux system administrators and enthusiasts alike benefit greatly from embracing digital minimalism of what is setup on the server and to reduce it to the absolute minimum.

Digital minimalism in the context of Linux servers means removing what you don't need, disabling what you don't use, and optimizing what remains — all with the goal of increasing performance, improving security, and simplifying further maintenance.
In this article, we’ll walk through practical steps to declutter your Linux server, optimize resources, and regain control over what’s running and why.

1. Identify and Remove Unnecessary Packages

Over time, many systems accumulate unused packages — either from experiments, dependency installations, or unnecessary defaults.

On Debian/Ubuntu

Find orphaned packages:
 

# apt autoremove --dry-run


Remove unnecessary packages:
 

# apt autoremove
# apt purge <package-name>


List large installed packages:

# dpkg-query -Wf '${Installed-Size}\t${Package}\n' | sort -n | tail -n 20


On RHEL/CentOS/AlmaLinux:

Find orphaned packages:

# dnf autoremove

List packages sorted by size:

# rpm -qia --qf '%{SIZE}\t%{NAME}\n' | sort -n | tail -n 20


2. Audit and Disable Unused Services
 

Every running service consumes memory, CPU cycles, and opens potential attack surfaces.

List enabled services:
 

# systemctl list-unit-files --type=service --state=enabled

See currently running services:

# systemctl --type=service –state=running

Put some good effort to review and disable all unnecesssery


Disable unneeded services :

# systemctl disable --now bluetooth.service
# systemctl disable --now cups.service
# systemctl disable --now ModemManager.service

And so on

Useful services to disable (if unused):
 

Service

Purpose

When to Disable

cups.service

Printer daemon

On headless servers

bluetooth.service

Bluetooth stack

On servers without Bluetooth

avahi-daemon

mDNS/Zeroconf

Not needed on most servers

ModemManager

Modem management

If not using 3G/4G cards

NetworkManager

Dynamic net config

Prefer systemd-networkd for static setups


Simple Shell Script to List & Review Services
 

#!/bin/bash
echo "Enabled services:"
systemctl list-unit-files --state=enabled | grep service
echo ""
echo "Running services:"
systemctl --type=service --state=running

3. Optimize Startup and Boot Time

Analyze system boot performance:

# systemd-analyze

View which services take the longest:

# systemd-analyze blame

min 25.852s certbot.service
5min 20.466s logrotate.service
1min 29.748s plocate-updatedb.service
     54.595s php5.6-fpm.service
     43.445s systemd-logind.service
     42.837s e2scrub_reap.service
     37.915s apt-daily.service
     35.604s mariadb.service
     31.509s man-db.service
     27.405s systemd-journal-flush.service
     18.357s ifupdown-pre.service
     14.672s dev-xvda2.device
     13.523s rc-local.service
     11.024s dpkg-db-backup.service
      9.871s systemd-sysusers.service

...


Disable or mask long-running services that are not essential.


Why services masking is important?


Simply because after some of consequential updates, some unwanted service daemon might start up with the system boot.

Example:
 

# systemctl mask lvm2-monitor.service


4. Reduce Memory Usage (Especially on Low-RAM VPS)
 

Monitor memory usage:

# free -h
# top
# htop

Use lightweight alternatives:

Service

Heavy

Lightweight Alternative

Web server

Apache

Nginx / Caddy / Lighttpd

Database

MySQL

MariaDB / SQLite (if local)

Syslog

rsyslog

busybox syslog / systemd journal

Shell

bash

dash / ash

File manager

GNOME Files

mc / ranger (CLI)


5. Configure Swap (Only If Needed)
 

Having too much or too little swap can affect performance.


Check if swap is active:

# swapon --show


Create swap file (if needed):

# fallocate -l 1G /swapfile
# chmod 600 /swapfile
# mkswap /swapfile
# swapon /swapfile

Add to /etc/fstab for persistence:

/swapfile none swap sw 0 0

6. Clean Up Cron Jobs and Timers

Old scheduled tasks can silently run in the background and consume resources.

List user cron jobs:

crontab -l

Check system-wide cron jobs:

# ls /etc/cron.*

# ls -al /var/spool/cron/*


List systemd timers:

# systemctl list-timers


Disable any unneeded timers or outdated cron entries.

7. Optimize Logging and Log Rotation

Logs are essential but can grow large and fill up disk space quickly.

Check log size:

# du -sh /var/log/*

Force logrotate:
 

# logrotate -f /etc/logrotate.conf

Edit /etc/logrotate.conf or specific files in /etc/logrotate.d/* to reduce retention if needed.

8. Check for Zombie Processes and Old Users

Old users and zombie processes can indicate neglected cleanup or the server is (cracked) hacked.

List users:
 

cat /etc/passwd | cut -d: -f1

Remove unused accounts:
 

# userdel -r username


Check for zombie processes:
 

# ps aux | awk '{ if ($8 == "Z") print $0; }'

9. Disable IPv6 (if not used)

IPv6 can add unnecessary complexity and attack surface if you’re not using it.

To disable IPv6 temporarily:

# sysctl -w net.ipv6.conf.all.disable_ipv6=1
# sysctl -w net.ipv6.conf.default.disable_ipv6=1

To disable permanently, add to /etc/sysctl.conf:

net.ipv6.conf.all.disable_ipv6 = 1
net.ipv6.conf.default.disable_ipv6 = 1


10. Final Thoughts: Less Is More

Digital minimalism is not just a personal tech trend — it's a philosophy of clarity, performance, and security. Every running process is a potential vulnerability. Every megabyte of RAM consumed by a useless service is wasted capacity. Every package installed increases the system’s complexity.

By regularly auditing, pruning, and simplifying your Linux server, you not only improve its performance and reliability, but you also reduce future maintenance headaches.

Minimalism = Maintainability.

Linux extending life time for a damaged hard drive server tricks on a live server. Force fcsk on next reboot.Read-only file system error solutions

Friday, February 17th, 2023

linux-extending-life-time-for-a-damaged-hard-drive-server-tricks-can-not-read-superblock-linux-force-fsck-on-next-reboot

In our daily work as system administrators we have some very old Legacy systems running Clustered High Availability proxies using CRM (Cluster Resource Manager) and some legacy systems still using Heartbeat to manage the cluster instead of the newer and modern Corosync variant.

The HA cluster is only 2 nodes Linux machine and running the obscure already long time unsupported version of Redhat 5.11 (Ootpa) who was officially became stable distant year 1998 (yeath the years were good) and whose EOL (End of Life) has been reached long time ago and the OS is no longer supported, however for about 14 years the machines has been running perfectly fine until one of the Cluster nodes managed by ocf::heartbeat:IPAddr2 , that is  /etc/ha.d/resource.d/IPAddr2 shell script. Yeah for the newbies Heartbeat Application Cluster in Linux does work like that it uses a number of extendable pair of shell scripts written for different kind of Network / Web / Mail / SQL or whatever services HA management.

The first node configured however, started failing due to some errors like:
 

EXT3-fs error (device dm-1): ext3_journal_start_sb: Detected aborted journal
sd 0:2:0:0: rejecting I/O to offline device
Aborting journal on device sda1.
sd 0:2:0:0: rejecting I/O to offline device
printk: 159 messages suppressed.
Buffer I/O error on device sda1, logical block 526
lost page write due to I/O error on sda1
sd 0:2:0:0: rejecting I/O to offline device
ext3_abort called.
EXT3-fs error (device sda1): ext3_journal_start_sb: Detected aborted journal
Remounting filesystem read-only
sd 0:2:0:0: rejecting I/O to offline device
megaraid_sas: FW was restarted successfully, initiating next stage…
megaraid_sas: HBA recovery state machine, state 2 starting…
megasas: Waiting for FW to come to ready state
megasas: FW in FAULT state!!
FW state [-268435456] hasn't changed in 180 secs
megaraid_sas: out: controller is not in ready state
megasas: waiting_for_outstanding: after issue OCR. 
megasas: waiting_for_outstanding: before issue OCR. FW state = f0000000
megaraid_sas: pending commands remain even after reset handling. megasas[0]: Dumping Frame Phys Address of all pending cmds in FW
megasas[0]: Total OS Pending cmds : 0 megasas[0]: 64 bit SGLs were sent to FW
megasas[0]: Pending OS cmds in FW :

The result out of that was a frequently the filesystem of the machine got re-mounted as Read Only and of course that is
quite bad if you have a running processess of haproxy that should be able to be living their and take up some Web traffic
for high availability and you run all the traffic only on the 2nd pair of machine.

This of course was a clear sign for a failing disks or some hit bad blocks regions or as the messages indicates, some
problem with system hardware or Raid SAS Array.

The physical raid on the system, just like rest of the hardware is very old stuff as well.

[root@haproxy_lb_node1 ~]# lspci |grep -i RAI
01:00.0 RAID bus controller: LSI Logic / Symbios Logic MegaRAID SAS 2108 [Liberator] (rev 05)

The produced errors not only made the machine to auto-mount its root / filesystem in Read-Only mode but besides has most
likely made the machine to automatically reboot every few days or few times every day in a raw.

The second Load Balancer node2 did operated perfectly, and we thought that we might just keep the broken machine in that half running
and inconsistent state for few weeks until we have built the new machines with Pre-Installed new haproxy cluster with modern
RedHat Linux 8.6 distribution, but since we have to follow SLAs (Service Line Agreements) with Customers and the end services behind the
High Availability (HA) Haproxy cluster were at danger … 

We as sysadmins had the task to make our best to try to stabilize the unstable node with disk errors for the system to servive
and be able to normally serve traffic (if node2 that is in a separate Data center fails due to a hardware or electricity issues etc.)
.

Here is few steps we took, that has hopefully improved the situation.

1. Make backups of most important files of high importance

Always before doing anything with a broken system, prepare backup of the most important files, if that is a cluster that should be a backup of the cluster configurations (if you don't have already ones) backup of /etc/hosts / backup of any important services configs /etc/haproxy/haproxy.cfg /etc/postfix/postfix.cfg (like it was my case), preferrably backup of whole /etc/  any important files from /root/ or /home/users* directories backup of at leasts latest logs from /var/log etc.
 

2. Clear up all unnecessery services scripts from the server

Any additional Softwares / Services and integrity checking tools (daemons) / scripts and cron jobs, were immediately stopped and wheter unused removed.

E.g. we had moved through /etc/cron* to check what's there,

# ls -ld /etc/cron.*
drwx—— 2 root root 4096 Feb  7 18:13 /etc/cron.d
drwxr-xr-x 2 root root 4096 Feb  7 17:59 /etc/cron.daily
-rw-r–r– 1 root root    0 Jul 20  2010 /etc/cron.deny
drwxr-xr-x 2 root root 4096 Jan  9  2013 /etc/cron.hourly
drwxr-xr-x 2 root root 4096 Jan  9  2013 /etc/cron.monthly
drwxr-xr-x 2 root root 4096 Aug 26  2015 /etc/cron.weekly


And like well professional butchers removed everything unnecessery that could trigger any extra unnecessery disk read / writes to HDD.

E.g. just create

# mkdir -p /root/etc_old/{/etc/cron.d,\
/etc/cron.daily,/etc/cron.hourly,/etc/cron.monthly\
,/etc/cron.weekly}


And moved all unnecessery cron job scripts like:

1. nmon (old school network / memory / hard disk console tool for monitoring and tuning server parameters)
2. clamscan / freshclam crons
3. mlocate (the script that is taking care for periodic run of updatedb command to keep the locate command to easily search
for files inside the DB to put less read operations on disk in case if you need to find file (e.g. prevent yourself to everytime
run cmd like: find / . -iname '*whatever_you_look_for*'
4. cups cron jobs
5. logwatch cron
6. rkhunter stuff
7. logrotate (yes we stopped even logrotation trigger job as we found the server was crashing sometimes at the same time when
the lograte job to rotate logs inside /var/log/* was running perhaps leading to a hit of the I/O read error (bad blocks).


Also inspected the Administrator user root cron job for any unwated scripts and stopped two report bash scripts that were part of the PCI tightened Security procedures.
Therein found script responsible to periodically report the list of installed packages and if they have not changed, as well a script to periodically report via email the list of
/etc/{passwd,/etc/shadow} created users, used to historically keep an eye on the list of users and easily see if someone
has created new users on the machine. Those were enabled via /var/spool/cron/root cron jobs, in other cases, on other machines if it happens for you
it is a good idea to check out all the existing user cron jobs and stop anything that might be putting Read / Write extra heat pressure on machine attached the Hard drives.

# ls -al /var/spool/cron/
total 20
drwx——  2 root root 4096 Nov 13  2015 .
drwxr-xr-x 12 root root 4096 May 11  2011 ..
-rw——-  1 root root  133 Nov 13  2015 root


3. Clear up old log files and any files unnecessery

Under /var/log and /home /var/tmp /var/spool/tmp immediately try to clear up the old log files.
From my past experience this has many times made the FS file inodes that are storing on a unbroken part (good blocks) of the hard drive and
ready to be reused by newly written rsyslog / syslogd services spitted files.

!!! Note that during the removal of some files you might hit a files stored on a bad blocks that might lead to a unexpected system reboot.

But that's okay, don't worry most likely after a hard reset by a technician in the Datacenter the machine will boot again and you can enjoy
removing remaining still files to send them to the heaven for old files.


4. Trigger an automatic system file system check with fsck on next boot

The standard way to force a Linux to aumatically recheck its Root filesystem is to simply create the /forcefsck to root partition or any other secondary disk partition you would like to check.

# touch /forcefsck

# reboot


However at some occasions you might be unable to do it because, the / (root fs) has been remounted in ReadOnly mode, yackes …

Luckily old Linux distibutions like this RHEL 5.1, has a way to force a filesystem check after reboot fsck and identify any
unknown bad-blocks and hopefully succceed in isolating them, so you don't hit into the same auto-reboots if the hard drive or Software / Hardware RAID
is not in terrible state
, you can use an option built in in /sbin/shutdown command the '-F'

   -F     Force fsck on reboot.


Hence to make the machine reboot and trigger immediately fsck:

# shutdown -rF now


Just In case you wonder why to reboot before check the Filesystem. Well simply because you need to have them unmounted before you check.

In that specific case this produced so far a good result and the machine booted just fine and we crossed the fingers and prayed that the machine would work flawlessly in the coming few weeks, before we finalize the configuration of the substitute machines, where this old infrastructure will be migrated to a new built cluster with new Haproxy and Corosync / Pacemaker Cluster on a brand new RHEL.

NB! On newer machines this won't work however as shutdown command has been stripped off this option because no SystemV (SystemInit) or Upstart and not on SystemD newer services architecture.
 

5. Hints on checking the hard drives with fsck

If you happen to be able to have physical access to the remote Hardare machine via a TTY[1-9] Console, that's even better and is the standard way to do it but with this specific case we had no easy way to get access to the Physical server console.

It is even better to go there and via either via connected Monitor (Display) or KVM Switch (Those who hear KVM switch first time this is a great device in server rooms to connect multiple monitors to same Monitor Display), it is better to use a some of the multitude of options to choose from for USB Distro Linux recovery OS versions or a CDROM / DVD on older machines like this with the Redhat's recovery mode rolled on.
After mounting the partition simply check each of the disks
e.g. :

# fsck -y /dev/sdb
# fsck -y /dev/sdc

Or if you want to not waste time and look for each hard drive but directly check all the ones that are attached and known by Linux distro via /etc/fstab definition run:

# fsck -AR

If necessery and you have a mixture of filesystems for example EXT3 , EXT4 , REISERFS you can tell it to omit some filesystem, for example ext3, like that:

# fsck -AR -t noext3 -y


To skip fsck on mounted partitions with fsck:

# fsck -M /dev/sdb


One remark to make here on fsck is usually fsck to complete its job on various filesystem it uses other external component binaries usually stored in /sbin/fsck*

ls -al /sbin/fsck*
-rwxr-xr-x 1 root root  55576 20 яну 2022 /sbin/fsck*
-rwxr-xr-x 1 root root  43272 20 яну 2022 /sbin/fsck.cramfs*
lrwxrwxrwx 1 root root      9  4 юли 2020 /sbin/fsck.exfat -> exfatfsck*
lrwxrwxrwx 1 root root      6  7 юни 2021 /sbin/fsck.ext2 -> e2fsck*
lrwxrwxrwx 1 root root      6  7 юни 2021 /sbin/fsck.ext3 -> e2fsck*
lrwxrwxrwx 1 root root      6  7 юни 2021 /sbin/fsck.ext4 -> e2fsck*
-rwxr-xr-x 1 root root  84208  8 фев 2021 /sbin/fsck.fat*
-rwxr-xr-x 2 root root 393040 30 ное 2009 /sbin/fsck.jfs*
-rwxr-xr-x 1 root root 125184 20 яну 2022 /sbin/fsck.minix*
lrwxrwxrwx 1 root root      8  8 фев 2021 /sbin/fsck.msdos -> fsck.fat*
-rwxr-xr-x 1 root root    333 16 дек 2021 /sbin/fsck.nfs*
lrwxrwxrwx 1 root root      8  8 фев 2021 /sbin/fsck.vfat -> fsck.fat*


6. Using tune2fs to  adjust tunable filesystem parameters on ext2/ext3/ext4 filesystems (few examples)

a) To check whether really the filesystem was checked on boot time or check a random filesystem on the server for its last check up date with fsck:

#  tune2fs -l /dev/sda1 | grep checked
Last checked:             Wed Apr 17 11:04:44 2019

On some distributions like old Debian and Ubuntu, it is even possible to enable fsck to log its operations during check on reboot via changing the verbosity from NO to YES:

# sed -i "s/#VERBOSE=no/VERBOSE=yes/" /etc/default/rcS


If you're having the issues on old Debian Linuxes  and not on RHEL  it is possible to;

b) Enable all fsck repairs automatic on boot

by running via:
 

# sed -i "s/FSCKFIX=no/FSCKFIX=yes/" /etc/default/rcS


c) Forcing fcsk check on for server attached Hard Drive Partitions with tune2fs

# tune2fs -c 1 /dev/sdXY

Note that:
tune2fs can force a fsck on each reboot for EXT4, EXT3 and EXT2 filesystems only.

tune2fs can trigger a forced fsck on every reboot using the -c (max-mount-counts) option.
This option sets the number of mounts after which the filesystem will be checked, so setting it to 1 will run fsck each time the computer boots.
Setting it to -1 or 0 resets this (the number of times the filesystem is mounted will be disregarded by e2fsck and the kernel).


 For example you could:

d) Set fsck to run a filesystem check every 30 boots, by using -c 30 
 

# tune2fs -c 30 /dev/sdXY


e) Checking whether a Hard Drive has been really checked on the boot


#  tune2fs -l /dev/sda1 | grep checked
Last checked:             Wed Apr 17 11:04:44 2019


e) Check when was the last time the file system /dev/sdX was checked:
 

# tune2fs -l /dev/sdX | grep Last\ c
Last checked:             Thu Jan 12 20:28:34 2017


f) Check how many times our /dev/sdX filesystem was mounted

# tune2fs -l /dev/sdX | grep Mount
Mount count:              157

g) Check how many mounts are allowed to pass before filesystem check is forced
 

# tune2fs -l /dev/sdX | grep Max
Maximum mount count:      -1


7. Repairing disk / partitions via GRUB fsck.mode and fsck.repair kernel module options

It is also possible to force a fsck.repair on boot via GRUB, but that usually is not an option someone would like as the machine might fail too boot if it hards to repair hardly, however in difficult situations with failing disks temporary enabling it is good idea.

This can be done by including for grub initial config

GRUB_CMDLINE_LINUX_DEFAULT="quiet splash fsck.mode=force fsck.repair=yes"

fsck.mode=force – will force a fsck each time a system boot and keeping that value enabled for a long time inside GRUB is stupid for servers as

sometimes booting could be severely prolonged because of the checks especially with servers with many or slow old hard drives.

fsck.repair=yes – will make the fsck try to repair if it finds bad blocks when checking (be absolutely sure you know, what you're doing if passing this options)

The options can be also set via editing the GRUB boot screen, if you have physical access to the server and don't want to reload the grub loader and possibly make the machine unbootable on next boot.
 

8. Few more details on how /etc/fstab disk fsck check parameters values for Systemd Linux machines works

The "proper" way on systemd (if we can talk about proper way on Linux) to runs fsck for each filesystem that has a fsck is to pass number greater than 0 set in
/etc/fstab (last column in /etc/fstab), so make sure you edit your /etc/fstab if that's not the case.

The root partition should be set to 1 (first to be checked), while other partitions you want to be checked should be set to 2.

Example /etc/fstab:
 

# /etc/fstab: static file system information.

/dev/sda1  /      ext4  errors=remount-ro  0  1
/dev/sda5  /home  ext4  defaults           0  2

The values you can put here as a second number meaning is as follows:
0 – disabled, that is do not check filesystem
1 – partition with this PASS value has a higher priority and is checked first. This value is usually set to the root / partition
2 – partitions with this PASS value will be checked last

a) Check the produced log out of fsck

Unfortunately on the older versions of Linux distros with SystemV fsck log output might be not generated except on the physical console so if you have a kind of duplicator device physical tty on the display port of the server, you might capture some bad block reports or fixed errors messages, but if you don't you might just cross the fingers and hope that anything found FS irregularities was recovered.

On systemd Linux machines the fsck log should be produced either in /run/initramfs/fsck.log or some other location depending on the Linux distro and you should be able to see something from fsck inside /var/log/* logs:

# grep -rli fsck /var/log/*


Close it up

Having a system with failing disk is a really one of the worst sysadmin nightmares to get. The good news is that most of the cases we're prepared with some working backup or some work around stuff like the few steps explained to mitigate the amount of Read / Writes to hard disks on the failing machine HDDs. If the failing disk is a primary Linux filesystem all becomes even worse as every next reboot, you have no guarantee, whether the kernel / initrd or some of the other system components required to run the Core Linux system won't break up the normal boot. Thus one side changes on the hard drives is a risky business on ther other side, if you're in a situation where you have a mirror system or the failing system is just a Linux server installed without a Cluster pair, then this is not a big deal as you can guarantee at least one of the nodes still up, unning and serving. Still doing too much of operations with HDD is always a danger so the steps described, though in most cases leading to improvement on how the system behaves, the system should be considered totally unreliable and closely monitored not only by some monitoring stuff like Zabbix / Prometheus whatever but regularly check the systems state via normal SSH logins. It is important if you have some important datas or logs on the system that are not synchronized to a system node to copy them before doing any of the described operations. After all minimal is backuped, proceed to clear up everything that might be cleared up and still the machine to continue providing most of its functionalities, trigger fsck automatic HDD check on next reboot, reboot, check what is going on and monitor the machine from there on.

Hopefully the few described steps, has helped some sysadmin. There is plenty of things which I've described that might go wrong, even following the described steps, might not help if the machines Storage Drives / SAS / SSD has too much of a damage. But as said in most cases following this few steps would improve the machine state.

Wish you the best of luck!
 

Graphic tool to get Hardware Information on Linux / How to view Hardware Information easy in Linux

Tuesday, October 3rd, 2017


howto-get-graphically-system-hardware-info-linux-gui-program-for-hardware-recognition-linu


IS THERE A GRAPHIC ( GUI ) TOOL TO VIEW HARDWARE INFORMATION ON LINUX?


If you are a console maniac like myself, perhaps you never think that you might need anything graphical besides to view hardware information on Linux, but as we're growing older sometimes it becomes much less easier to just use a graphical tool that can show us all the information we need regarding a Notebook / Desktop PC with Linux or even Server machine with enabled Graphical Environment with a brand new installed GNU / Linux whatever version (I hope you don't own server with running Xorg / Gnome / Mate / Xfce etc. as that's pretty much a waste of hardware resource and opens a dozen of other security risks for the server running services ).


 There are at least 2 ways to quickly check hardware on both PC WorkStation or Server, the easiest and quickest for PC / Notebook Linux users if you have installed GTK libraries or Gnome Desktop Environment is with;
 

LSHW-GTK


LSHW-GTK is simply a GTK frontend over the command line tool for hardware information gathering LSHW
 

HardiInfo


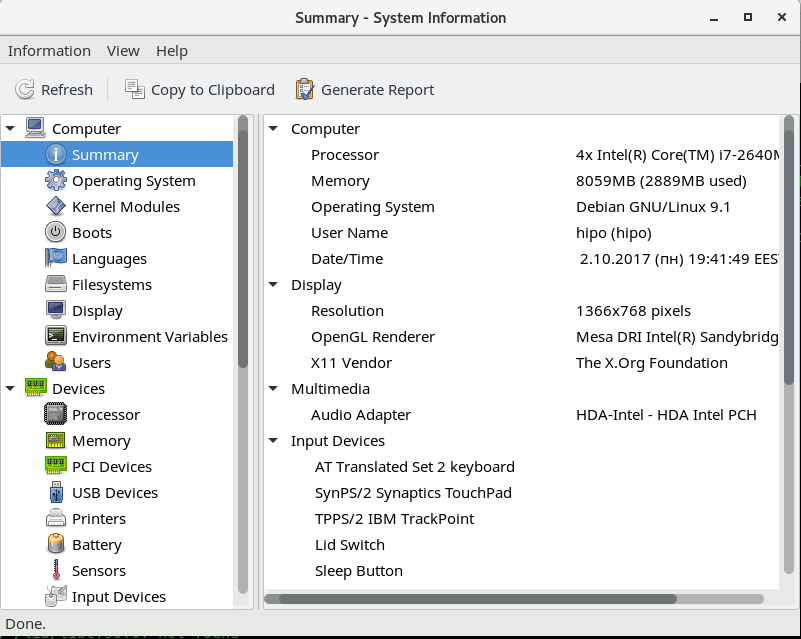
HardInfo – is a small application that displays information about your hardware and operating system. Currently it knows about PCI, ISA PnP, USB, IDE, SCSI, Serial and parallel port devices.


1. Howto Install LSHW-GTK / HardInfo on Debian / Ubuntu / Mint GNU / Linux to easy view hardware information


To install both of them on Debian / Ubuntu GNU / Linux, run:
 

apt-get install –yes lshw lshw-gtk hardinfo


2. Howto install LSHW-GTK on Fedora, CentOS and OpenSuSE Linux to view easy hardware information

On RedHat RPM based Linux distributions, the package to install is called lshw-gui

Install with yum RPM package manager:
 

yum install –yes lshw lshw-gui  hardinfo


3. Run lshw-gtk / hardinfo

Again, find them and run from GUI environment menus or run manually like in below example:

$ lshw-gtk


graphic-program-to-view-computer-hardware-on-linux-lshw-gtk-on-debian-linux-screenshot-view-hardware-easy-linux1


$ hardinfo


hardinfo-a-gui-program-to-view-computer-hardware-info-on-linux-and-freebsd

As you see hardinfo is really interactive and it gives you pretty much all the information, you might need, the only information that was missing at my case and I guess, that would happen to others is information about the SSD Hard Disk, which   180GB

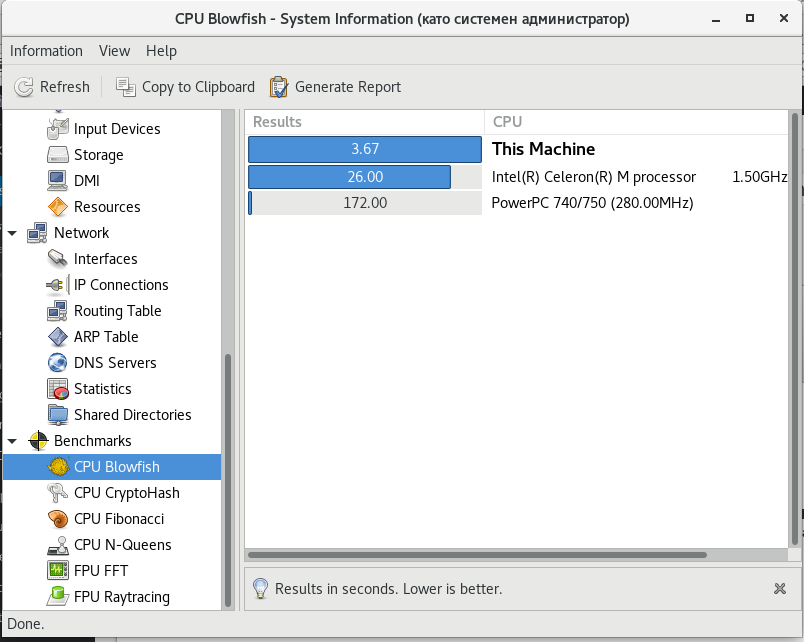
HardInfo is really amazing program as it even includes various common Benchmark Tests and comparison with other Computers:

hardinfo-get-hardware-information-easily-on-linux-and-freebsd-benchmark-info-screenshot-debian-stretch

True that the tests, are pretty simple but still could be useful.

Now run it either from GNOME / Cinnamon (The default graphical environment of Debian Linux) or PLASMA (The new name for the second most popular Linux Graphical Environment – KDE desktop environment)


$ lshw


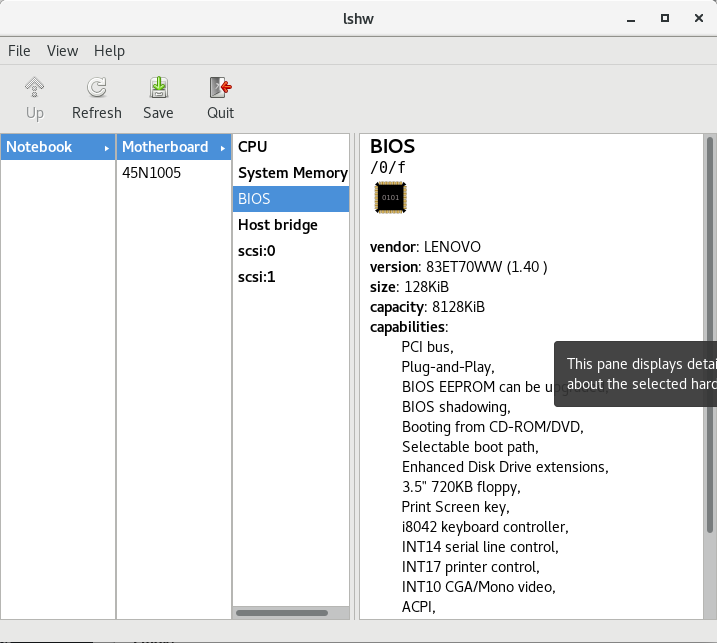
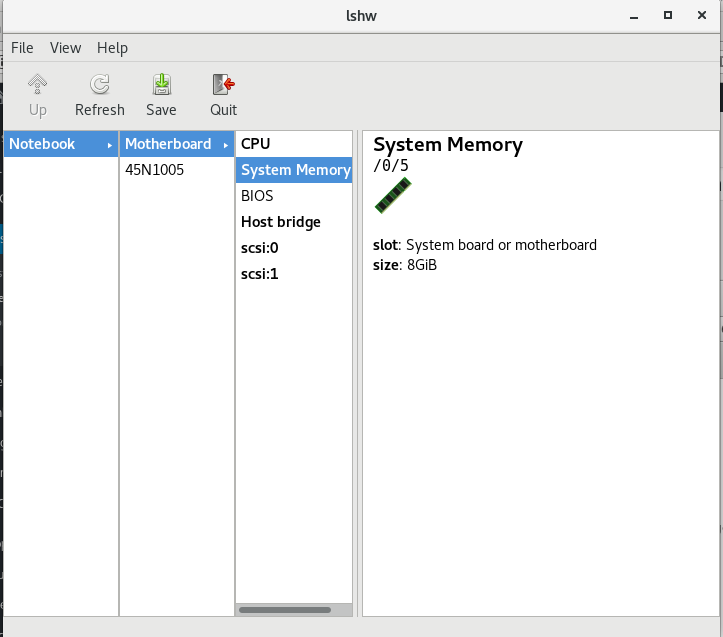
Here is few more screenshots from hardware info reported from my ThinkPad T410 Laptop Running Debian 9 Stretch at the moment.


MotherBoard -> BIOS Information

(thatnks God this old but gold Thinkpad T420 business notebook does not run UEFI substitute for BIOS 🙂

graphic-program-to-view-computer-hardware-on-linux-lshw-gtk-on-debian-linux-screenshot-view-hardware-easy-linux2

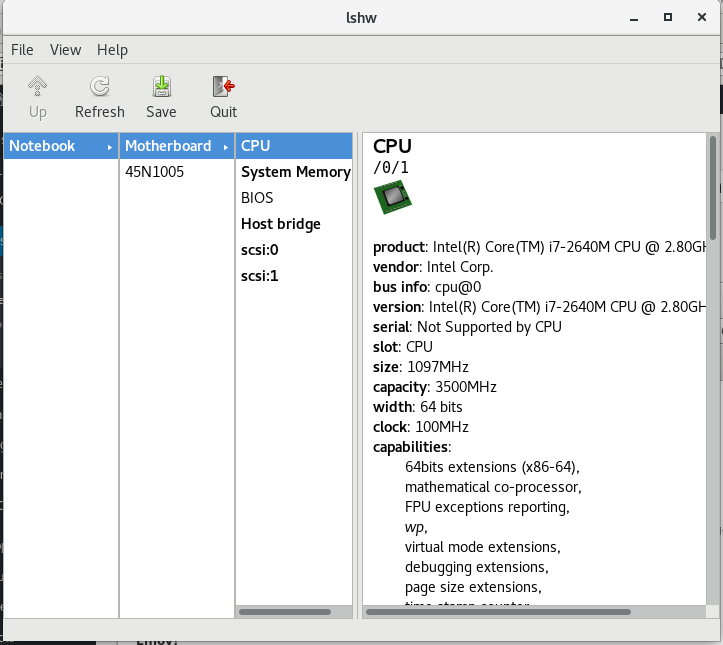
CPU Information (with all the supported CPU capabilities (extensions)

graphic-program-to-view-computer-hardware-on-linux-lshw-gtk-on-debian-linux-screenshot-view-hardware-easy-linux3

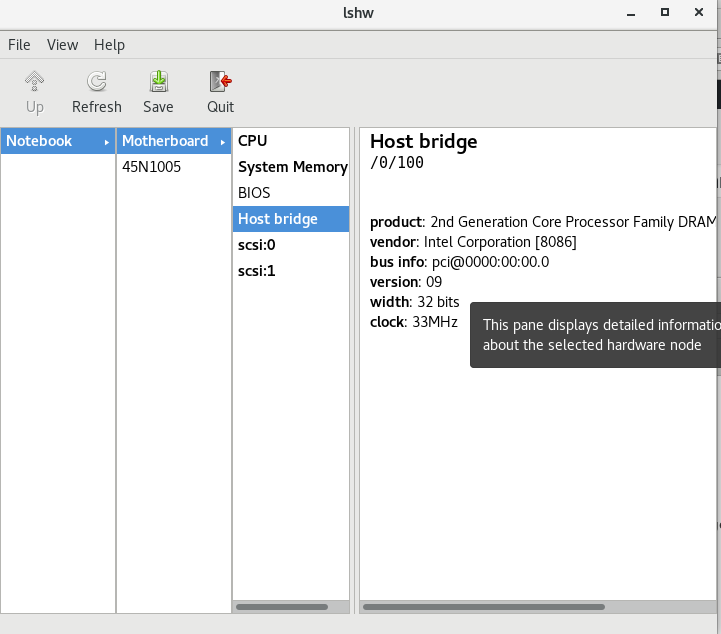
Host Bridge Info

graphic-program-to-view-computer-hardware-on-linux-lshw-gtk-on-debian-linux-screenshot-view-hardware-easy-linux4

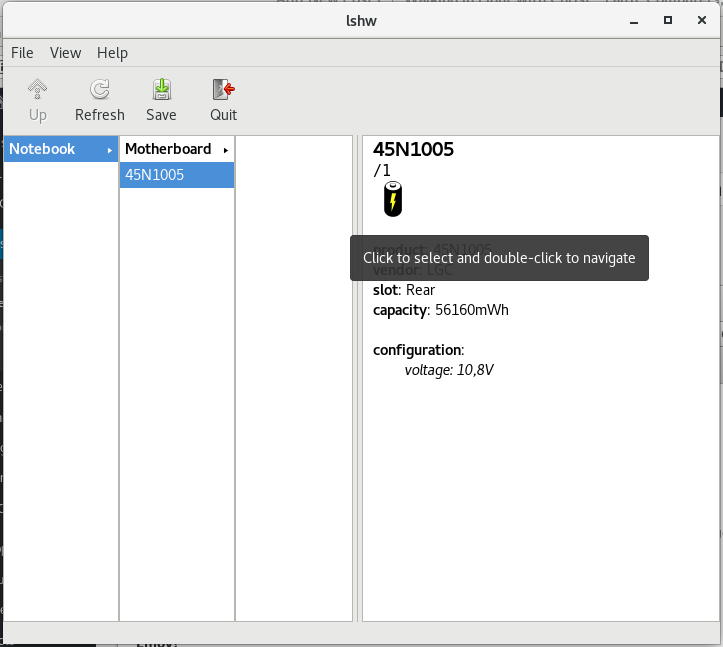
Thinkpad BATTERY (45N1005) Info

graphic-program-to-view-computer-hardware-on-linux-lshw-gtk-on-debian-linux-screenshot-view-hardware-easy-linux5

By the way another Way to GUI View your Computer is to just generate HTML from lshw command line tool (as it supports export to HTML), here is how:


$ lshw -html > ~/hardware-specs.html


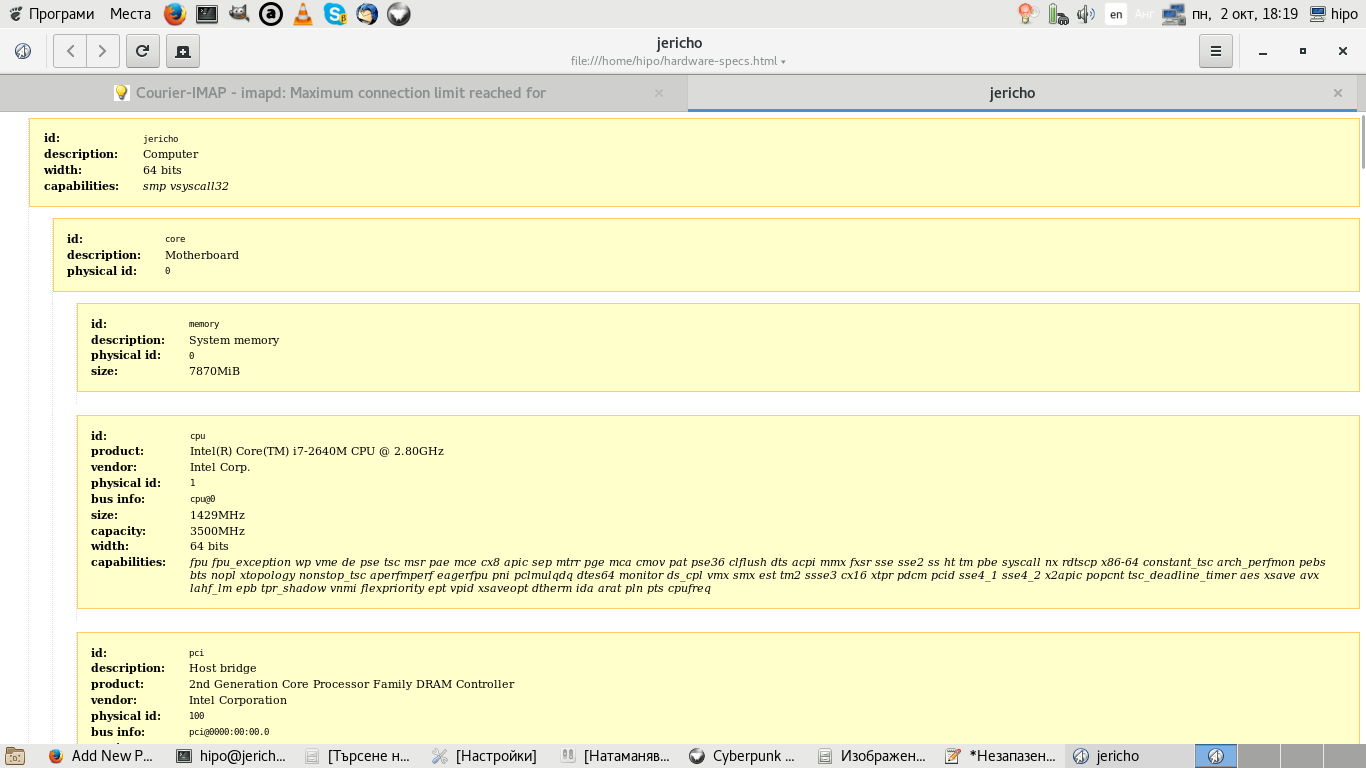
Then just open it with Browser, for example I like GNOME Epiphany browser, so I'll read HTML with it:


$ epiphany ~/hardware-specs.html


graphical-software-to-view-hardware-on-linux-lshw-command-to-generate-html-and-view-it-graphically-in-browser-on-home-pc-or-server


The great thing about generating HTML report for hardware is that on Staging / Production / Development servers which you inherited from some other administrator who for some reason (laziness 🙂 ) didn't left necessery documentation, you can easily map the machine hardware and even if it is a group of machines, you can automate report generation for all of them write a short script that parses the data on each of the HTML reports and finally creates a merged document with main important information about hardware of a cluster of computers etc.

If you still want to stick to console run the console version of lshw or use dmidecode or lshw:


$ lshw

hipo@jericho:~$ lshw
WARNING: you should run this program as super-user.
jericho                     
    description: Computer
    width: 64 bits
    capabilities: smp vsyscall32
  *-core
       description: Motherboard
       physical id: 0
     *-memory
          description: System memory
          physical id: 0
          size: 7870MiB
     *-cpu
          product: Intel(R) Core(TM) i7-2640M CPU @ 2.80GHz
          vendor: Intel Corp.
          physical id: 1
          bus info: cpu@0
          size: 891MHz
          capacity: 3500MHz
          width: 64 bits
          capabilities: fpu fpu_exception wp vme de pse tsc msr pae mce cx8 apic sep mtrr pge mca cmov pat pse36 clflush dts acpi mmx fxsr sse sse2 ss ht tm pbe syscall nx rdtscp x86-64 constant_tsc arch_perfmon pebs bts nopl xtopology nonstop_tsc aperfmperf eagerfpu pni pclmulqdq dtes64 monitor ds_cpl vmx smx est tm2 ssse3 cx16 xtpr pdcm pcid sse4_1 sse4_2 x2apic popcnt tsc_deadline_timer aes xsave avx lahf_lm epb tpr_shadow vnmi flexpriority ept vpid xsaveopt dtherm ida arat pln pts cpufreq
     *-pci
          description: Host bridge
          product: 2nd Generation Core Processor Family DRAM Controller
          vendor: Intel Corporation
          physical id: 100
          bus info: pci@0000:00:00.0
          version: 09
          width: 32 bits
          clock: 33MHz
        *-pci:0
             description: PCI bridge
             product: Xeon E3-1200/2nd Generation Core Processor Family PCI Express Root Port
             vendor: Intel Corporation
             physical id: 1
             bus info: pci@0000:00:01.0
             version: 09
             width: 32 bits
             clock: 33MHz
             capabilities: pci normal_decode bus_master cap_list
             configuration: driver=pcieport
             resources: irq:24 ioport:5000(size=4096) memory:f0000000-f10fffff ioport:c0000000(size=301989888)
           *-generic UNCLAIMED
                description: Unassigned class
                product: Illegal Vendor ID
                vendor: Illegal Vendor ID
                physical id: 0
                bus info: pci@0000:01:00.0
                version: ff
                width: 32 bits
                clock: 66MHz
                capabilities: bus_master vga_palette cap_list
                configuration: latency=255 maxlatency=255 mingnt=255
                resources: memory:f0000000-f0ffffff memory:c0000000-cfffffff memory:d0000000-d1ffffff ioport:5000(size=128) memory:f1000000-f107ffff
        *-display
             description: VGA compatible controller
             product: 2nd Generation Core Processor Family Integrated Graphics Controller
             vendor: Intel Corporation
             physical id: 2
             bus info: pci@0000:00:02.0
             version: 09
             width: 64 bits
             clock: 33MHz
             capabilities: vga_controller bus_master cap_list rom
             configuration: driver=i915 latency=0
             resources: irq:30 memory:f1400000-f17fffff memory:e0000000-efffffff ioport:6000(size=64) memory:c0000-dffff
        *-communication:0
             description: Communication controller
             product: 6 Series/C200 Series Chipset Family MEI Controller #1
             vendor: Intel Corporation
             physical id: 16
             bus info: pci@0000:00:16.0
             version: 04
             width: 64 bits
             clock: 33MHz
             capabilities: bus_master cap_list
             configuration: driver=mei_me latency=0
             resources: irq:27 memory:f3925000-f392500f
        *-communication:1
             description: Serial controller
             product: 6 Series/C200 Series Chipset Family KT Controller
             vendor: Intel Corporation
             physical id: 16.3
             bus info: pci@0000:00:16.3
             version: 04
             width: 32 bits
             clock: 66MHz
             capabilities: 16550 bus_master cap_list
             configuration: driver=serial latency=0
             resources: irq:19 ioport:60b0(size=8) memory:f392c000-f392cfff
        *-network
             description: Ethernet interface
             product: 82579LM Gigabit Network Connection
             vendor: Intel Corporation
             physical id: 19
             bus info: pci@0000:00:19.0
             logical name: enp0s25
             version: 04
             serial: 00:21:cc:cc:b2:27
             capacity: 1Gbit/s
             width: 32 bits
             clock: 33MHz
             capabilities: bus_master cap_list ethernet physical tp 10bt 10bt-fd 100bt 100bt-fd 1000bt-fd autonegotiation
             configuration: autonegotiation=on broadcast=yes driver=e1000e driverversion=3.2.6-k firmware=0.13-3 latency=0 link=no multicast=yes port=twisted pair
             resources: irq:25 memory:f3900000-f391ffff memory:f392b000-f392bfff ioport:6080(size=32)
        *-usb:0
             description: USB controller
             product: 6 Series/C200 Series Chipset Family USB Enhanced Host Controller #2
             vendor: Intel Corporation
             physical id: 1a
             bus info: pci@0000:00:1a.0
             version: 04
             width: 32 bits
             clock: 33MHz
             capabilities: ehci bus_master cap_list
             configuration: driver=ehci-pci latency=0
             resources: irq:16 memory:f392a000-f392a3ff
        *-multimedia
             description: Audio device
             product: 6 Series/C200 Series Chipset Family High Definition Audio Controller
             vendor: Intel Corporation
             physical id: 1b
             bus info: pci@0000:00:1b.0
             version: 04
             width: 64 bits
             clock: 33MHz
             capabilities: bus_master cap_list
             configuration: driver=snd_hda_intel latency=0
             resources: irq:29 memory:f3920000-f3923fff
        *-pci:1
             description: PCI bridge
             product: 6 Series/C200 Series Chipset Family PCI Express Root Port 1
             vendor: Intel Corporation
             physical id: 1c
             bus info: pci@0000:00:1c.0
             version: b4
             width: 32 bits
             clock: 33MHz
             capabilities: pci normal_decode cap_list
             configuration: driver=pcieport
             resources: irq:16
        *-pci:2
             description: PCI bridge
             product: 6 Series/C200 Series Chipset Family PCI Express Root Port 2
             vendor: Intel Corporation
             physical id: 1c.1
             bus info: pci@0000:00:1c.1
             version: b4
             width: 32 bits
             clock: 33MHz
             capabilities: pci normal_decode bus_master cap_list
             configuration: driver=pcieport
             resources: irq:17 memory:f3800000-f38fffff
           *-network
                description: Wireless interface
                product: Centrino Advanced-N 6205 [Taylor Peak]
                vendor: Intel Corporation
                physical id: 0
                bus info: pci@0000:03:00.0
                logical name: wlp3s0
                version: 34
                serial: 26:ad:26:50:f1:db
                width: 64 bits
                clock: 33MHz
                capabilities: bus_master cap_list ethernet physical wireless
                configuration: broadcast=yes driver=iwlwifi driverversion=4.9.0-3-amd64 firmware=18.168.6.1 ip=192.168.0.102 latency=0 link=yes multicast=yes wireless=IEEE 802.11
                resources: irq:28 memory:f3800000-f3801fff
        *-pci:3
             description: PCI bridge
             product: 6 Series/C200 Series Chipset Family PCI Express Root Port 4
             vendor: Intel Corporation
             physical id: 1c.3
             bus info: pci@0000:00:1c.3
             version: b4
             width: 32 bits
             clock: 33MHz
             capabilities: pci normal_decode bus_master cap_list
             configuration: driver=pcieport
             resources: irq:19 ioport:4000(size=4096) memory:f3000000-f37fffff ioport:f1800000(size=8388608)
        *-pci:4
             description: PCI bridge
             product: 6 Series/C200 Series Chipset Family PCI Express Root Port 5
             vendor: Intel Corporation
             physical id: 1c.4
             bus info: pci@0000:00:1c.4
             version: b4
             width: 32 bits
             clock: 33MHz
             capabilities: pci normal_decode bus_master cap_list
             configuration: driver=pcieport
             resources: irq:16 ioport:3000(size=4096) memory:f2800000-f2ffffff ioport:f2000000(size=8388608)
           *-generic
                description: System peripheral
                product: MMC/SD Host Controller
                vendor: Ricoh Co Ltd
                physical id: 0
                bus info: pci@0000:0d:00.0
                version: 08
                width: 32 bits
                clock: 33MHz
                capabilities: bus_master cap_list
                configuration: driver=sdhci-pci latency=0
                resources: irq:16 memory:f2800000-f28000ff
        *-usb:1
             description: USB controller
             product: 6 Series/C200 Series Chipset Family USB Enhanced Host Controller #1
             vendor: Intel Corporation
             physical id: 1d
             bus info: pci@0000:00:1d.0
             version: 04
             width: 32 bits
             clock: 33MHz
             capabilities: ehci bus_master cap_list
             configuration: driver=ehci-pci latency=0
             resources: irq:23 memory:f3929000-f39293ff
        *-isa
             description: ISA bridge
             product: QM67 Express Chipset Family LPC Controller
             vendor: Intel Corporation
             physical id: 1f
             bus info: pci@0000:00:1f.0
             version: 04
             width: 32 bits
             clock: 33MHz
             capabilities: isa bus_master cap_list
             configuration: driver=lpc_ich latency=0
             resources: irq:0
        *-storage
             description: SATA controller
             product: 6 Series/C200 Series Chipset Family 6 port SATA AHCI Controller
             vendor: Intel Corporation
             physical id: 1f.2
             bus info: pci@0000:00:1f.2
             version: 04
             width: 32 bits
             clock: 66MHz
             capabilities: storage ahci_1.0 bus_master cap_list
             configuration: driver=ahci latency=0
             resources: irq:26 ioport:60a8(size=8) ioport:60bc(size=4) ioport:60a0(size=8) ioport:60b8(size=4) ioport:6060(size=32) memory:f3928000-f39287ff
        *-serial
             description: SMBus
             product: 6 Series/C200 Series Chipset Family SMBus Controller
             vendor: Intel Corporation
             physical id: 1f.3
             bus info: pci@0000:00:1f.3
             version: 04
             width: 64 bits
             clock: 33MHz
             configuration: driver=i801_smbus latency=0
             resources: irq:18 memory:f3924000-f39240ff ioport:efa0(size=32)
     *-scsi
          physical id: 2
          logical name: scsi1
          capabilities: emulated
        *-cdrom
             description: DVD-RAM writer
             product: DVDRAM GT50N
             vendor: HL-DT-ST
             physical id: 0.0.0
             bus info: scsi@1:0.0.0
             logical name: /dev/cdrom
             logical name: /dev/cdrw
             logical name: /dev/dvd
             logical name: /dev/dvdrw
             logical name: /dev/sr0
             version: LT20
             capabilities: removable audio cd-r cd-rw dvd dvd-r dvd-ram
             configuration: ansiversion=5 status=nodisc
WARNING: output may be incomplete or inaccurate, you should run this program as super-user.


Enjoy Life ! 🙂

Finding top access IPs in Webserver or how to delay connects from Bots (Web Spiders) to your site to prevent connect Denial of Service

Friday, September 15th, 2017

analyze-log-files-most-visited-ips-and-find-and-stopwebsite-hammering-bot-spiders-neo-tux

If you're a sysadmin who has to deal with cracker attemps for DoS (Denial of Service) on single or multiple servers (clustered CDN or standalone) Apache Webservers, nomatter whether working for some web hosting company or just running your private run home brew web server its very useful thing to inspect Web Server log file (in Apache HTTPD case that's access.log).

Sometimes Web Server overloads and the follow up Danial of Service (DoS) affect is not caused by evil crackers (mistkenly often called hackers but by some data indexing Crawler Search Engine bots who are badly configured to aggressively crawl websites and hence causing high webserver loads flooding your servers with bad 404 or 400, 500 or other requests, just to give you an example of such obstructive bots.

1. Dealing with bad Search Indexer Bots (Spiders) with robots.txt

Just as I mentioned hackers word above I feel obliged to expose the badful lies the press and media spreading for years misconcepting in people's mind the word cracker (computer intruder) with a hacker, if you're one of those who mistakenly call security intruders hackers I recommend you read Dr. Richard Stallman's article On Hacking to get the proper understanding that hacker is an cheerful attitude of mind and spirit and a hacker could be anyone who has this kind of curious and playful mind out there. Very often hackers are computer professional, though many times they're skillful programmers, a hacker is tending to do things in a very undstandard and weird ways to make fun out of life but definitelely follow the rule of do no harm to the neighbor.

Well after the short lirical distraction above, let me continue;

Here is a short list of Search Index Crawler bots with very aggressive behaviour towards websites:


# mass download bots / mirroring utilities
1. webzip
2. webmirror
3. webcopy
4. netants
5. getright
6. wget
7. webcapture
8. libwww-perl
9. megaindex.ru
10. megaindex.com
11. Teleport / TeleportPro
12. Zeus
….

Note that some of the listed crawler bots are actually a mirroring clients tools (wget) etc., they're also included in the list of server hammering bots because often  websites are attempted to be mirrored by people who want to mirror content for the sake of good but perhaps these days more often mirror (duplicate) your content for the sake of stealing, this is called in Web language Content Stealing in SEO language.


I've found a very comprehensive list of Bad Bots to block on Mike's tech blog his website provided example of bad robots.txt file is mirrored as plain text file here

Below is the list of Bad Crawler Spiders taken from his site:


# robots.txt to prohibit bad internet search engine spiders to crawl your website
# Begin block Bad-Robots from robots.txt
User-agent: asterias
Disallow:/
User-agent: BackDoorBot/1.0
Disallow:/
User-agent: Black Hole
Disallow:/
User-agent: BlowFish/1.0
Disallow:/
User-agent: BotALot
Disallow:/
User-agent: BuiltBotTough
Disallow:/
User-agent: Bullseye/1.0
Disallow:/
User-agent: BunnySlippers
Disallow:/
User-agent: Cegbfeieh
Disallow:/
User-agent: CheeseBot
Disallow:/
User-agent: CherryPicker
Disallow:/
User-agent: CherryPickerElite/1.0
Disallow:/
User-agent: CherryPickerSE/1.0
Disallow:/
User-agent: CopyRightCheck
Disallow:/
User-agent: cosmos
Disallow:/
User-agent: Crescent
Disallow:/
User-agent: Crescent Internet ToolPak HTTP OLE Control v.1.0
Disallow:/
User-agent: DittoSpyder
Disallow:/
User-agent: EmailCollector
Disallow:/
User-agent: EmailSiphon
Disallow:/
User-agent: EmailWolf
Disallow:/
User-agent: EroCrawler
Disallow:/
User-agent: ExtractorPro
Disallow:/
User-agent: Foobot
Disallow:/
User-agent: Harvest/1.5
Disallow:/
User-agent: hloader
Disallow:/
User-agent: httplib
Disallow:/
User-agent: humanlinks
Disallow:/
User-agent: InfoNaviRobot
Disallow:/
User-agent: JennyBot
Disallow:/
User-agent: Kenjin Spider
Disallow:/
User-agent: Keyword Density/0.9
Disallow:/
User-agent: LexiBot
Disallow:/
User-agent: libWeb/clsHTTP
Disallow:/
User-agent: LinkextractorPro
Disallow:/
User-agent: LinkScan/8.1a Unix
Disallow:/
User-agent: LinkWalker
Disallow:/
User-agent: LNSpiderguy
Disallow:/
User-agent: lwp-trivial
Disallow:/
User-agent: lwp-trivial/1.34
Disallow:/
User-agent: Mata Hari
Disallow:/
User-agent: Microsoft URL Control – 5.01.4511
Disallow:/
User-agent: Microsoft URL Control – 6.00.8169
Disallow:/
User-agent: MIIxpc
Disallow:/
User-agent: MIIxpc/4.2
Disallow:/
User-agent: Mister PiX
Disallow:/
User-agent: moget
Disallow:/
User-agent: moget/2.1
Disallow:/
User-agent: mozilla/4
Disallow:/
User-agent: Mozilla/4.0 (compatible; BullsEye; Windows 95)
Disallow:/
User-agent: Mozilla/4.0 (compatible; MSIE 4.0; Windows 95)
Disallow:/
User-agent: Mozilla/4.0 (compatible; MSIE 4.0; Windows 98)
Disallow:/
User-agent: Mozilla/4.0 (compatible; MSIE 4.0; Windows NT)
Disallow:/
User-agent: Mozilla/4.0 (compatible; MSIE 4.0; Windows XP)
Disallow:/
User-agent: Mozilla/4.0 (compatible; MSIE 4.0; Windows 2000)
Disallow:/
User-agent: Mozilla/4.0 (compatible; MSIE 4.0; Windows ME)
Disallow:/
User-agent: mozilla/5
Disallow:/
User-agent: NetAnts
Disallow:/
User-agent: NICErsPRO
Disallow:/
User-agent: Offline Explorer
Disallow:/
User-agent: Openfind
Disallow:/
User-agent: Openfind data gathere
Disallow:/
User-agent: ProPowerBot/2.14
Disallow:/
User-agent: ProWebWalker
Disallow:/
User-agent: QueryN Metasearch
Disallow:/
User-agent: RepoMonkey
Disallow:/
User-agent: RepoMonkey Bait & Tackle/v1.01
Disallow:/
User-agent: RMA
Disallow:/
User-agent: SiteSnagger
Disallow:/
User-agent: SpankBot
Disallow:/
User-agent: spanner
Disallow:/
User-agent: suzuran
Disallow:/
User-agent: Szukacz/1.4
Disallow:/
User-agent: Teleport
Disallow:/
User-agent: TeleportPro
Disallow:/
User-agent: Telesoft
Disallow:/
User-agent: The Intraformant
Disallow:/
User-agent: TheNomad
Disallow:/
User-agent: TightTwatBot
Disallow:/
User-agent: Titan
Disallow:/
User-agent: toCrawl/UrlDispatcher
Disallow:/
User-agent: True_Robot
Disallow:/
User-agent: True_Robot/1.0
Disallow:/
User-agent: turingos
Disallow:/
User-agent: URLy Warning
Disallow:/
User-agent: VCI
Disallow:/
User-agent: VCI WebViewer VCI WebViewer Win32
Disallow:/
User-agent: Web Image Collector
Disallow:/
User-agent: WebAuto
Disallow:/
User-agent: WebBandit
Disallow:/
User-agent: WebBandit/3.50
Disallow:/
User-agent: WebCopier
Disallow:/
User-agent: WebEnhancer
Disallow:/
User-agent: WebmasterWorldForumBot
Disallow:/
User-agent: WebSauger
Disallow:/
User-agent: Website Quester
Disallow:/
User-agent: Webster Pro
Disallow:/
User-agent: WebStripper
Disallow:/
User-agent: WebZip
Disallow:/
User-agent: WebZip/4.0
Disallow:/
User-agent: Wget
Disallow:/
User-agent: Wget/1.5.3
Disallow:/
User-agent: Wget/1.6
Disallow:/
User-agent: WWW-Collector-E
Disallow:/
User-agent: Xenu’s
Disallow:/
User-agent: Xenu’s Link Sleuth 1.1c
Disallow:/
User-agent: Zeus
Disallow:/
User-agent: Zeus 32297 Webster Pro V2.9 Win32
Disallow:/
Crawl-delay: 20
# Begin Exclusion From Directories from robots.txt
Disallow: /cgi-bin/

Veryimportant variable among the ones passed by above robots.txt is
 

Crawl-Delay: 20


You might want to tune that variable a Crawl-Delay of 20 instructs all IP connects from any Web Spiders that are respecting robots.txt variables to delay crawling with 20 seconds between each and every connect client request, that is really useful for the Webserver as less connects means less CPU and Memory usage and less degraded performance put by aggressive bots crawling your site like crazy, requesting resources 10 times per second or so …

As you can conclude by the naming of some of the bots having them disabled would prevent your domain/s clients from Email harvesting Spiders and other not desired activities.


2. Listing IP addresses Hits / How many connects per IPs used to determine problematic server overloading a huge number of IPs connects

After saying few words about SE bots and I think it it is fair to also  mention here a number of commands, that helps the sysadmin to inspect Apache's access.log files.
Inspecting the log files regularly is really useful as the number of malicious Spider Bots and the Cracker users tends to be
raising with time, so having a good way to track the IPs that are stoning at your webserver and later prohibiting them softly to crawl either via robots.txt (not all of the Bots would respect that) or .htaccess file or as a last resort directly form firewall is really useful to know.
 

– Below command Generate a list of IPs showing how many times of the IPs connected the webserver (bear in mind that commands are designed log fields order as given by most GNU / Linux distribution + Apache default logging configuration;


webhosting-server:~# cd /var/log/apache2 webhosting-server:/var/log/apache2# cat access.log| awk '{print $1}' | sort | uniq -c |sort -n


Below command provides statistics info based on whole access.log file records, sometimes you will need to have analyzed just a chunk of the webserver log, lets say last 12000 IP connects, here is how:
 

webhosting-server:~# cd /var/log/apache2 webhosting-server:/var/log/apache2# tail -n 12000 access.log| awk '{print $1}' | sort | uniq -c |sort -n


You can combine above basic bash shell parser commands with the watch command to have a top like refresh statistics every few updated refreshing IP statistics of most active customers on your websites.

Here is an example:


webhosting-server:~# watch "cat access.log| awk '{print $1}' | sort | uniq -c |sort -n";


Once you have the top connect IPs if you have a some IP connecting with lets say 8000-10000 thousand times in a really short interval of time 20-30 minues or so. Hence it is a good idea to investigate further where is this IP originating from and if it is some malicious Denial of Service, filter it out either in Firewall (with iptables rules) or ask your ISP or webhosting to do you a favour and drop all the incoming traffic from that IP.

Here is how to investigate a bit more about a server stoner IP;
Lets assume that you found IP: 176.9.50.244 to be having too many connects to your webserver:
 

webhosting-server:~# grep -i 176.9.50.244 /var/log/apache2/access.log|tail -n 1
176.9.50.244 – – [12/Sep/2017:07:42:13 +0300] "GET / HTTP/1.1" 403 371 "-" "Mozilla/5.0 (compatible; MegaIndex.ru/2.0; +http://megaindex.com/crawler)"


webhosting-server:~# host 176.9.50.244
244.50.9.176.in-addr.arpa domain name pointer static.244.50.9.176.clients.your-server.de.


webhosting-server:~# whois 176.9.50.244|less


The outout you will get would be something like:

% This is the RIPE Database query service.
% The objects are in RPSL format.
%
% The RIPE Database is subject to Terms and Conditions.
% See http://www.ripe.net/db/support/db-terms-conditions.pdf

% Note: this output has been filtered.
%       To receive output for a database update, use the "-B" flag.

% Information related to '176.9.50.224 – 176.9.50.255'

% Abuse contact for '176.9.50.224 – 176.9.50.255' is 'abuse@hetzner.de'

inetnum:        176.9.50.224 – 176.9.50.255
netname:        HETZNER-RZ15
descr:          Hetzner Online GmbH
descr:          Datacenter 15
country:        DE
admin-c:        HOAC1-RIPE
tech-c:         HOAC1-RIPE
status:         ASSIGNED PA
mnt-by:         HOS-GUN
mnt-lower:      HOS-GUN
mnt-routes:     HOS-GUN
created:        2012-03-12T09:45:54Z
last-modified:  2015-08-10T09:29:53Z
source:         RIPE

role:           Hetzner Online GmbH – Contact Role
address:        Hetzner Online GmbH
address:        Industriestrasse 25
address:        D-91710 Gunzenhausen
address:        Germany
phone:          +49 9831 505-0
fax-no:         +49 9831 505-3
abuse-mailbox:  abuse@hetzner.de
remarks:        *************************************************
remarks:        * For spam/abuse/security issues please contact *
remarks:        * abuse@hetzner.de, not this address. *
remarks:        * The contents of your abuse email will be *
remarks:        * forwarded directly on to our client for *
….


3. Generate list of directories and files that are most called by clients
 

webhosting-server:~# cd /var/log/apache2; webhosting-server:/var/log/apache2# awk '{print $7}' access.log|cut -d? -f1|sort|uniq -c|sort -nk1|tail -n10

( take in consideration that this info is provided only on current records from /var/log/apache2/ and is short term for long term statistics you have to merge all existing gzipped /var/log/apache2/access.log.*.gz )

To merge all the old gzipped files into one single file and later use above shown command to analyize run:


cd /var/log/apache2/
cp -rpf *access.log*.gz apache-gzipped/
cd apache-gzipped
for i in $(ls -1 *access*.log.*.gz); do gzip -d $i; done
rm -f *.log.gz;
for i in $(ls -1 *|grep -v access_log_complete); do cat $i >> access_log_complete; done


Though the accent of above article is Apache Webserver log analyzing, the given command examples can easily be recrafted to work properly on other Web Servers LigHTTPD, Nginx etc.

Above commands are about to put a higher load to your server during execution, so on busy servers it is a better idea, to first go and synchronize the access.log files to another less loaded servers in most small and midsized companies this is being done by a periodic synchronization of the logs to the log server used usually only to store log various files and later used to do various analysis our run analyse software such as Awstats, Webalizer, Piwik, Go Access etc.

Worthy to mention one great text console must have Apache tool that should be mentioned to analyze in real time for the lazy ones to type so much is Apache-top but those script will be not installed on most webhosting servers and VPS-es, so if you don't happen to own a self-hosted dedicated server / have webhosting company etc. – (have root admin access on server), but have an ordinary server account you can use above commands to get an overall picture of abusive webserver IPs.

logstalgia-visual-loganalyzer-in-reali-time-windows-linux-mac
 

If you have a Linux with a desktop GUI environment and have somehow mounted remotely the weblog server partition another really awesome way to visualize in real time the connect requests to  web server Apache / Nginx etc. is with Logstalgia

Well that's all folks, I hope that article learned you something new. Enjoy

Thanks for article neo-tux picture to segarkshtri.com.np)

Remove pre-installed HP, Dell, Asus, Acer, Toshiba not needed default vendor software on a new bought PC notebook quickly with Decrap My Computer

Thursday, April 14th, 2016

remove-default-unneded-software-from-manufacturer-hp-asus-acer-dell-toshiba
While browsing today and looking for software to clean up all the spy software from my corporate HP laptop, I've come across an interesting tool called Decrap which aims at removing Bloatware from a Windows PC / notebook (mirrored here because original software site was down)

So what is Bloatware ?

The term Bloatware (also called jokingly crapware) is term is the one that was coined to describe, the default pre-installed software that comes to you together with Windows pre-installed OS by the hardware manufacturer.
I'm sure anyone who bought brand new branded PC or laptop over the last 10 years have already suffered the unwanted and unnecessery
bunch of software that comes pre-installed freeware programs aiming to help you in your daily work but in reality just slowing down your PC
and showing annoying popups or at best keeping useless in Windows system apptray.

Let me give you an example:

Cleanup (Remove) common ASUS, HP, Dell default  installed unneded (Bloatware) software

Many users may want to uninstall ASUS Crapware software such as ASUS Tutor, ASUS LifeFrame3, ASUS WebStorage and ASUSVibe.

Like Asus, HP computers often come preloaded with useless software from factory, example for this is HP Customer Service enhancements, HP Update, HP Total Care Setup and ProtectSmart.

If you buy Dell PC notebook soon you'll discover that there are several preloaded software (often unnecessery software) such as Dell Stage, Dell Digital Delivery and Dell DataSafe.

Toshiba computers and notebooks contain pre-loeaded "crapware" software from Toshiba.
Just to mention a few of those: Toshiba Disc Creator, Toshiba ReelTime, Service Station, Bulletin Board and Toshiba Assist.

Often there are fingerprint reader programs, Wi-Fi connection managers, Bluetooth managers, Audio Management sofware and other third party vendor software which tend to be not working as good as others softwares from third vendor, so Decrap is to help you to identify and remove these too in a easy GUI manner.

Non-experienced Computer users often leave the bloatware to hang around for even years and only if some relative that is an IT involved person / sysadmin / Even once you're aware that the Bloatware is on the system the ordinary user is hard to remove it as he is scared not to break the system.
Besides that fften this bloatware just soft comes so much integrated into Windows that removing it costs hours of tries and research online on
all the Bloatware components and even then could mislead you so you break the PC. programmer etc. comes home of such users finds out about the happily existing of the useless software on the notebook.


So here is Decrap My Computer coming at place aiming to help to remove the unnecessery Hardware vendor software in few easy (Click, Click, Click Next ..) steps.

decrap-my-computer-clean-up-bloatware-crapware-on-windows-laptop-main-gui

Then decrap does silently all the complex operations and suggestions to make the HP, Dell, Asus, Toshiba manufacturer prebundled software to be stopped and uninstalled.
Decrap My Computer is a freeware, lightweight and easy to use and lets you safely remove crapware and bloatware, or any software, from any Windows PC.

Even for Old computers, Decrap comes handy for the unexperienced avarage user who used his laptop with this useless  default vendors programs silently killing the performance respectively user experience for years.

Using Decrap is quite intuitive PC is scanned for Bloatware and then after a backup Windows Restore Point is offered you're offered to review and Uninstall the unwanted softwares. There is also an automatic mode but those one still could be a bit dangerous, so use the automatic mode only on multiple machines with the same model  / brand notebooks that comes prebundled with same sofware after testing and confirming the automatic mode on 1 initial machine will not break up some needed functionality.

decrap-your-pc-clean-up-windows-from-hp-dell-toshiba-asus-bloatware-unuseful-programs

Here is few screenshots of the tool in action:
decrap-choose-what-default-laptop-manufacturer-software-you-want-to-clean-from-new-bought-pc

decrap-choose-what-default-laptop-manufacturer-software-you-want-to-clean-from-new-bought-pc-1

decrap-choose-what-default-laptop-manufacturer-software-you-want-to-clean-from-new-bought

Another good alternative (since decrap seems to be not maintained anymore) as I just leardned from Natasha Myles (thanks for pointing me about the broken link to decrap website) is SpeedUpPC more on speeding up old PC or laptop is her article 

Migrate Webserver and SQL data from old SATA Hard drive to SSD to boost websites performance / Installing new SSD KINGSTON 120GB hard disk on Linux

Monday, March 28th, 2016

ssd-linux-migrate-webserver-and-mysql-from-old-SATA-to-SSD-Kingston-Hard-drive-to-boost-performance-installing-new-SSD-on-Debian-linux
Blog and websites hosted on a server were giving bad performance lately and the old SATA Hard Disk on the Lenovo Edge server seemed to be overloaded from In/Out operations and thus slowing down the websites opeining time as well as SQL queries (especially the ones from Related Posts WordPress plugin was quite slow. Sometimes my blog site opening times were up to 8-10 seconds.

To deal with the issue I obviously needed a better speed of I/O of hard drive thus as I've never used SSD hard drives so far,  I decided to buy a new SSD (Solid State Drive) KINGSTON SV300S37A120G, 605ABBF2, max UDMA/133  hard disk.
Mounting the hard disk physically on the computer tower case wasn't a big deal as there are no rotating elements of the SSD it doesn't really matter how it is mounted main thing is that it is being hooked up somewhere to the case.

I was not sure whether the SSD HDD is supported by my Debian GNU / Linux so I had see whether Linux Operating System has properly detected your hard disk use dmesg

1. Check if SSD Hard drive is supported in Linux


linux:~# dmesg|grep -i kingston
[    1.182734] ata5.00: ATA-8: KINGSTON SV300S37A120G, 605ABBF2, max UDMA/133
[    1.203825] scsi 4:0:0:0: Direct-Access     ATA      KINGSTON SV300S3 605A PQ: 0 ANSI: 5


linux:~# dmesg|grep -i sdb
[    1.207819] sd 4:0:0:0: [sdb] 234441648 512-byte logical blocks: (120 GB/111 GiB)
[    1.207847] sd 4:0:0:0: [sdb] Write Protect is off
[    1.207848] sd 4:0:0:0: [sdb] Mode Sense: 00 3a 00 00
[    1.207860] sd 4:0:0:0: [sdb] Write cache: enabled, read cache: enabled, doesn't support DPO or FUA
[    1.207928]  sdb: unknown partition table
[    1.208319] sd 4:0:0:0: [sdb] Attached SCSI disk


Well great news as you see from above output obviously the Kingston SSD HDD was detected by the kernel.
I've also inspected whether the proper dimensions of hard drive (all 120 Gigabytes are being detected by the OS):


linux:~# fdisk -l /dev/sdb
Disk /dev/sdb: 120.0 GB, 120034123776 bytes
255 heads, 63 sectors/track, 14593 cylinders, total 234441648 sectors
Units = sectors of 1 * 512 = 512 bytes
Sector size (logical/physical): 512 bytes / 512 bytes
I/O size (minimum/optimal): 512 bytes / 512 bytes
Disk identifier: 0x00000000

Even better as the proper HDD sizing was detected by Linux kernel.
Next thing to do was of course to create ext4 filesystem on the SSD HDD.
I wanted to give 2 separate partitions for my Webserver Websites DocumentRoot directories which all lay under the standard Apache location inside /var/www as well as MySQL data folder which is also under the standard Debian based Linuces – /var/lib/mysql as the SQL data directory was just 3.3 GB size, I've decided to reserve 20GB gigabytes for the MySQL and another 100 GB for my PHP / CSS / JS / HTML and other data files /var/www.
 

2. Create SSD partitions with cfdisk

Hence I needed to create:

1. SSD partition of 100GB
2. SSD partition of 20GB

I have cfdisk installed and I believe, the easiest way to create the partitions is using interactive partitioner as CFDISK instead of fdisk: so in order to make the proper partitions I've ran


linux:~# cfdisk /dev/sdb


I' will skip explainig details on how to use CFDISK as it is pretty standard – display or manipulate disk partition table tool.
Just press on NEW button (moving with arrow keys buttons) and choose the 2 partitions size 100000 and 20000 MB (one thing to note here is that you have to choose between Primary and  Logical creation of partitions, as my SSD is a secondary drive and I already have a ) and then press the
WRITE button to save all the partition changes.

!!! Be very careful here as you might break up your other disks data make sure you're really modifying the SSD Hard Drive and not your other /dev/sda or other attached external Hard drive or ATA / SATA disk.
Press the WRITE button only once you're absolutely sure, you do it at your own (always create backup of your other data and don't blame me if something goes wrong) …

Once created the two partitions will look like in the screenshot below:
creating-linux-partitions-with-cfdisk-linux-partitioning-tool.png


3. Create ext4 filesystem 100 and 20 GB partitions

Next thing to do before the two partitions are ready to mount under Webserver's files documentroot /var/www and /var/lib/mysql is to create ext4 filesystem, though some might prefer to stick to ext3 or reiserfs partition, I would recommend you use ext4 for the reason ext4 according to my quick research is said to perform much better with SSD Hard Drives.

The tool to create the ext4 filesystems is mkfs4.ext4 it is provided by debian package e2fsprogs I have it already installed on my server, if you don't have it just go on and install it with:
 

linux:~# apt-get install –yes e2fsprogs


To create the two ext4 partitions run:
 

linux:~# mkfs4.ext4 /dev/sdb5


linux:~# mfs4.ext4 /dev/sdb6


Here the EXT4 filesystem on partition that is supposed to be 100 Gigabytes will take 2, 3 minutes as the dimensions of partition are a bit bigger, so if you don't want to get boring go grab a coffee, once the partitions are ready you can evaluate whether everyhing is properly created with fdisk you should get output like the one below


linux:~# fdisk -l /dev/sdb
Disk /dev/sdb: 120.0 GB, 120034123776 bytes
255 heads, 63 sectors/track, 14593 cylinders, total 234441648 sectors
Units = sectors of 1 * 512 = 512 bytes
Sector size (logical/physical): 512 bytes / 512 bytes
I/O size (minimum/optimal): 512 bytes / 512 bytes
Disk identifier: 0x00000000

   Device Boot      Start         End      Blocks   Id  System
/dev/sdb1              63   234441647   117220792+   5  Extended
/dev/sdb5             126    39070079    19534977   83  Linux
/dev/sdb6        39070143   234441647    97685752+  83  Linux


4. Mount newly created SSD partitions under /var/www and /var/lib/mysql

Before I mounted /var/www and /var/lib/mysql in order to be able to mount under the already existing directories I had to:

1. Stop Apache and MySQL server
2. Move Mysql and Apache Documentroot and Data directories to -bak
3. Create new empty /var/www and /var/lib/mysql direcotries
4. Copy backpups ( /var/www-bak and /var/lib/mysql-bak ) to the newly mounted ext4 SSD partitions

To achieve that I had to issue following commands:
 

linux:~# /etc/init.d/apache2 stop
linux:~# /etc/init.d/mysql stop

linux:~# mv /var/www /var/www-bak
linux:~# mv /var/lib/mysql /var/lib/mysql-bak

linux:~# mkdir /var/www
linux:~# mkdir /var/lib/mysql
linux:~# chown -R mysql:mysql /var/lib/mysql


Then to manually mount the SSD partitions:
 

linux:~# mount  /dev/sdb5 /var/lib/mysql
linux:~# mount /dev/sdb6 /var/www


To check that the folders are mount into the SSD drive, ran mount cmd:


linux:~# mount
/dev/sda1 on / type ext3 (rw,errors=remount-ro)
tmpfs on /lib/init/rw type tmpfs (rw,nosuid,mode=0755)
proc on /proc type proc (rw,noexec,nosuid,nodev)
sysfs on /sys type sysfs (rw,noexec,nosuid,nodev)
udev on /dev type tmpfs (rw,mode=0755)
tmpfs on /dev/shm type tmpfs (rw,nosuid,nodev)
devpts on /dev/pts type devpts (rw,noexec,nosuid,gid=5,mode=620)
fusectl on /sys/fs/fuse/connections type fusectl (rw)
/dev/sdc1 on /backups type ext4 (rw)
/dev/sdb5 on /var/lib/mysql type ext4 (rw,relatime,discard,data=ordered))
/dev/sdb6 on /var/www type ext4 (rw,relatime,discard,data=ordered))


That's great now the filesystem mounts fine, however as it an SSD drive and SSD drives are being famous for having a number of limited writes on disk before the drive lifetime is over it is a good idea to increase a bit the lifetime of the SSD by mounting the SSD partitions with noatime and errors=remount-ro (in order to not log file access times to filesystem table and to remount the FS read only in case of some physical errors of the drive).

5. Configure SSD partitions to boot every time Linux reboots

Now great, the filesystems gets mounted fine so next thing to do is to make it automatically mount every time the Linux OS boots up, this on GNU / Linux is done through /etc/fstab, for my 2 ext4 partitions this is the content to add at the end of /etc/fstab:


/dev/sdb5               /var/lib/mysql      ext4        noatime,errors=remount-ro       0       1
/dev/sdb6               /var/www        ext4    noatime,errors=remount-ro       0       1


quickest way to add it without a text editor is to echo to the end of file:
 

linux:~# cp -rpf /etc/fstab /etc/fstab.bak_25_03_2016
linux:~# echo ' /dev/sdb5               /var/lib/mysql      ext4        noatime,errors=remount-ro,discard       0       1' >> /etc/fstab
linux:~# echo ' /dev/sdb6               /var/www        ext4    noatime,errors=remount-ro,discard       0       1 ' >> /etc/fstab


Then mount again all the filesystems including the 2 new created SSD (100 and 20 GB) partitions:
 

linux:~# umount /var/www
linux:~# umount /var/lib/mysql
linux:~# mount -a


To assure properly mounted with noatime and remount-ro on errors options:


linux:~# mount | grep -i sdb
/dev/sdb5 on /var/lib/mysql type ext4 (rw,noatime,errors=remount-ro)
/dev/sdb6 on /var/www type ext4 (rw,noatime,errors=remount-ro)


It is also a good idea to check a statistics of disk free command:
 

linux:~# df -h|grep -i sdb
/dev/sdb5         19G  0G    19G  0% /var/lib/mysql
/dev/sdb6         92G   0G    92G  0% /var/www


6. Copy all Webserver and SQL data from backupped directories to new SSD mounted

Last but not least is to copy all original content files from /var/www-bak and /var/lib/mysql-bak to the new freshly  created SSD partitions, though copying the files can be made with normal linux copy command (cp),
I personally prefer rsync because rsync is much quicker and more efficient in copying large amount of files in my case this were 48 Gigabytes.

To copy files from with rsync:


linux:~# rsync -av –log-file /var/log/backup.log  /var/www-bak /var/www
linux:~# rsync -av –log-file /var/log/backup.log  /var/lib/mysql-bak /var/lib/mysql


Then ofcourse, finally to restore my websites normal operation I had to bring up the Apache Webservers and MySQL service


linux:~# /etc/init.d/apache2 start
linux:~# /etc/init.d/mysql start


7. Optimizing SSD performance with periodic trim (discard of unused blocks on a mounted filesystem)

As I digged deeper into how to even further optimize SSD drive performance I learned about the cleaning action TRIM of the partitions for a long term performance proper operation, to understand it better think about trimming like Windows degrament operatin.
 

NAME
fstrim – discard unused blocks on a mounted filesystem

SYNOPSIS
fstrim [-o offset] [-l length] [-m minimum-free-extent] [-v] mountpoint

DESCRIPTION
fstrim is used on a mounted filesystem to discard (or "trim") blocks which are not in use by the filesystem. This is useful for
solid-state drives (SSDs) and thinly-provisioned storage.

By default, fstrim will discard all unused blocks in the filesystem. Options may be used to modify this behavior based on range or
size, as explained below.


Trimming is really necessery, otherwise SSD become very slow after some time. All modern SSD's support TRIM, but older SSD's from before 2010 usually don't.
Thus for an older SSD you'll want to check this on the website of the manufacturer.

As I mentioned earlier TRIM is not supported by all SSD drives, to check whether TRIM is supported by SSD:

linux:~# hdparm -I /dev/sdb|grep -i -E 'trim|discard'
                  *          Data set Management TRIM supported (limit 1 block)

It's easiest to let the system perform an automatic TRIM. That can be done in several ways.

The quickest way for trimming is to place into /etc/rc.local trim  commands, in my case it was the following commands:


fstrim -v /var/lib/mysql
fstrim -v /var/www

To add it I've used my favourite vim text editor.
Adding commands to rc.local will make SSD trimming be executed at boot time so this will reduce a bit the downtime during the trim with some time so perhaps for those like me which are running a crually important websites a better

An alternative way is to schedule a daily cron job to do just place a new job in /etc/cron.daily/trim e.g.:
 

linux:~# vim /etc/cron.daily/trim


#!/bin/sh
fstrim -v /var/lib/mysql
fstrim -v /var/www

linux:~# chmod +x /etc/cron.daily/trim

However the best way to enable automatic trimming to SSD  is to just add the discard parameter to /etc/fstab I've already done that earlier in this article.

Not really surprising the increase of websites opening (page load times) were decreased dramatically web page loading waiting time fall down 2 to 2.5 times, so the moral of story for me is always when possible from now on to use SSD in order to have superb websites opening times.

To sum it up what was achieved with moving my data into SSD Drive, before moving websites and SQL data to SSD drive the websites were opening for 6 to 10 seconds now sites open in 2 to 4.5 seconds which is below 5 seconds (the normal waiting time for a user to see your website).
By the way it should be not a news forfor people that are into Search Engine Optimization but might be for some of unexperienced new Admins and Webmasters that, all that all page opening times that  exceeds 5 secs is considered to be a slow website (and therefore perhaps not worthy to read).
The high load page times >5 secs makes the website also less interesting not only for end users but also for search engines (Google / Yahoo / Bing / Baidoo etc.) will is said to crawl it less if website is slow.
Search Engines are said to Index much better and crawl more frequently into more responsive websites.
Hence implementing SSD to a server and decreasing the page load time should bring up my visitors stats a bit too.

Well that's all for today, hope you enjoyed 🙂