Posts Tagged ‘script’

Zabbix: Monitor Linux rsyslog configured central log server is rechable with check_log_server_status.sh userparameter script

Wednesday, June 8th, 2022

zabbix-monitor-central-log-server-is-reachable-from-host-with-a-userparamater-script-zabbix-logo

On modern Linux OS servers on Redhat / CentOS / Fedora and Debian based distros log server service is usually running on the system  such as rsyslog (rsyslogd) to make sure the logging from services is properly logged in separate logs under /var/log.

A very common practice on critical server machines in terms of data security, where logs produced by rsyslog daermon needs to be copied over network via TCP or UDP protocol immediately is to copy over the /var/log produced logs to another configured central logging server. Then later every piece of bit generated by rsyslogd could be  overseen by a third party auditor person and useful for any investigation in case of logs integrity is required or at worse case if there is a suspicion that system in question is hacked by a malicious hax0r and logs have been "cleaned" up from any traces leading to the intruder (things usually done locally by hackers) or by any automated script exploit tools since yesr.

This doubled logging of system events to external log server  ipmentioned is very common practice by companies to protect their log data and quite useful for logs to be recovered easily later on from the central logging server machine that could be also setup for example to use rsyslogd to receive logs from other Linux machines in circumstances where some log disappears just like that (things i've seen happen) for any strange reason or gets destroyed by the admins mistake locally on machine / or by any other mean such as filesystem gets damaged. a very common practice by companies to protect their log data.  

Monitor remote logging server is reachable with userparameter script

Assuming that you already have setup a logging from the server hostname A towards the Central logging server log storepool and everything works as expected the next logical step is to have at least some basic way to monitor remote logging server configured is still reachable all the time and respectively rsyslog /var/log/*.* logs gets properly produced on remote side for example with something like a simple TCP remote server port check and reported in case of troubles in zabbix.

To solve that simple task for company where I'm employed, I've developed below check_log_server_status.sh:
 

#!/bin/bash
# @@ for TCP @ for UDP
# check_log_server_status.sh Script to check if configured TCP / UDP logging server in /etc/rsyslog.conf is rechable
# report to zabbix
DELIMITER='@@';
GREP_PORT='5145';
CONNECT_TIMEOUT=5;

PORT=$(grep -Ei "*.* $DELIMITER.*:$GREP_PORT" /etc/rsyslog.conf|awk -F : '{ print $2 }'|sort -rn |uniq);

#for i in $(grep -Ei "*.* $DELIMITER.*:$GREP_PORT" /etc/rsyslog.conf |grep -v '\#'|awk -F"$DELIMITER" '{ print $2 }' | awk -F ':' '{ print $1 }'|sort -rn); do
HOST=$(grep -Ei "*.* $DELIMITER.*:$GREP_PORT" /etc/rsyslog.conf |grep -v '\#'|awk -F"$DELIMITER" '{ print $2 }' | awk -F ':' '{ print $1 }'|sort -rn)

# echo $PORT

if [[ ! -z $PORT ]] && [[ ! -z $HOST ]]; then
SSH_RETURN=$(/bin/ssh $HOST -p $PORT -o ConnectTimeout=$CONNECT_TIMEOUT 2>&1);
else
echo "PROBLEM Port $GREP_PORT not defined in /etc/rsyslog.conf";
fi

##echo SSH_RETURN $SSH_RETURN;
#exit 1;
if [[ $(echo $SSH_RETURN |grep -i ‘Connection timed out during banner exchange’ | wc -l) -eq ‘1’ ]]; then
echo "rsyslogd $HOST:$PORT OK";
fi

if [[ $(echo $SSH_RETURN |grep -i ‘Connection refused’ | wc -l) -eq ‘1’ ]]; then
echo "rsyslogd $HOST:$PORT PROBLEM";
fi

#sleep 2;
#done


You can download a copy of the script check_log_server_status.sh here

Depending on the port the remote rsyslogd central logging server is using configure it in the script with respective port through the DELIMITER='@@', GREP_PORT='5145', CONNECT_TIMEOUT=5 values.

The delimiter is setup as usually in /etc/rsyslog.conf this the remote logging server for TCP IP is configured with @@ prefix to indicated TCP mode should be used.

Below is example from /etc/rsyslog.conf of how the rsyslogd server is configured:

[root@Server-hostA /root]# grep -i @@ /etc/rsyslogd.conf
# central remote Log server IP / port
*.* @@10.10.10.1:5145

To use the script on a machine, where you have a properly configured zabbix-agentd service host connected and reporting data to a zabbix-server monitoring server.

1. Set up the script under /usr/local/bin/check_log_server_status.sh

[root@Server-hostA /root ]# vim /usr/local/bin/check_log_server_status.sh

[root@Server-hostA /root ]# chmod +x /usr/local/bin/check_log_server_status.sh

2. Prepare userparameter_check_log_server.conf with log_server.check Item key

[root@Server-hostA zabbix_agentd.d]# cat userparameter_check_log_server.conf 
UserParameter=log_server.check, /usr/local/bin/check_log_server_status.sh

3. Set in Zabbix some Item such as on below screenshot


check-log-server-status-screenshot-linux-item-zabbix.png4. Create a Zabbix trigger 

check-log-server-status-trigger-logserver-is-unreachable-zabbix


The redded hided field in Expression field should be substituted with your actual hostname on which the monitor script will run.

Webserver farm behind Load Balancer Proxy or how to preserve incoming internet IP to local net IP Apache webservers by adding additional haproxy header with remoteip

Monday, April 18th, 2022

logo-haproxy-apache-remoteip-configure-and-check-to-have-logged-real-ip-address-inside-apache-forwarded-from-load-balancer

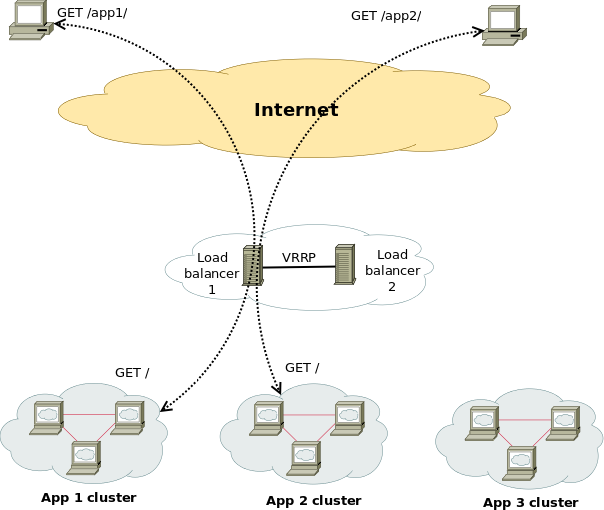
Having a Proxy server for Load Balancing is a common solutions to assure High Availability of Web Application service behind a proxy.
You can have for example 1 Apache HTTPD webservers serving traffic Actively on one Location (i.e. one city or Country) and 3 configured in the F5 LB or haproxy to silently keep up and wait for incoming connections as an (Active Failure) Backup solution

Lets say the Webservers usually are set to have local class C IPs as 192.168.0.XXX or 10.10.10.XXX and living in isolated DMZed well firewalled LAN network and Haproxy is configured to receive traffic via a Internet IP 109.104.212.13 address and send the traffic in mode tcp via a NATTed connection (e.g. due to the network address translation the source IP of the incoming connections from Intenet clients appears as the NATTed IP 192.168.1.50.

The result is that all incoming connections from haproxy -> webservers will be logged in Webservers /var/log/apache2/access.log wrongly as incoming from source IP: 192.168.1.50, meaning all the information on the source Internet Real IP gets lost.

load-balancer-high-availailibility-haproxy-apache
 

How to pass Real (Internet) Source IPs from Haproxy "mode tcp" to Local LAN Webservers  ?
 

Usually the normal way to work around this with Apache Reverse Proxies configured is to use HTTP_X_FORWARDED_FOR variable in haproxy when using HTTP traffic application that is proxied (.e.g haproxy.cfg has mode http configured), you have to add to listen listener_name directive or frontend Frontend_of_proxy

option forwardfor
option http-server-close

However unfortunately, IP Header preservation with X_FORWADED_FOR  HTTP-Header is not possible when haproxy is configured to forward traffic using mode tcp.

Thus when you're forced to use mode tcp to completely pass any traffic incoming to Haproxy from itself to End side, the solution is to
 

  • Use mod_remoteip infamous module that is part of standard Apache installs both on apache2 installed from (.deb) package  or httpd rpm (on redhats / centos).


1. Configure Haproxies to send received connects as send-proxy traffic


The idea is very simple all the received requests from outside clients to Haproxy are to be send via the haproxy to the webserver in a PROXY protocol string, this is done via send-proxy

             send-proxy  – send a PROXY protocol string

Rawly my current /etc/haproxy/haproxy.cfg looks like this:
 

global
        log /dev/log    local0
        log /dev/log    local1 notice
        chroot /var/lib/haproxy
        user haproxy
        group haproxy
        daemon
        maxconn 99999
        nbproc          1
        nbthread 2
        cpu-map         1 0
        cpu-map         2 1


defaults
        log     global
       mode    tcp


        timeout connect 5000
        timeout connect 30s
        timeout server 10s

    timeout queue 5s
    timeout tunnel 2m
    timeout client-fin 1s
    timeout server-fin 1s

                option forwardfor

    retries                 15


frontend http-in
                mode tcp

                option tcplog
        log global

                option logasap
                option forwardfor
                bind 109.104.212.130:80
    fullconn 20000
default_backend http-websrv
backend http-websrv
        balance source
                maxconn 3000

stick match src
    stick-table type ip size 200k expire 30m
        stick on src


        server ha1server-1 192.168.0.205:80 check send-proxy weight 254 backup
        server ha1server-2 192.168.1.15:80 check send-proxy weight 255
        server ha1server-3 192.168.2.30:80 check send-proxy weight 252 backup
        server ha1server-4 192.168.1.198:80 check send-proxy weight 253 backup
                server ha1server-5 192.168.0.1:80 maxconn 3000 check send-proxy weight 251 backup


frontend https-in
                mode tcp

                option tcplog
                log global

                option logasap
                option forwardfor
        maxconn 99999
           bind 109.104.212.130:443
        default_backend https-websrv
                backend https-websrv
        balance source
                maxconn 3000
        stick on src
    stick-table type ip size 200k expire 30m


                server ha1server-1 192.168.0.205:443 maxconn 8000 check send-proxy weight 254 backup
                server ha1server-2 192.168.1.15:443 maxconn 10000 check send-proxy weight 255
        server ha1server-3 192.168.2.30:443 maxconn 8000 check send-proxy weight 252 backup
        server ha1server-4 192.168.1.198:443 maxconn 10000 check send-proxy weight 253 backup
                server ha1server-5 192.168.0.1:443 maxconn 3000 check send-proxy weight 251 backup

listen stats
    mode http
    option httplog
    option http-server-close
    maxconn 10
    stats enable
    stats show-legends
    stats refresh 5s
    stats realm Haproxy\ Statistics
    stats admin if TRUE


After preparing your haproxy.cfg and reloading haproxy in /var/log/haproxy.log you should have the Real Source IPs logged in:
 

root@webserver:~# tail -n 10 /var/log/haproxy.log
Apr 15 22:47:34 pcfr_hware_local_ip haproxy[2914]: 159.223.65.16:58735 [15/Apr/2022:22:47:34.586] https-in https-websrv/ha1server-2 1/0/+0 +0 — 7/7/7/7/0 0/0
Apr 15 22:47:34 pcfr_hware_local_ip haproxy[2914]: 20.113.133.8:56405 [15/Apr/2022:22:47:34.744] https-in https-websrv/ha1server-2 1/0/+0 +0 — 7/7/7/7/0 0/0
Apr 15 22:47:35 pcfr_hware_local_ip haproxy[2914]: 54.36.148.248:15653 [15/Apr/2022:22:47:35.057] https-in https-websrv/ha1server-2 1/0/+0 +0 — 7/7/7/7/0 0/0
Apr 15 22:47:35 pcfr_hware_local_ip haproxy[2914]: 185.191.171.35:26564 [15/Apr/2022:22:47:35.071] https-in https-websrv/ha1server-2 1/0/+0 +0 — 8/8/8/8/0 0/0
Apr 15 22:47:35 pcfr_hware_local_ip haproxy[2914]: 213.183.53.58:42984 [15/Apr/2022:22:47:35.669] https-in https-websrv/ha1server-2 1/0/+0 +0 — 6/6/6/6/0 0/0
Apr 15 22:47:35 pcfr_hware_local_ip haproxy[2914]: 159.223.65.16:54006 [15/Apr/2022:22:47:35.703] https-in https-websrv/ha1server-2 1/0/+0 +0 — 7/7/7/7/0 0/0
Apr 15 22:47:36 pcfr_hware_local_ip haproxy[2914]: 192.241.113.203:30877 [15/Apr/2022:22:47:36.651] https-in https-websrv/ha1server-2 1/0/+0 +0 — 4/4/4/4/0 0/0
Apr 15 22:47:36 pcfr_hware_local_ip haproxy[2914]: 185.191.171.9:6776 [15/Apr/2022:22:47:36.683] https-in https-websrv/ha1server-2 1/0/+0 +0 — 5/5/5/5/0 0/0
Apr 15 22:47:36 pcfr_hware_local_ip haproxy[2914]: 159.223.65.16:64310 [15/Apr/2022:22:47:36.797] https-in https-websrv/ha1server-2 1/0/+0 +0 — 6/6/6/6/0 0/0
Apr 15 22:47:36 pcfr_hware_local_ip haproxy[2914]: 185.191.171.3:23364 [15/Apr/2022:22:47:36.834] https-in https-websrv/ha1server-2 1/1/+1 +0 — 7/7/7/7/0 0/0


2. Enable remoteip proxy protocol on Webservers

Login to each Apache HTTPD and to enable remoteip module run:
 

# a2enmod remoteip


On Debians, the command should produce a right symlink to mods-enabled/ directory
 

# ls -al /etc/apache2/mods-enabled/*remote*
lrwxrwxrwx 1 root root 31 Mar 30  2021 /etc/apache2/mods-enabled/remoteip.load -> ../mods-available/remoteip.load


3. Modify remoteip.conf file and allow IPs of haproxies or F5s


Configure RemoteIPTrustedProxy for every Source IP of haproxy to allow it to send X-Forwarded-For header to Apache,

Here are few examples, from my apache working config on Debian 11.2 (Bullseye):
 

webserver:~# cat remoteip.conf
RemoteIPHeader X-Forwarded-For
RemoteIPTrustedProxy 192.168.0.1
RemoteIPTrustedProxy 192.168.0.205
RemoteIPTrustedProxy 192.168.1.15
RemoteIPTrustedProxy 192.168.0.198
RemoteIPTrustedProxy 192.168.2.33
RemoteIPTrustedProxy 192.168.2.30
RemoteIPTrustedProxy 192.168.0.215
#RemoteIPTrustedProxy 51.89.232.41

On RedHat / Fedora other RPM based Linux distrubutions, you can do the same by including inside httpd.conf or virtualhost configuration something like:
 

<IfModule remoteip_module>
      RemoteIPHeader X-Forwarded-For
      RemoteIPInternalProxy 192.168.0.0/16
      RemoteIPTrustedProxy 192.168.0.215/32
</IfModule>


4. Enable RemoteIP Proxy Protocol in apache2.conf / httpd.conf or Virtualhost custom config
 

Modify both haproxy / haproxies config as well as enable the RemoteIP module on Apache webservers (VirtualHosts if such used) and either in <VirtualHost> block or in main http config include:

RemoteIPProxyProtocol On


5. Change default configured Apache LogFormat

In Domain Vhost or apache2.conf / httpd.conf

Default logging Format will be something like:
 

LogFormat "%h %l %u %t \"%r\" %>s %O \"%{Referer}i\" \"%{User-Agent}i\"" combined


or
 

LogFormat "%v:%p %h %l %u %t \"%r\" %>s %O \"%{Referer}i\" \"%{User-Agent}i\"" combined


Once you find it in /etc/apache2/apache2.conf / httpd.conf or Vhost, you have to comment out this by adding shebang infont of sentence make it look as follows:
 

LogFormat "%v:%p %a %l %u %t \"%r\" %>s %O \"%{Referer}i\" \"%{User-Agent}i\"" vhost_combined
LogFormat "%a %l %u %t \"%r\" %>s %O \"%{Referer}i\" \"%{User-Agent}i\"" combined
LogFormat "%a %l %u %t \"%r\" %>s %O" common
LogFormat "%{Referer}i -> %U" referer
LogFormat "%{User-agent}i" agent


The Changed LogFormat instructs Apache to log the client IP as recorded by mod_remoteip (%a) rather than hostname (%h). For a full explanation of all the options check the official HTTP Server documentation page apache_mod_config on Custom Log Formats.

and reload each Apache server.

on Debian:

# apache2ctl -k reload

On CentOS

# systemctl restart httpd


6. Check proxy protocol is properly enabled on Apaches


remoteip module will enable Apache to expect a proxy connect header passed to it otherwise it will respond with Bad Request, because it will detect a plain HTML request instead of Proxy Protocol CONNECT, here is the usual telnet test to fetch the index.htm page.

root@webserver:~# telnet localhost 80
Trying 127.0.0.1…
Connected to localhost.
Escape character is '^]'.
GET / HTTP/1.1

HTTP/1.1 400 Bad Request
Date: Fri, 15 Apr 2022 19:04:51 GMT
Server: Apache/2.4.51 (Debian)
Content-Length: 312
Connection: close
Content-Type: text/html; charset=iso-8859-1

<!DOCTYPE HTML PUBLIC "-//IETF//DTD HTML 2.0//EN">
<html><head>
<title>400 Bad Request</title>
</head><body>
<h1>Bad Request</h1>
<p>Your browser sent a request that this server could not understand.<br />
</p>
<hr>
<address>Apache/2.4.51 (Debian) Server at grafana.pc-freak.net Port 80</address>
</body></html>
Connection closed by foreign host.


root@webserver:~# telnet localhost 80
Trying 127.0.0.1…
Connected to localhost.
Escape character is '^]'.
HEAD / HTTP/1.1

HTTP/1.1 400 Bad Request
Date: Fri, 15 Apr 2022 19:05:07 GMT
Server: Apache/2.4.51 (Debian)
Connection: close
Content-Type: text/html; charset=iso-8859-1

Connection closed by foreign host.


To test it with telnet you can follow the Proxy CONNECT syntax and simulate you're connecting from a proxy server, like that:
 

root@webserver:~# telnet localhost 80
Trying 127.0.0.1…
Connected to localhost.
Escape character is '^]'.
CONNECT localhost:80 HTTP/1.0

HTTP/1.1 301 Moved Permanently
Date: Fri, 15 Apr 2022 19:13:38 GMT
Server: Apache/2.4.51 (Debian)
Location: https://zabbix.pc-freak.net
Cache-Control: max-age=900
Expires: Fri, 15 Apr 2022 19:28:38 GMT
Content-Length: 310
Connection: close
Content-Type: text/html; charset=iso-8859-1

<!DOCTYPE HTML PUBLIC "-//IETF//DTD HTML 2.0//EN">
<html><head>
<title>301 Moved Permanently</title>
</head><body>
<h1>Moved Permanently</h1>
<p>The document has moved <a href="https://zabbix.pc-freak.net">here</a>.</p>
<hr>
<address>Apache/2.4.51 (Debian) Server at localhost Port 80</address>
</body></html>
Connection closed by foreign host.

You can test with curl simulating the proxy protocol CONNECT with:

root@webserver:~# curl –insecure –haproxy-protocol https://192.168.2.30

<!DOCTYPE HTML PUBLIC "-//W3C//DTD HTML 4.01 Transitional//EN"
"http://w3.org/TR/html4/loose.dtd">
<html>
<head>
<meta name="generator" content="pc-freak.net tidy">
<script src="https://ssl.google-analytics.com/urchin.js" type="text/javascript">
</script>
<script type="text/javascript">
_uacct = "UA-2102595-3";
urchinTracker();
</script>
<script type="text/javascript">
var gaJsHost = (("https:" == document.location.protocol) ? "https://ssl." : "http://");
document.write(unescape("%3Cscript src='" + gaJsHost + "google-analytics.com/ga.js' type='text/javascript'%3E%3C/script%3E"));
</script>
<script type="text/javascript">
try {
var pageTracker = _gat._getTracker("UA-2102595-6");
pageTracker._trackPageview();
} catch(err) {}
</script>


      –haproxy-protocol
              (HTTP) Send a HAProxy PROXY protocol v1 header at the beginning of the connection. This is used by some load balancers and reverse proxies
              to indicate the client's true IP address and port.

              This option is primarily useful when sending test requests to a service that expects this header.

              Added in 7.60.0.


7. Check apache log if remote Real Internet Source IPs are properly logged
 

root@webserver:~# tail -n 10 /var/log/apache2/access.log

213.183.53.58 – – [15/Apr/2022:22:18:59 +0300] "GET /proxy/browse.php?u=https%3A%2F%2Fsteamcommunity.com%2Fmarket%2Fitemordershistogram%3Fcountry HTTP/1.1" 200 12701 "https://www.pc-freak.net" "Mozilla/5.0 (Windows NT 10.0; Win64; x64; rv:98.0) Gecko/20100101 Firefox/98.0"
88.198.48.184 – – [15/Apr/2022:22:18:58 +0300] "GET /blog/iq-world-rank-country-smartest-nations/?cid=1330192 HTTP/1.1" 200 29574 "-" "Mozilla/5.0 (compatible; DataForSeoBot/1.0; +https://dataforseo.com/dataforseo-bot)"
213.183.53.58 – – [15/Apr/2022:22:19:00 +0300] "GET /proxy/browse.php?u=https%3A%2F%2Fsteamcommunity.com%2Fmarket%2Fitemordershistogram%3Fcountry
HTTP/1.1" 200 9080 "https://www.pc-freak.net" "Mozilla/5.0 (Windows NT 10.0; Win64; x64; rv:98.0) Gecko/20100101 Firefox/98.0"
159.223.65.16 – – [15/Apr/2022:22:19:01 +0300] "POST //blog//xmlrpc.php HTTP/1.1" 200 5477 "-" "Mozilla/5.0 (Windows NT 10.0; Win64; x64) AppleWebKit/537.36 (KHTML, like Gecko) Chrome/89.0.4389.114 Safari/537.36"
159.223.65.16 – – [15/Apr/2022:22:19:02 +0300] "POST //blog//xmlrpc.php HTTP/1.1" 200 5477 "-" "Mozilla/5.0 (Windows NT 10.0; Win64; x64) AppleWebKit/537.36 (KHTML, like Gecko) Chrome/89.0.4389.114 Safari/537.36"
213.91.190.233 – – [15/Apr/2022:22:19:02 +0300] "POST /blog/wp-admin/admin-ajax.php HTTP/1.1" 200 1243 "https://www.pc-freak.net/blog/wp-admin/post.php?post=16754&action=edit" "Mozilla/5.0 (Windows NT 6.1; Win64; x64; rv:89.0) Gecko/20100101 Firefox/89.0"
46.10.215.119 – – [15/Apr/2022:22:19:02 +0300] "GET /images/saint-Paul-and-Peter-holy-icon.jpg HTTP/1.1" 200 134501 "https://www.google.com/" "Mozilla/5.0 (Windows NT 10.0; Win64; x64) AppleWebKit/537.36 (KHTML, like Gecko) Chrome/100.0.4896.75 Safari/537.36 Edg/100.0.1185.39"
185.191.171.42 – – [15/Apr/2022:22:19:03 +0300] "GET /index.html.latest/tutorials/tutorials/penguins/vestnik/penguins/faith/vestnik/ HTTP/1.1" 200 11684 "-" "Mozilla/5.0 (compatible; SemrushBot/7~bl; +http://www.semrush.com/bot.html)"

116.179.37.243 – – [15/Apr/2022:22:19:50 +0300] "GET /blog/wp-content/cookieconsent.min.js HTTP/1.1" 200 7625 "https://www.pc-freak.net/blog/how-to-disable-nginx-static-requests-access-log-logging/" "Mozilla/5.0 (compatible; Baiduspider-render/2.0; +http://www.baidu.com/search/spider.html)"
116.179.37.237 – – [15/Apr/2022:22:19:50 +0300] "GET /blog/wp-content/plugins/google-analytics-dashboard-for-wp/assets/js/frontend-gtag.min.js?ver=7.5.0 HTTP/1.1" 200 8898 "https://www.pc-freak.net/blog/how-to-disable-nginx-static-requests-access-log-logging/" "Mozilla/5.0 (compatible; Baiduspider-render/2.0; +http://www.baidu.com/search/spider.html)"


You see from above output remote Source IPs in green are properly logged, so haproxy Cluster is correctly forwarding connections passing on in the Haproxy generated Initial header the Real IP of its remote connect IPs.


Sum it up, What was done?


HTTP_X_FORWARD_FOR is impossible to set, when haproxy is used on mode tcp and all traffic is sent as received from TCP IPv4 / IPv6 Network stack, e.g. modifying any HTTP sent traffic inside the headers is not possible as this might break up the data.

Thus Haproxy was configured to send all its received data by sending initial proxy header with the X_FORWARDED usual Source IP data, then remoteip Apache module was used to make Apache receive and understand haproxy sent Header which contains the original Source IP via the send-proxy functionality and example was given on how to test the remoteip on Webserver is working correctly.

Finally you've seen how to check configured haproxy and webserver are able to send and receive the End Client data with the originator real source IP correctly and those Internet IP is properly logged inside both haproxy and apaches.
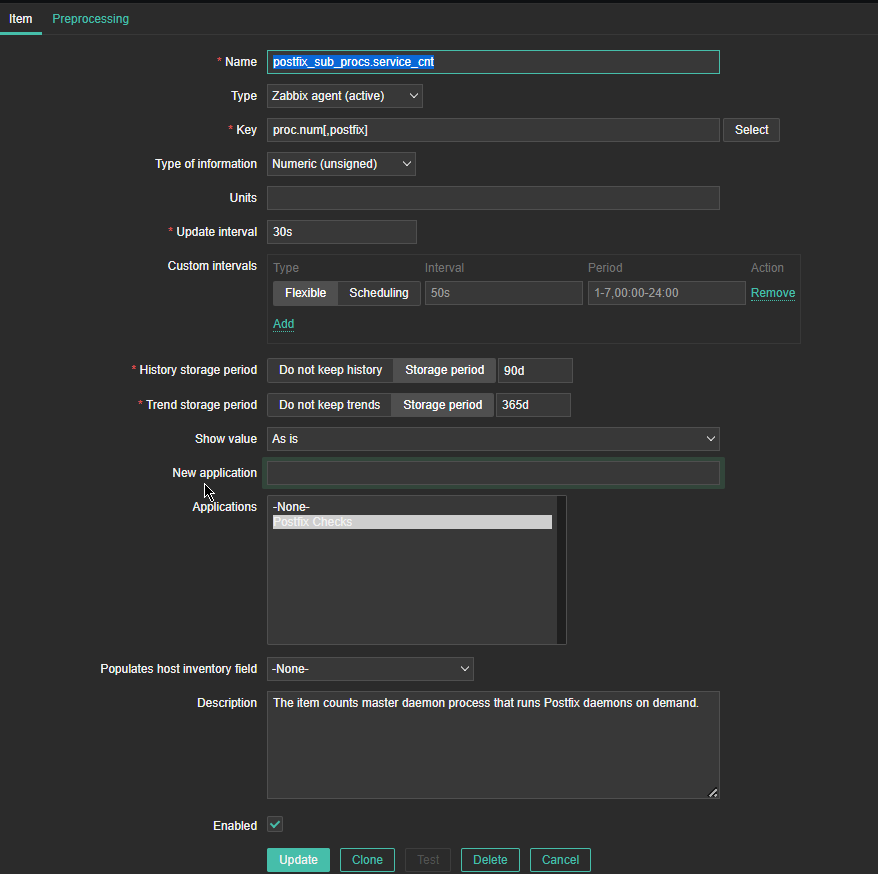
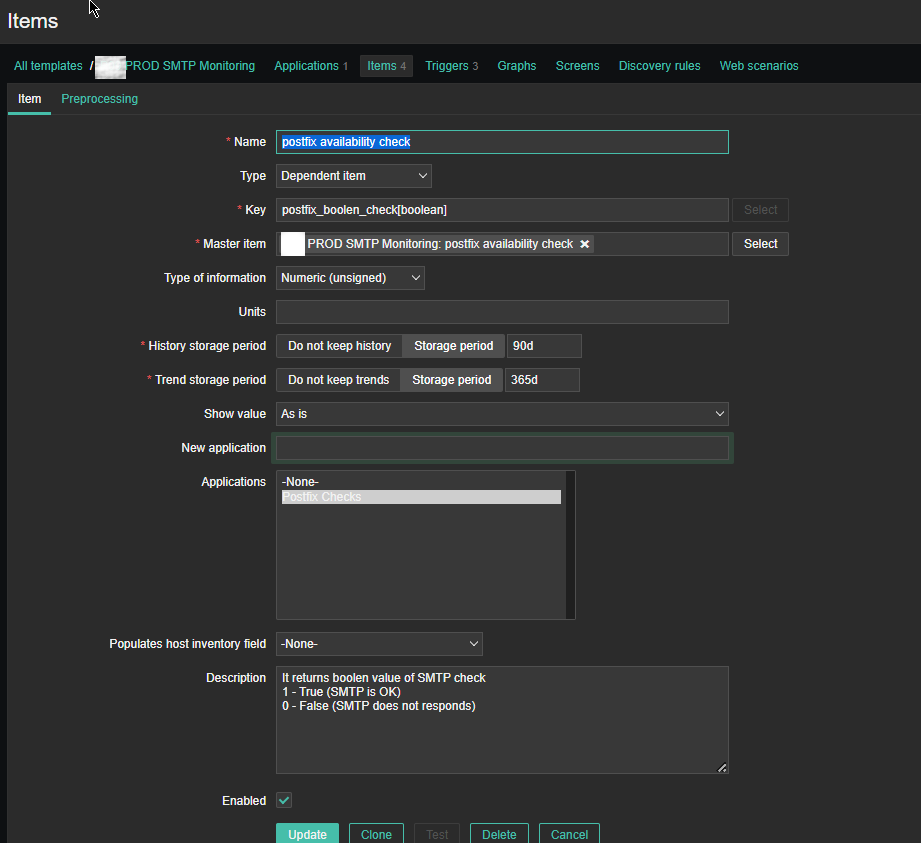
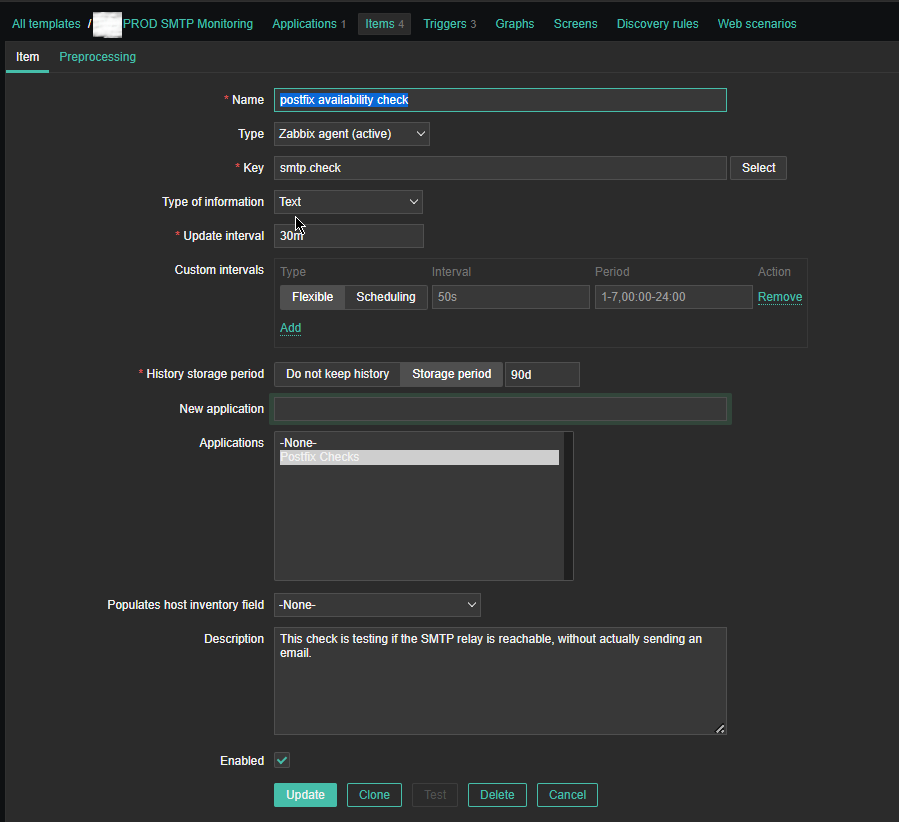
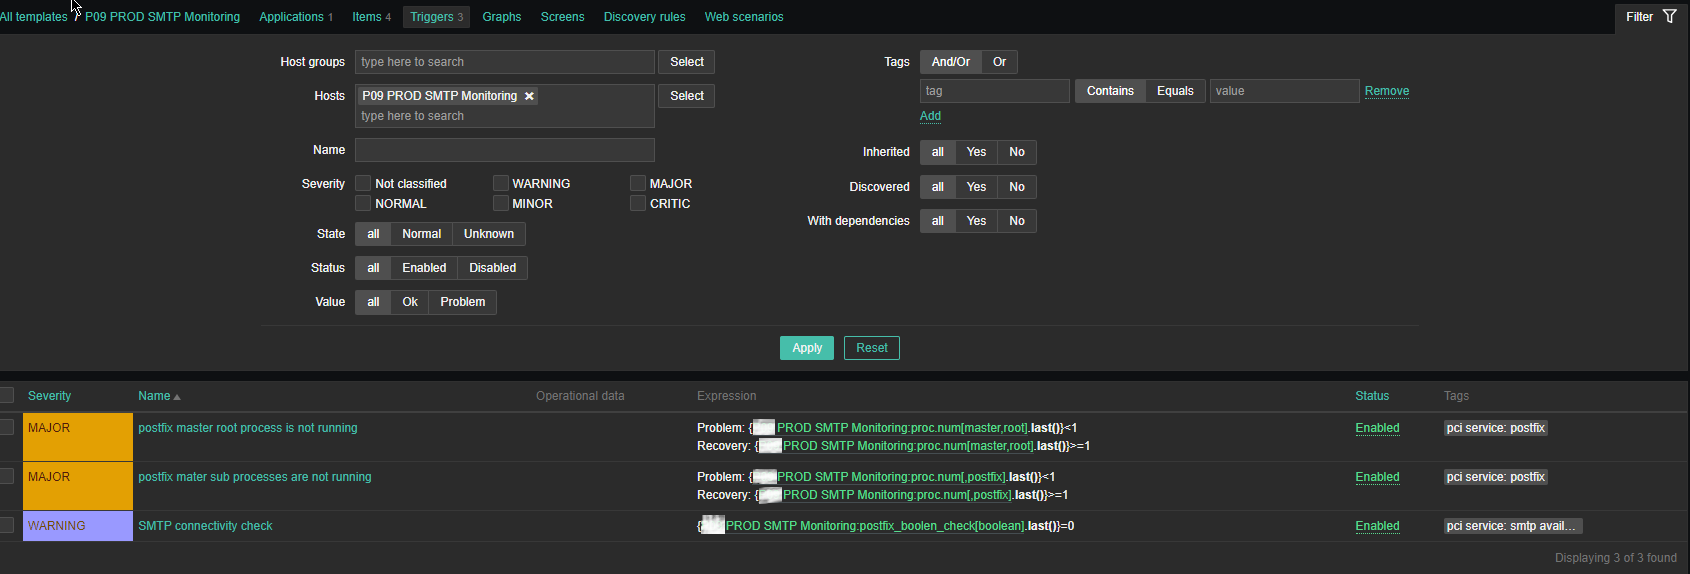
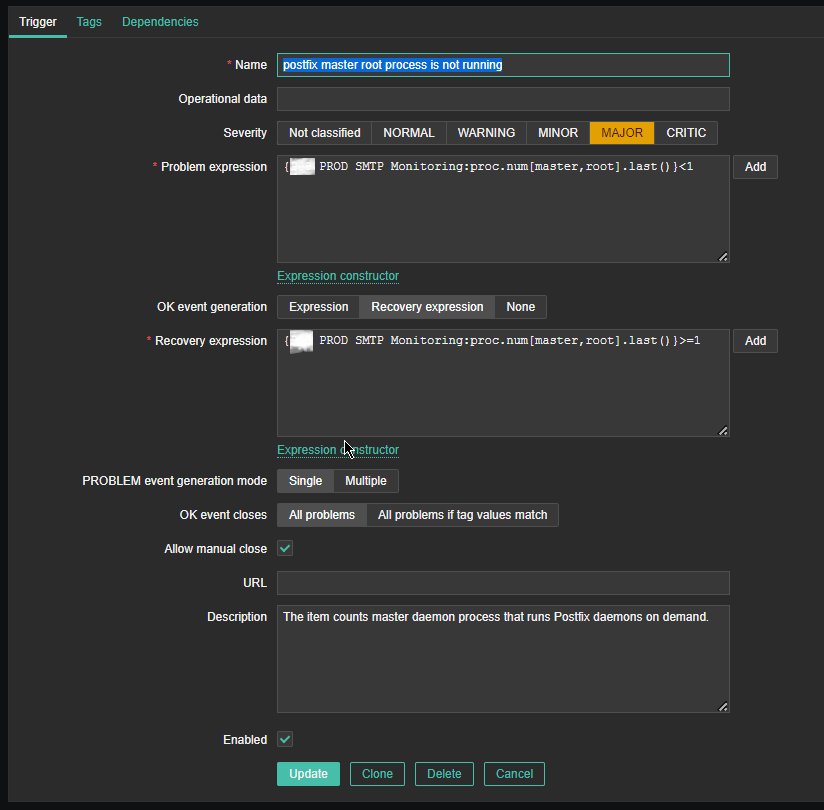
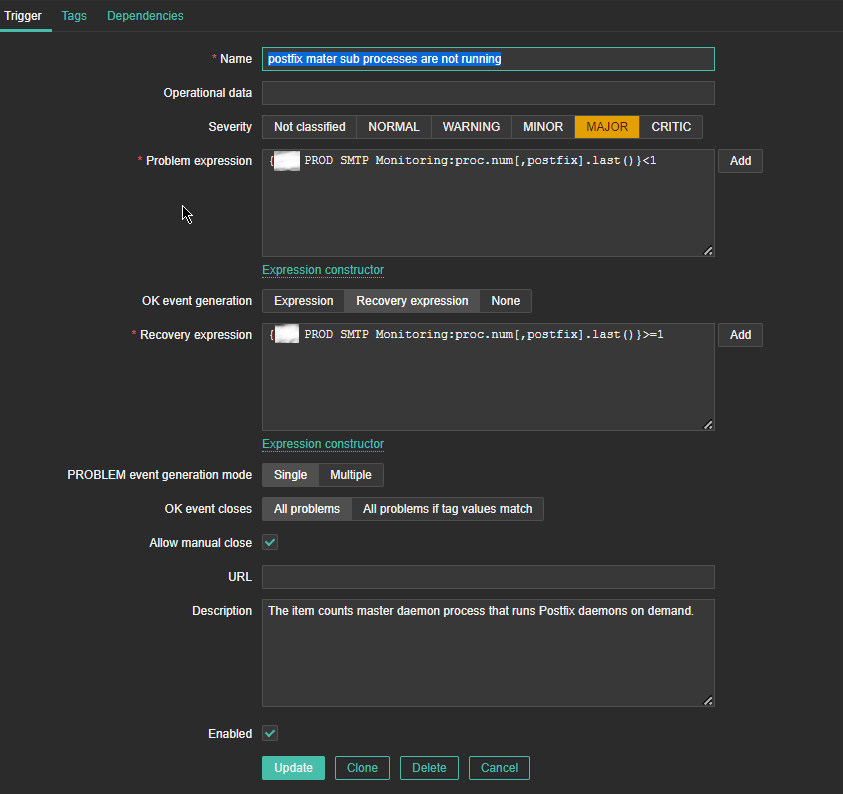
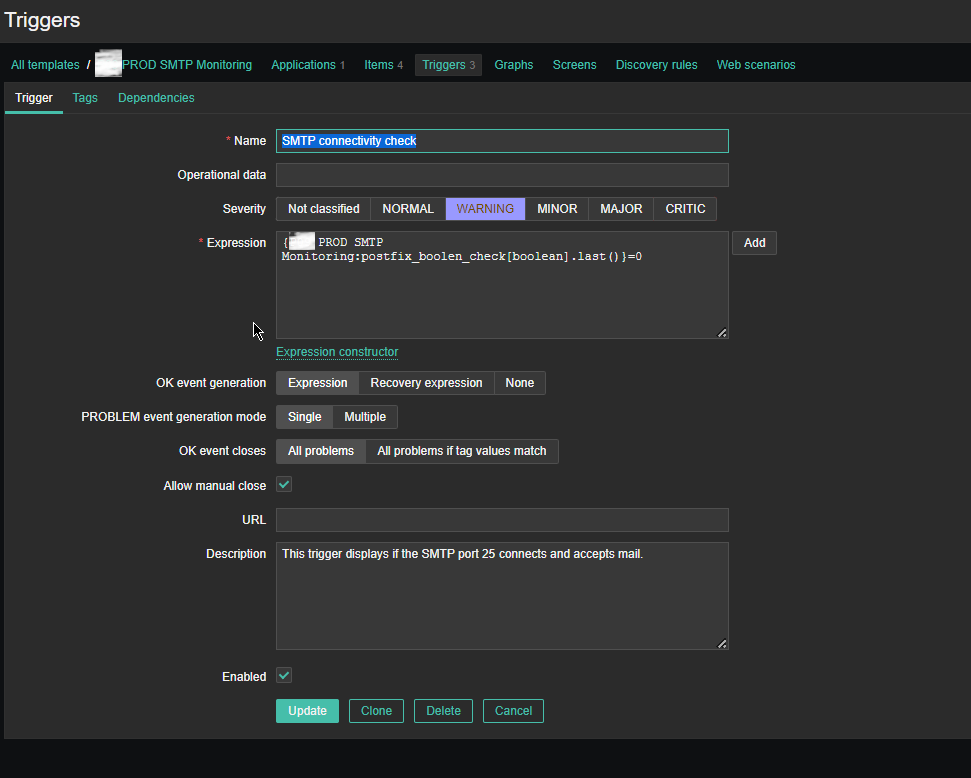
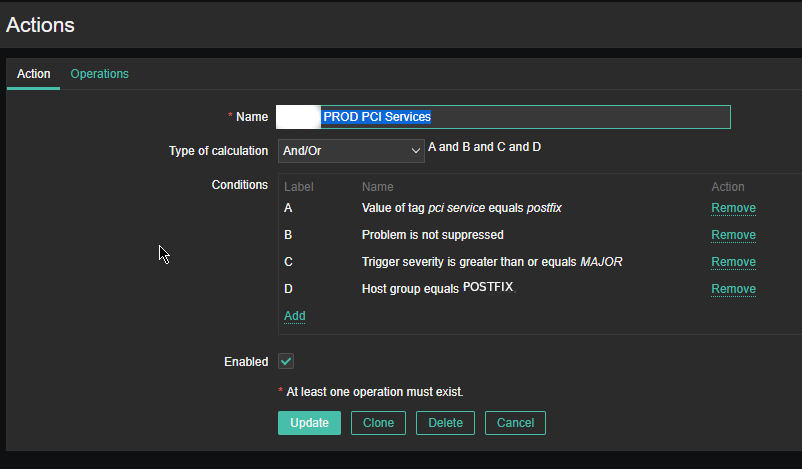
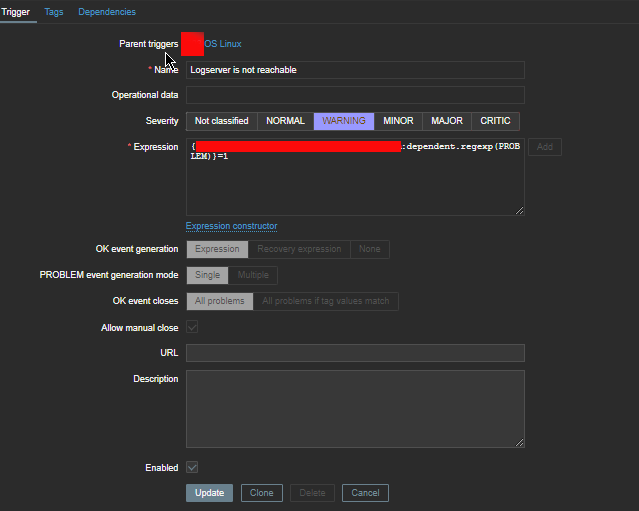
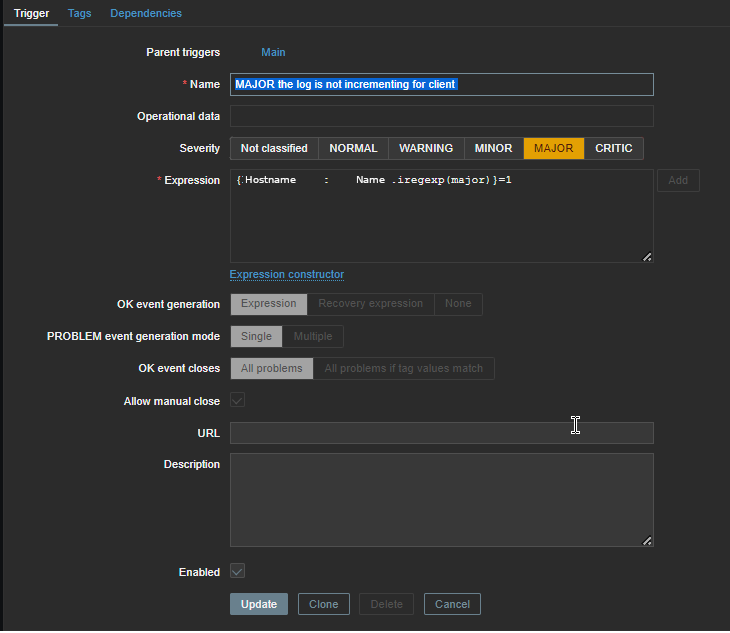
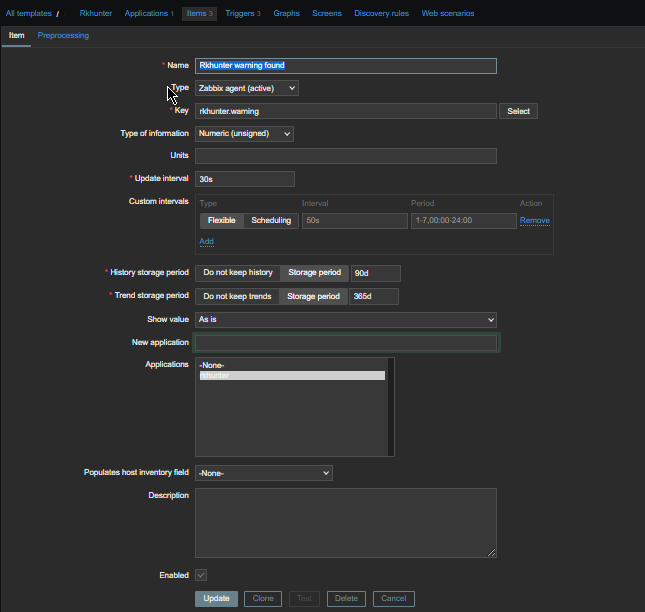
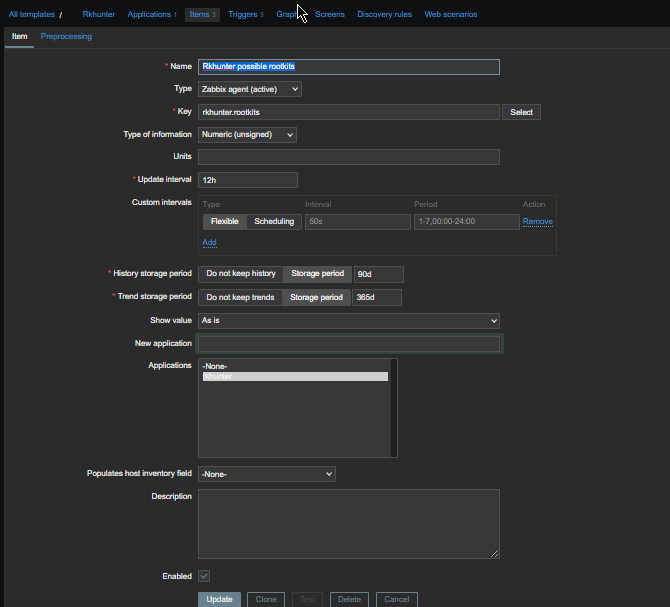
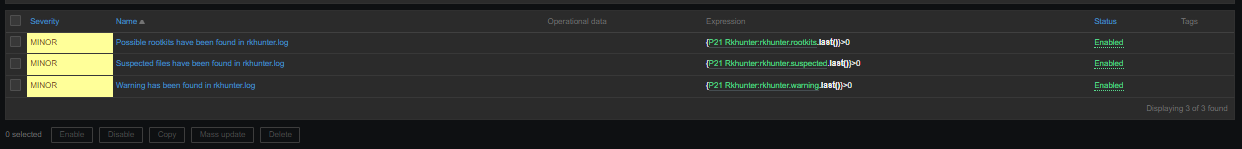
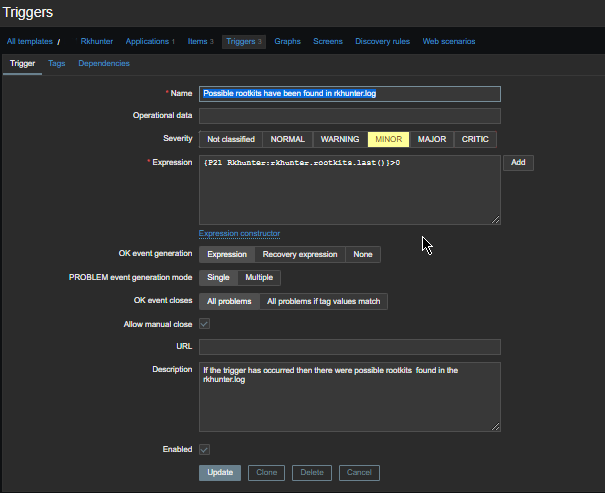
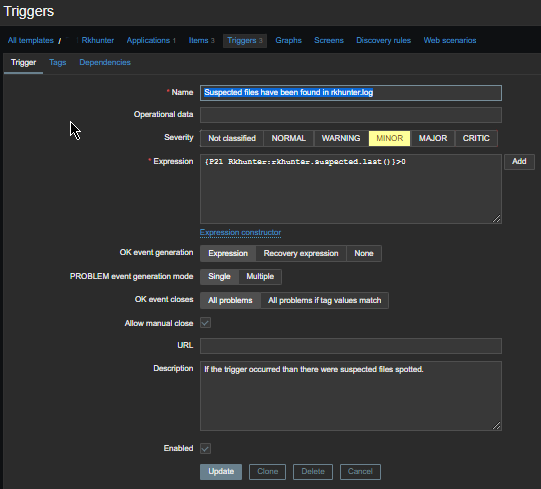
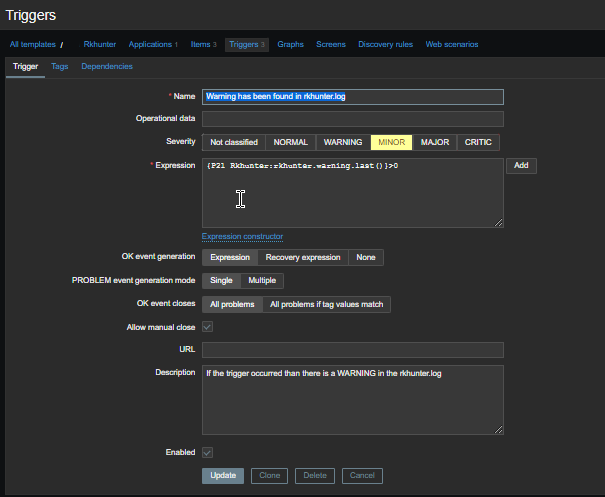
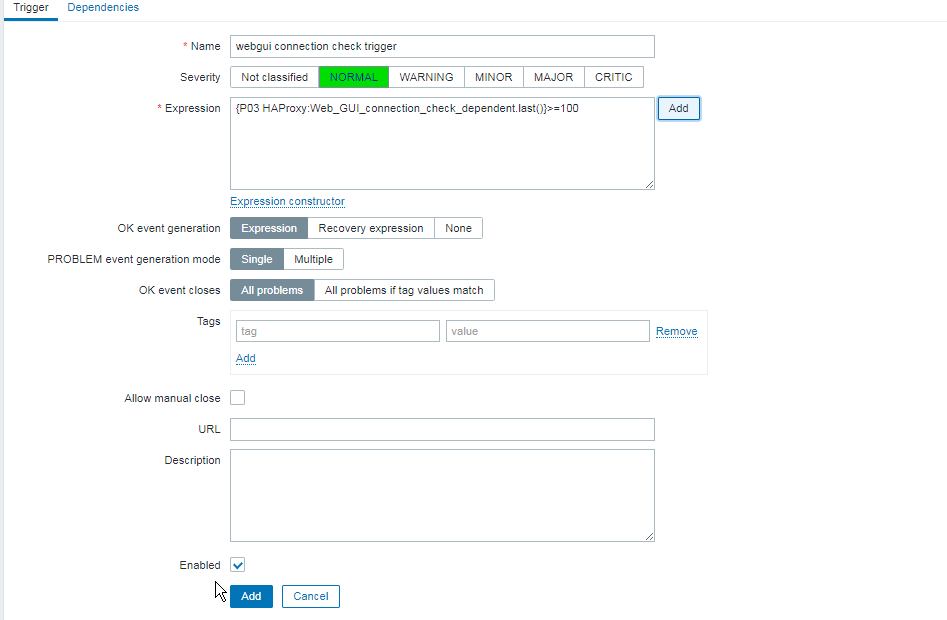
Monitor service log is continously growing with Zabbix on Windows with batch userparameter script and trigger Alert if log is unchanged

Thursday, March 17th, 2022

monitor-if-log-file-is-growing-with-zabbix-zabbix-userparameter-script-howto

Recently we had an inteteresting Monitoring work task to achieve. We have an Application that is constantly simulating encrypted connections traffic to a remote side machine and sending specific data on TCP/IP ports.
Communiucation between App Server A -> App Server B should be continous and if all is working as expected App Server A messages output are logged in the Application log file on the machine which by the way Runs
Windows Server 2020.

Sometimes due to Network issues this constant reconnections from the Application S. A to the remote checked machine TCP/IP ports gets interrupted due to LAN issues or a burned Network Switch equipment, misconfiguration on the network due to some Network admin making stoopid stuff etc..

Thus it was important to Monitor somehow whether the log is growing or not and feed the output of whether Application log file is growing or it stuck to a Central Zabbix Server. 
To be able to better understand the task, lets divide the desired outcome in few parts on required:

1. Find The latest file inside a folder C:\Path-to-Service\Monitoring\Log\
2. Open the and check it is current logged records and log the time
3. Re-open file in a short while and check whether in few seconds new records are written
4. Report the status out to Zabbix
5. Make Zabbix Item / Trigger / Action in case if monitored file is not growing

In below article I'll briefly explain how Monitoring a Log on a Machine for growing was implemented using a pure good old WIN .BAT (.batch) script and Zabbix Userparameter key


1. Enable userparameter script for Local Zabbix-Agent on the Windows 10 Server Host


Edit Zabbix config file usually on Windows Zabbix installs file is named:

zabbix_agentd.win ]


Uncomment the following lines to enable userparameter support for zabbix-agentd:


# Include=c:\zabbix\zabbix_agentd.userparams.conf

Include=c:\zabbix\zabbix_agentd.conf.d\

# Include=c:\zabbix\zabbix_agentd.conf.d\*.conf


2. Create folders for userparameter script and for the userparameter.conf

Before creating userparameter you can to create the folder and grant permissions

Folder name under C:\Zabbix -> zabbix_agentd.conf.d

If you don't want to use Windows Explorer) but do it via cmd line:

C:\Users\LOGUser> mkdir \Zabbix\zabbix_agentd.conf\
C:\User\LOGUser> mkdir \Zabbix\zabbix_scripts\


3. Create Userparameter with some name file ( Userparameter-Monitor-Grow.conf )

In the directory C:\Zabbix\zabbix_agentd.conf.d you should create a config file like:
Userparameter-Monitor-Grow.conf and in it you should have a standard userparameter key and script so file content is:

UserParameter=service.check,C:\Zabbix\zabbix_scripts\GROW_LOG_MONITOR-USERPARAMETER.BAT


4. Create the Batch script that will read the latest file in the service log folder and will periodically check and report to zabbix that file is changing

notepad C:\Zabbix\zabbix_scripts\GROW_LOG_MONITOR-USERPARAMETER.BAT

REM "SCRIPT MONITOR IF FILE IS GROWING OR NOT"
@echo off

set work_dir=C:\Path-to-Service\Monitoring\Log\

set client=client Name

set YYYYMMDD=%DATE:~10,4%%DATE:~4,2%%DATE:~7,2%

set name=csv%YYYYMMDD%.csv

set mytime=%TIME:~0,8%

for %%I in (..) do set CurrDirName=%%~nxI


setlocal EnableDelayedExpansion

set "line1=findstr /R /N "^^" %work_dir%\output.csv | find /C ":""


for /f %%a in ('!line1!') do set number1=%%a

set "line2=findstr /R /N "^^" %work_dir%\%name% | find /C ":""


for /f %%a in ('!line2!') do set number2=%%a


IF  %number1% == %number2% (

echo %YYYYMMDD% %mytime% MAJOR the log is not incrementing for %client%

echo %YYYYMMDD% %mytime% MAJOR the log is not incrementing for %client% >> monitor-grow_err.log

) ELSE (

echo %YYYYMMDD% %mytime% NORMAL the log is incrementing for %client%

SETLOCAL DisableDelayedExpansion

del %work_dir%\output.csv

FOR /F "usebackq delims=" %%a in (`"findstr /n ^^ %work_dir%\%name%"`) do (

    set "var=%%a"

    SETLOCAL EnableDelayedExpansion

    set "var=!var:*:=!"

    echo(!var! >> %work_dir%\output.csv

    ENDLOCAL

)

)


To download GROW_LOG_MONITOR-USERPARAMETER.BAT click here.
The script needs to have configured the path to directory containing multiple logs produced by the Monitored Application.
As prior said it will, list the latest created file based on DATE timestamp in the folder will output a simple messages:

If the log file is being fed with data the script will output to output.csv messages continuously, either:

%%mytime%% NORMAL the log is incrementing for %%client%%

Or if the Monitored application log is not writting anything for a period it will start writting messages

%%mytime%%mytime MAJOR the log is not incrementing for %client%

The messages will also be sent in Zabbix.

Before saving the script make sure you modify the Full Path location to the Monitored file for growing, i.e.:

set work_dir=C:\Path-to-Service\Monitoring\Log\


5. Create The Zabbix Item

Set whatever service.check name you would like and a check interval to fetch the info from the userparameter (if you're dealing with very large log files produced by Monitored log of application, then 10 minutes might be too frequent, in most cases 10 minutes should be fine)
monitor-if-log-grows-windows-zabbix-item-service-check-screenshot
 

6. Create Zabbix Trigger


You will need a Trigger something similar to below:

Now considering that zabbix server receives correctly data from the client and the monitored log is growing you should in Zabbix:

%%mytime%% NORMAL the log is incrementing for %%client%%


7. Lastly create an Action to send Email Alert if log is not growing

Linux script to periodically log enabled systemctl services, configured network IPs and routings, server established connections and iptables firewall rules

Tuesday, January 25th, 2022

bash-script-command-line-script-logo

For those who are running some kind of server be it virtual or physical, where multiple people or many systemins have access, sometimes it could be quite a mess as someone due to miscommunication or whatever could change something on the configured Network Ethernet interfaces, or configured routing tables, or simply issue an update which might change the set of automatically set to run systemctl services due to update. Such changes on a Linux server Operating system often can remain unnoticed and could cause quite a harm. Even when the change is noticed the logical question occurs what was the previous network route on the server or what kind of network was configured on Ethernet interface ethX etc. 
Problems like the described where, pretty common in many public Private Clouds or VMWare / XEN based Hypervisors that host multiple  Virtual machines, for that reason I've developed a small script which is pretty dumb on the first glimpse but mostly useful as it keeps historical records of such important information.
 

#!/bin/sh
# script to show configured services on system, configured IPs, netstat state and network routes
# Script to be used during CentOS and Redhat Enterprise Linux RPM package updates with yum

output_file=network_ip_routes_services_status;
ddate=$(date '+%Y-%m-%d_%H-%M-%S');
iptables=$(which iptables);
if [ ! -d /root/logs/ ]; then
mkdir /root/logs/;
fi

echo "STARTED: $(date '+%Y-%m-%d_%H-%M-%S'):" | tee -a /root/logs/$output_file-$(hostname)-$ddate.log
echo -e "# systemctl list-unit-files\n" | tee -a /root/logs/$output_file-$(hostname)-$ddate.log
systemctl list-unit-files –type=service | grep enabled | tee -a /root/logs/$output_file-$(hostname)-$ddate.log
echo -e '# systemctl | grep ".service" | grep "running"\n' | tee -a /root/logs/$output_file-$(hostname)-$ddate.log
systemctl | grep ".service" | grep "running" | tee -a /root/logs/$output_file-$(hostname)-$ddate.log
echo -e "# netstat -tulpn\n" | tee -a /root/logs/$output_file-$(hostname)-$ddate.log
netstat -tulpn | tee -a /root/logs/$output_file-$(hostname)-$ddate.log
echo -e "# netstat -r\n" | tee -a /root/logs/$output_file-$(hostname)-$ddate.log
netstat -r | tee -a /root/logs/$output_file-$(hostname)-$ddate.log
echo -e "# ip a s\n" | tee -a /root/logs/$output_file-$(hostname)-$ddate.log
ip a s | tee -a /root/logs/$output_file-$(hostname)-$ddate.log
echo -e "# /sbin/route -n\n" | tee -a /root/logs/$output_file-$(hostname)-$ddate.log
/sbin/route -n | tee -a /root/logs/$output_file-$(hostname)-$ddate.log
echo -e "# $iptables -L -n\n" | tee -a /root/logs/$output_file-$(hostname)-$ddate.log
echo -e "# $iptables -t nat -L" | tee -a /root/logs/$output_file-$(hostname)-$ddate.log
$iptables -L -n | tee -a /root/logs/$output_file-$(hostname)-$ddate.log
$iptables -t nat -L | tee -a /root/logs/$output_file-$(hostname)-$ddate.log
echo "ENDED $(date '+%Y-%m-%d_%H-%M-%S'):" | tee -a /root/logs/$output_file-$(hostname)-$ddate.log


Script produces its logs inside  /root/logs/network_ip_routes_services_status*hostname*currentdate*.log, put the script inside /root/ or wherever you like.

To keep an eye how network routing or ip configuration or firewall changed or there was a peak with the established connections towards daemons running on host (lets say requiring a machine upgrade), I've set the script to run as usually via cron job at the end of the predefined cron job tasks, like so:

# crontab -u root -e
# periodic dump and log network routing tables, netstat and systemctl list-unit-files
*/1 01 01,25 * * /root/show_running_services_netstat_ips_route1.sh 2>&1 >/dev/null

You can download a copy of show_running_services_netstat_ips_route1.sh script here.
The script is written without much of efficiency on mind, as you can see the with the multiple tee -a and for critical hosts it might be a good idea to rewrite it to use '>>' OPERAND instead, anyhows as most machines today are pretty powerful it doesn't really matter much.

Of course today such a script is quite archaic, as most big corporations are using much more complex monitoring software such as Zabbix, Prometheus or if some kind of Elastic Search is used Kibana etc. but for a basic needs and even for a double checking and comparing with other more advanced monitoring tools  (in case if monitoring tools  database gets damaged or temporary down until backupped), still I think such an oldschool simple monitoring script can be of use.

A good addition to that if you use a central logging server is to set another cron to periodically synchronize produced /root/logs/* to somewhere, here is how to do it with simple rsync (considering your host is configured to login with a user without password with ssh key authentication).

# HOSTNAME=$(hostname); rsync -axHv –ignore-existing -e 'ssh -p 22' /bashscripts/  -q -i –out-format="%t %f %b" –log-file=/var/log/rsync_sync_jobs.log –info=progress2 root@BACKUP_SERVER_HOST:/$(HOSTNAME)-logs/

Once something strange occurs with the machine, like the machine needs to be rebuild

I would be glad to hear if some of my readers uses some useful script which I can adopt myself. Cheers  🙂

Zabbix rkhunter monitoring check if rootkits trojans and viruses or suspicious OS activities are detected

Wednesday, December 8th, 2021

monitor-rkhunter-with-zabbix-zabbix-rkhunter-check-logo

If you're using rkhunter to monitor for malicious activities, a binary changes, rootkits, viruses, malware, suspicious stuff and other famous security breach possible or actual issues, perhaps you have configured your machines to report to some Email.
But what if you want to have a scheduled rkhunter running on the machine and you don't want to count too much on email alerting (especially because email alerting) makes possible for emails to be tracked by sysadmin pretty late?

We have been in those situation and in this case me and my dear colleague Georgi Stoyanov developed a small rkhunter Zabbix userparameter check to track and Alert if any traces of "Warning"''s are mateched in the traditional rkhunter log file /var/log/rkhunter/rkhunter.log

To set it up and use it is pretty use you will need to have a recent version of zabbix-agent installed on the machine and connected to a Zabbix server, in my case this is:

[root@centos ~]# rpm -qa |grep -i zabbix-agent
zabbix-agent-4.0.7-1.el7.x86_64

 placed inside /etc/zabbix/zabbix_agentd.d/userparameter_rkhunter_warning_check.conf

[root@centos /etc/zabbix/zabbix_agentd.d ]# cat userparameter_rkhunter_warning_check.conf
# userparameter script to check if any Warning is inside /var/log/rkhunter/rkhunter.log and if found to trigger Zabbix alert
UserParameter=rkhunter.warning, (TODAY=$(date |awk '{ print $1" "$2" "$3 }'); if [ $(cat /var/log/rkhunter/rkhunter.log | awk “/$TODAY/,EOF” | /bin/grep -i ‘\[ Warning \]’ | /usr/bin/wc -l) != ‘0’ ]; then echo 1; else echo 0; fi)
UserParameter=rkhunter.suspected,(/bin/grep -i 'Suspect files: ' /var/log/rkhunter/rkhunter.log|tail -n 1| awk '{ print $4 }')
UserParameter=rkhunter.rootkits,(/bin/grep -i 'Possible rootkits: ' /var/log/rkhunter/rkhunter.log|tail -n 1| awk '{ print $4 }')


2. Prepare Rkhunter Template, Triggers and Items


In Zabbix Server that you access from web control interface, you will have to prepare a new template called lets say Rkhunter with the necessery Triggers and Items


2.1 Create Rkhunter Items
 

On Zabbix Server side, uou will have to configure 3 Items for the 3 configured userparameter above script keys, like so:

rkhunter-items-zabbix-screenshot.png

  • rkhunter.suspected Item configuration


rkhunter-suspected-files

  • rkhunter.warning Zabbix Item config

rkhunter-warning-found-check-zabbix

  • rkhunter.rootkits Zabbix Item config


    rkhunter-zabbix-possible-rootkits-item1

    2.2 Create Triggers
     

You need to have an overall of 3 triggers like in below shot:

zabbix-rkhunter-all-triggers-screenshot
 

  • rkhunter.rootkits Trigger config

rkhunter-rootkits-trigger-zabbix1

  • rkhunter.suspected Trigger cfg

rkhunter-suspected-trigger-zabbix1

  • rkhunter warning Trigger cfg

rkhunter-warning-trigger1

3. Reload zabbix-agent and test the keys


It is necessery to reload zabbix agent for the new userparameter to start to be sent to remote zabbix server (through a proxy if you have one configured).

[root@centos ~]# systemctl restart zabbix-agent


To make the zabbix-agent send the keys to the server you can use zabbix_sender to have the test tool you will have to have installed (zabbix-sender) on the server.

To trigger a manualTest if you happen to have some problems with the key which shouldn''t be the case you can sent a value to the respectve key with below command:

[root@centos ~ ]# zabbix_sender -vv -c "/etc/zabbix/zabbix_agentd.conf" -k "khunter.warning" -o "1"


Check on Zabbix Server the sent value is received, for any oddities as usual check what is inside  /var/log/zabbix/zabbix_agentd.log for any errors or warnings.

How to automate open xen Hypervisor Virtual Machines backups shell script

Tuesday, June 22nd, 2021

openxen-backup-logo As a sysadmin that have my own Open Xen Debian Hypervisor running on a Lenovo ThinkServer few months ago due to a human error I managed to mess up one of my virtual machines and rebuild the Operating System from scratch and restore files service and MySQl data from backup that really pissed me of and this brought the need for having a decent Virtual Machine OpenXen backup solution I can implement on the Debian ( Buster) 10.10 running the free community Open Xen version 4.11.4+107-gef32c7afa2-1. The Hypervisor is a relative small one holding just 7 VM s:

HypervisorHost:~#  xl list
Name                                        ID   Mem VCPUs      State   Time(s)
Domain-0                                     0 11102    24     r—–  214176.4
pcfrxenweb                                  11 12288     4     -b—-  247425.5
pcfrxen                                     12 16384    10     -b—-  1371621.4
windows7                                    20  4096     2     -b—-   97887.2
haproxy2                                    21  4096     2     -b—-   11806.9
jitsi-meet                                  22  2048     2     -b—-   12843.9
zabbix                                      23  2048     2     -b—-   20275.1
centos7                                     24  2040     2     -b—-   10898.2

HypervisorHost:~# xl list|grep -v 'Name ' |grep  -v 'Domain-0'  |wc -l
7


The backup strategy of the script is very simple to shutdown the running VM machine, make a copy with rsync to a backup location the image of each of the Virtual Machines in a bash shell loop for each virtual machine shown in output of xl command and backup to a preset local directory in my case this is /backups/ the backup of each virtual machine is produced within a separate backup directory with a respective timestamp. Backup VM .img files are produced in my case to mounted 2x external attached hard drives each of which is a 4 Terabyte Seagate Plus Backup (Storage). The original version of the script was made to be a slightly different by Zhiqiang Ma whose script I used for a template to come up with my xen VM backup solution. To prevent the Hypervisor's load the script is made to do it with a nice of (nice -n 10) this might be not required or you might want to modify it to better suit your needs. Below is the script itself you can fetch a copy of it /usr/sbin/xen_vm_backups.sh :

#!/bin/bash

# Author: Zhiqiang Ma (http://www.ericzma.com/)
# Modified to work with xl and OpenXen by Georgi Georgiev – https://pc-freak.net
# Original creation dateDec. 27, 2010
# Script takes all defined vms under xen_name_list and prepares backup of each
# after shutting down the machine prepares archive and copies archive in externally attached mounted /backup/disk1 HDD
# Latest update: 08.06.2021 G. Georgiev – hipo@pc-freak.net

mark_file=/backups/disk1/tmp/xen-bak-marker
log_file=/var/log/xen/backups/bak-$(date +%Y_%m_%d).log
err_log_file=/var/log/xen/backups/bak_err-$(date +%H_%M_%Y_%m_%d).log
xen_dir=/xen/domains
xen_vmconfig_dir=/etc/xen/
local_bak_dir=/backups/disk1/tmp
#bak_dir=xenbak@backup_host1:/lhome/xenbak
bak_dir=/backups/disk1/xen-backups/xen_images/$(date +%Y_%m_%d)/xen/domains
#xen_name_list="haproxy2 pcfrxenweb jitsi-meet zabbix windows7 centos7 pcfrxenweb pcfrxen"
xen_name_list="windows7 haproxy2 jitsi-meet zabbix centos7"

if [ ! -d /var/log/xen/backups ]; then
echo mkdir -p /var/log/xen/backups
 mkdir -p /var/log/xen/backups
fi

if [ ! -d $bak_dir ]; then
echo mkdir -p $bak_dir
 mkdir -p $bak_dir

fi


# check whether bak runned last week
if [ -e $mark_file ] ; then
        echo  rm -f $mark_file
 rm -f $mark_file
else
        echo  touch $mark_file
 touch $mark_file
  # exit 0
fi

# set std and stderr to log file
        echo mv $log_file $log_file.old
       mv $log_file $log_file.old
        echo mv $err_log_file $err_log_file.old
       mv $err_log_file $err_log_file.old
        echo "exec 2> $err_log_file"
       exec 2> $err_log_file
        echo "exec > $log_file"
       exec > $log_file


# check whether the VM is running
# We only backup running VMs

echo "*** Check alive VMs"

xen_name_list_tmp=""

for i in $xen_name_list
do
        echo "/usr/sbin/xl list > /tmp/tmp-xen-list"
        /usr/sbin/xl list > /tmp/tmp-xen-list
  grepinlist=`grep $i" " /tmp/tmp-xen-list`;
  if [[ “$grepinlist” == “” ]]
  then
    echo $i is not alive.
  else
    echo $i is alive.
    xen_name_list_tmp=$xen_name_list_tmp" "$i
  fi
done

xen_name_list=$xen_name_list_tmp

echo "Alive VM list:"

for i in $xen_name_list
do
   echo $i
done

echo "End alive VM list."

###############################
date
echo "*** Backup starts"

###############################
date
echo "*** Copy VMs to local disk"

for i in $xen_name_list
do
  date
  echo "Shutdown $i"
        echo  /usr/sbin/xl shutdown $i
        /usr/sbin/xl shutdown $i
        if [ $? != ‘0’ ]; then
                echo 'Not Xen Disk image destroying …';
                /usr/sbin/xl destroy $i
        fi
  sleep 30

  echo "Copy $i"
  echo "Copy to local_bak_dir: $local_bak_dir"
      echo /usr/bin/rsync -avhW –no-compress –progress $xen_dir/$i/{disk.img,swap.img} $local_bak_dir/$i/
     time /usr/bin/rsync -avhW –no-compress –progress $xen_dir/$i/{disk.img,swap.img} $local_bak_dir/$i/
      echo /usr/bin/rsync -avhW –no-compress –progress $xen_vmconfig_dir/$i.cfg $local_bak_dir/$i.cfg
     time /usr/bin/rsync -avhW –no-compress –progress $xen_vmconfig_dir/$i.cfg $local_bak_dir/$i.cfg
  date
  echo "Create $i"
  # with vmmem=1024"
  # /usr/sbin/xm create $xen_dir/vm.run vmid=$i vmmem=1024
          echo /usr/sbin/xl create $xen_vmconfig_dir/$i.cfg
          /usr/sbin/xl create $xen_vmconfig_dir/$i.cfg
## Uncomment if you need to copy with scp somewhere
###       echo scp $log_file $bak_dir/xen-bak-111.log
###      echo  /usr/bin/rsync -avhW –no-compress –progress $log_file $local_bak_dir/xen-bak-111.log
done

####################
date
echo "*** Compress local bak vmdisks"

for i in $xen_name_list
do
  date
  echo "Compress $i"
      echo tar -z -cfv $bak_dir/$i-$(date +%Y_%m_%d).tar.gz $local_bak_dir/$i-$(date +%Y_%m_%d) $local_bak_dir/$i.cfg
     time nice -n 10 tar -z -cvf $bak_dir/$i-$(date +%Y_%m_%d).tar.gz $local_bak_dir/$i/ $local_bak_dir/$i.cfg
    echo rm -vf $local_bak_dir/$i/ $local_bak_dir/$i.cfg
    rm -vrf $local_bak_dir/$i/{disk.img,swap.img}  $local_bak_dir/$i.cfg
done

####################
date
echo "*** Copy local bak vmdisks to remote machines"

copy_remote () {
for i in $xen_name_list
do
  date
  echo "Copy to remote: vm$i"
        echo  scp $local_bak_dir/vmdisk0-$i.tar.gz $bak_dir/vmdisk0-$i.tar.gz
done

#####################
date
echo "Backup finishes"
        echo scp $log_file $bak_dir/bak-111.log

}

date
echo "Backup finished"


Things to configure before start using using the script to prepare backups for you is the xen_name_list variable

#  directory skele where to store already prepared backups
bak_dir=/backups/disk1/xen-backups/xen_images/$(date +%Y_%m_%d)/xen/domains

# The configurations of the running Xen Virtual Machines
xen_vmconfig_dir=/etc/xen/
# a local directory that will be used for backup creation ( I prefer this directory to be on the backup storage location )
local_bak_dir=/backups/disk1/tmp
#bak_dir=xenbak@backup_host1:/lhome/xenbak
# the structure on the backup location where daily .img backups with be produced with rsync and tar archived with bzip2
bak_dir=/backups/disk1/xen-backups/xen_images/$(date +%Y_%m_%d)/xen/domains

# list here all the Virtual Machines you want the script to create backups of
xen_name_list="windows7 haproxy2 jitsi-meet zabbix centos7"

If you need the script to copy the backup of Virtual Machine images to external Backup server via Local Lan or to a remote Internet located encrypted connection with a passwordless ssh authentication (once you have prepared the Machines to automatically login without pass over ssh with specific user), you can uncomment the script commented section to adapt it to copy to remote host.

Once you have placed at place /usr/sbin/xen_vm_backups.sh use a cronjob to prepare backups on a regular basis, for example I use the following cron to produce a working copy of the Virtual Machine backups everyday.
 

# crontab -u root -l 

# create windows7 haproxy2 jitsi-meet centos7 zabbix VMs backup once a month
00 06 1,2,3,4,5,6,7,8,9,10,11,12 * * /usr/sbin/xen_vm_backups.sh 2>&1 >/dev/null


I do clean up virtual machines Images that are older than 95 days with another cron job

# crontab -u root -l

# Delete xen image files older than 95 days to clear up space from backup HDD
45 06 17 * * find /backups/disk1/xen-backups/xen_images* -type f -mtime +95 -exec rm {} \; 2>&1 >/dev/null

#### Delete xen config backups older than 1 year+3 days (368 days)
45 06 17 * * find /backups/disk1/xen-backups/xen_config* -type f -mtime +368 -exec rm {} \; 2>&1 >/dev/null

How to calculate connections from IP address with shell script and log to Zabbix graphic

Thursday, March 11th, 2021

We had to test the number of connections incoming IP sorted by its TCP / IP connection state.

For example:

TIME_WAIT, ESTABLISHED, LISTEN etc.


The reason behind is sometimes the IP address '192.168.0.1' does create more than 200 connections, a Cisco firewall gets triggered and the connection for that IP is filtered out. To be able to know in advance that this problem is upcoming. a Small userparameter script is set on the Linux servers, that does print out all connections from IP by its STATES sorted out.


The script is calc_total_ip_match_zabbix.sh is below:

#!/bin/bash
#  check ESTIMATED / FIN_WAIT etc. netstat output for IPs and calculate total
# UserParameter=count.connections,(/usr/local/bin/calc_total_ip_match_zabbix.sh)
CHECK_IP='192.168.0.1';
f=0; 


for i in $(netstat -nat | grep "$CHECK_IP" | awk '{print $6}' | sort | uniq -c | sort -n); do

echo -n "$i ";
f=$((f+i));
done;
echo
echo "Total: $f"


root@pcfreak:/bashscripts# ./calc_total_ip_match_zabbix.sh 
1 TIME_WAIT 2 ESTABLISHED 3 LISTEN 

Total: 6


root@pcfreak:/bashscripts# ./calc_total_ip_match_zabbix.sh 
2 ESTABLISHED 3 LISTEN 
Total: 5


To make process with Zabbix it is necessery to have an Item created and a Depedent Item.

images/zabbix-webgui-connection-check1


webguiconnection-check1

webguiconnection-check1
 

webgui-connection-check2-item

images/webguiconnection-check1

Finally create a trigger to trigger alarm if you have more than or eqaul to 100 Total overall connections.


images/zabbix-webgui-connection-check-trigger

The Zabbix userparameter script should be as this:
cat /etc/zabbix/zabbix_agentd.d/userparameter_webgui_conn.conf
UserParameter=count.connections,(/usr/local/bin/webgui_conn_track.sh)
 

Some collleagues suggested more efficient shell script solution for suming the overall number of connections, below is less time consuming version of script, that can be used for the calculation.
 

#!/bin/bash -x
# show FIN_WAIT2 / ESTIMATED etc. and calcuate total
count=$(netstat -n | grep "192.168.0.1" | awk ' { print $6 } ' | sort -n | uniq -c | sort -nr)
total=$((${count// /+}))
echo "$count"
echo "Total:" "$total"


      2 ESTABLISHED
      1 TIME_WAIT
Total: 3


Below is the graph built with Zabbix showing all the fluctuations from connections from monitored IP.
ebgui-check_ip_graph

List all existing local admin users belonging to admin group and mail them to monitoring mail box

Monday, February 8th, 2021

local-user-account-creation-deletion-change-monitor-accounts-and-send-them-to-central-monitoring-mail

If you have a bunch of servers that needs to have a tight security with multiple Local users superuser accounts that change over time and you need to frequently keep an have a long over time if some new system UNIX local users in /etc/passwd /etc/group has been added deleted e.g. the /etc/passwd /etc/group then you might have the task to have some primitive monitoring set and the most primitive I can think of is simply routinely log users list for historical purposes to a common mailbox over time (lets say 4 times a month or even more frequently) you might send with a simple cron job a list of all existing admin authorized users to a logging sysadmin mailbox like lets say:
 

Local-unix-users@yourcompanydomain.com


A remark to make here is the common sysadmin practice scenario to have local existing non-ldap admin users group members of whom are authorized to use sudo su – root via /etc/sudoers  is described in my previous article how to add local users to admin group superuser access via sudo I thus have been managing already a number of servers that have user setup using the above explained admin group.

Thus to have the monitoring at place I've developed a tiny shell script that does check all users belonging to the predefined user group dumps it to .csv format that starts with a simple timestamp on when user admin list was made and sends it to a predefined email address as well as logs sent mail content for further reference in a local directory.

The task is a relatively easy but since nowadays the level of competency of system administration across youngsters is declinging -that's of course in my humble opinion (just like it happens in every other profession), below is the developed list-admin-users.sh


#!/bin/bash
# dump all users belonging to a predefined admin user / group in csv format 
# with a day / month year timestamp and mail it to a predefined admin
# monitoring address
TO_ADDRESS="Local-unix-users@yourcompanydomain.com";
HOSTN=$(hostname);
# root@server:/# grep -i 1000 /etc/passwd
# username:x:username:1000:username,,,:/home/username:/bin/bash
# username1:x:username1:1000:username1,,,:/home/username1:/bin/bash
# username5:x:username1:1000:username5,,,:/home/username5:/bin/bash

ADMINS_ID='4355';
#
# root@server # group_id_ID='4355'; grep -i group_id_ID /etc/passwd
# …
# username1:x:1005:4355:username1,,,:/home/username1:/bin/bash
# username5:x:1005:4355,,,:/home/username5:/bin/bash


group_id_ID='215';
group_id='group_id';
FIL="/var/log/userlist-log-dir/userlist_$(date +"%d_%m_%Y_%H_%M").txt";
CUR_D="$HOSTN: Current admin users $(date)"; >> $FIL; echo -e "##### $CUR_D #####" >> $FIL;
for i in $(cat /etc/passwd | grep -i /home|grep /bin/bash|grep -e "$ADMINS_ID" -e "$group_id_ID" | cut -d : -f1); do \
if [[ $(grep $i /etc/group|grep $group_id) ]]; then
f=$(echo $i); echo $i,group_id,$(id -g $i); else  echo $i,admin,$(id -g $i);
fi
done >> $FIL; mail -s "$CUR_D" $TO_ADDRESS < $FIL


list-admin-users.sh is ready for download also here

To make the script report you will have to place it somewhere for example in /usr/local/bin/list-admin-users.sh ,  create its log dir location /var/log/userlist-log-dir/ and set proper executable and user/group script and directory permissions to it to be only readable for root user.

root@server: # mkdir /var/log/userlist-log-dir/
root@server: # chmod +x /usr/local/bin/list-admin-users.sh
root@server: # chmod -R 700 /var/log/userlist-log-dir/


To make the script generate its admin user reports and send it to the central mailbox  a couple of times in the month early in the morning (assuming you have a properly running postfix / qmail / sendmail … smtp), as a last step you need to set a cron job to routinely invoke the script as root user.

root@server: # crontab -u root -e
12 06 5,10,15,20,25,1 /usr/local/bin/list-admin-users.sh


That's all folks now on 5th 10th, 15th, 20th 25th and 1st at 06:12 you'll get the admin user list reports done. Enjoy 🙂

Add Zabbix time synchronization ntp userparameter check script to Monitor Linux servers

Tuesday, December 8th, 2020

Zabbix-logo-how-to-make-ntpd-time-server-monitoring-article


How to add Zabbix time synchronization ntp userparameter check script to Monitor Linux servers?

We needed to set on some servers at my work an elementary check with Zabbix monitoring to check whether servers time is correctly synchronized with ntpd time service as well report if the ntp daemon is correctly running on the machine. For that a userparameter script was developed called userparameter_ntp.conf the script is simplistic and few a lines of bash shell scripting 
stuff is based on gresping information required from ntpq and ntpstat common ntp client commands to get information about the status of time synchronization on the servers.
 

[root@linuxserver ]# ntpstat
synchronised to NTP server (10.80.200.30) at stratum 3
   time correct to within 47 ms
   polling server every 1024 s


[root@linuxserver ]# ntpq -c peers
     remote           refid      st t when poll reach   delay   offset  jitter
==============================================================================
+timeserver1 10.26.239.41     2 u  319 1024  377   15.864    1.270   0.262
+timeserver2 10.82.239.41     2 u  591 1024  377   16.287   -0.334   1.748
*timeserver3 10.82.239.43     2 u   47 1024  377   15.613   -0.553   0.251
 timeserver4 .INIT.          16 u    – 1024    0    0.000    0.000   0.000


Below is Zabbix UserParameter script that does report us 3 important values we monitor to make sure time server synchronization works as expected the zabbix keys we set are ntp.offset, ntp.sync, ntp.exact in attempt to describe what we're fetching from ntp client:

[root@linuxserver ]# cat /etc/zabbix/zabbix-agent.d/userparameter_ntp.conf

UserParameter=ntp.offset,(/usr/sbin/ntpq -pn | /usr/bin/awk 'BEGIN { offset=1000 } $1 ~ /\*/ { offset=$9 } END { print offset }')
#UserParameter=ntp.offset,(/usr/sbin/ntpq -pn | /usr/bin/awk 'FNR==4{print $9}')
UserParameter=ntp.sync,(/usr/bin/ntpstat | cut -f 1 -d " " | tr -d ' \t\n\r\f')
UserParameter=ntp.exact,(/usr/bin/ntpstat | /usr/bin/awk 'FNR==2{print $5,$6}')

In Zabbix the monitored ntpd parameters set-upped looks like this:


ntp_time_synchronization_check-zabbix-screenshot.


!Note that in above userparameter example, the commented userparameter script is a just another way to do an ntpd offset returned value which was developed before the more sophisticated with more regular expression checks from the /usr/sbin/ntpd via ntpq, perhaps if you want to extend it you can also use another script to report more verbose information to Zabbix if that is required like ouput from ntpq -c peers command:
 

UserParameter=ntp.verbose,(/usr/sbin/ntpq -c peers)

Of course to make the Zabbix fetch necessery data from monitored hosts, we need to set-up further new Zabbix Template with the respective Trigger and Items.

Below are few screenshots including the triggers used.

ntpd_server-time_synchronization_check-zabbix-screenshot-triggers

  • ntpd.trigger

{NTP:net.udp.service[ntp].last(0)}<1

  • NTP Synchronization trigger

{NTP:ntp.sync.iregexp(unsynchronised)}=1


As you can see from history we have setup our items to Store history of reported data to Zabbix from parameter script for 90 days and update our monitor check, every 30 seconds from the monitored hosts to which Tempate is applied.

Well that's all folks, time synchronization issues we'll be promptly triggering a new Alarm in Zabbix !

Check server Internet connectivity Speedtest from Linux terminal CLI

Friday, August 7th, 2020

check-server-console-speedtest

If you are a system administrator of a dedicated server and you have no access to Xserver Graphical GNOME / KDE etc. environment and you wonder how you can track the bandwidth connectivity speed of remote system to the internet and you happen to have a modern Linux distribution, here is few ways to do a speedtest.
 

1. Use speedtest-cli command line tool to test connectivity


speedtest-cli is a tiny tool written in python, to use it hence you need to have python installed on the server.
It is available both for Redhat Linux distros and Debians / Ubuntus etc. in the list of standard installable packages.

a) Install speedtest-cli on Fedora / CentOS / RHEL
 

On CentOS / RHEL / Scientific Linux lower than ver 8:


$ sudo yum install python

On CentOS 8 / RHEL 8 user type the following command to install Python 3 or 2:


$sudo yum install python3
$ sudo yum install python2


On Fedora Linux version 22+


$ sudo dnf install python
$ sudo dnf install pytho3


Once python is at place download speedtest.py or in case if link is not reachable download mirrored version of speedtest.py on www.pc-freak.net here


$ wget -O speedtest-cli https://raw.githubusercontent.com/sivel/speedtest-cli/master/speedtest.py
$ chmod +x speedtest-cli


Then it is time to run script speedtest-screenshot-linux-terminal-console-cli-cmd
To test enabled Bandwidth on the server


$ python speedtest-cli


b) Install speedtest-cli on Debian

On Latest Debian 10 Buster speedtest is available out of the box in regular .deb repositories, so fetch it with apt


# apt install –yes speedtest-cli


You can give now speedtest-cli a try with –bytes arguments to get speed values in bytes instead of bits or if you want to generate an image with test results in picture just like it will appear if you use speedtest.net inside a gui browser, use the –share option

speedtest-screenshot-linux-terminal-console-cli-cmd-options


2. Getting connectivity results of all defined speedtest test City Locations


Speedtest has a list of servers through which a Upload and Download speed is tested, to run speedtest-cli to test with each and every server and get a better picture on what kind of connectivity to expect from your server towards the closest region capital cities, fetch speedtest-servers.php list and use a small shell loop below is how:


root@pcfreak:~#  wget http://www.speedtest.net/speedtest-servers.php
–2020-08-07 16:31:34–  http://www.speedtest.net/speedtest-servers.php
Преобразувам www.speedtest.net (www.speedtest.net)… 151.101.2.219, 151.101.66.219, 151.101.130.219, …
Connecting to www.speedtest.net (www.speedtest.net)|151.101.2.219|:80… успешно свързване.
HTTP изпратено искане, чакам отговор… 301 Moved Permanently
Адрес: https://www.speedtest.net/speedtest-servers.php [следва]
–2020-08-07 16:31:34–  https://www.speedtest.net/speedtest-servers.php
Connecting to www.speedtest.net (www.speedtest.net)|151.101.2.219|:443… успешно свързване.
HTTP изпратено искане, чакам отговор… 307 Temporary Redirect
Адрес: https://c.speedtest.net/speedtest-servers-static.php [следва]
–2020-08-07 16:31:35–  https://c.speedtest.net/speedtest-servers-static.php
Преобразувам c.speedtest.net (c.speedtest.net)… 151.101.242.219
Connecting to c.speedtest.net (c.speedtest.net)|151.101.242.219|:443… успешно свързване.
HTTP изпратено искане, чакам отговор… 200 OK
Дължина: 211695 (207K) [text/xml]
Saving to: ‘speedtest-servers.php’
speedtest-servers.php                  100%[==========================================================================>] 206,73K  –.-KB/s    in 0,1s
2020-08-07 16:31:35 (1,75 MB/s) – ‘speedtest-servers.php’ saved [211695/211695]

Once file is there with below loop we extract all file defined servers id="" 's 
 

root@pcfreak:~# for i in $(cat speedtest-servers.php | egrep -Eo 'id="[0-9]{4}"' |sed -e 's#id="##' -e 's#"##g'); do speedtest-cli  –server $i; done
Retrieving speedtest.net configuration…
Testing from Vivacom (83.228.93.76)…
Retrieving speedtest.net server list…
Retrieving information for the selected server…
Hosted by Telecoms Ltd. (Varna) [38.88 km]: 25.947 ms
Testing download speed……………………………………………………………………..
Download: 57.71 Mbit/s
Testing upload speed…………………………………………………………………………………………
Upload: 93.85 Mbit/s
Retrieving speedtest.net configuration…
Testing from Vivacom (83.228.93.76)…
Retrieving speedtest.net server list…
Retrieving information for the selected server…
Hosted by GMB Computers (Constanta) [94.03 km]: 80.247 ms
Testing download speed……………………………………………………………………..
Download: 35.86 Mbit/s
Testing upload speed…………………………………………………………………………………………
Upload: 80.15 Mbit/s
Retrieving speedtest.net configuration…
Testing from Vivacom (83.228.93.76)…

…..


etc.

For better readability you might want to add the ouput to a file or even put it to run periodically on a cron if you have some suspcion that your server Internet dedicated lines dies out to some general locations sometimes.
 

3. Testing UPlink speed with Download some big file from source location


In the past a classical way to test the bandwidth connectivity of your Internet Service Provider was to fetch some big file, Linux guys should remember it was almost a standard to roll a download of Linux kernel source .tar file with some test browser as elinks / lynx / w3c.
speedtest-screenshot-kernel-org-shot1 speedtest-screenshot-kernel-org-shot2
or if those are not at hand test connectivity on remote free shell servers whatever file downloader as wget or curl was used.
Analogical method is still possible, for example to use wget to get an idea about bandwidtch connectivity, let it roll below 500 mb from speedtest.wdc01.softlayer.com to /dev/null few times:


$ wget –output-document=/dev/null http://speedtest.wdc01.softlayer.com/downloads/test500.zip

$ wget –output-document=/dev/null http://speedtest.wdc01.softlayer.com/downloads/test500.zip

$ wget –output-document=/dev/null http://speedtest.wdc01.softlayer.com/downloads/test500.zip


# wget -O /dev/null –progress=dot:mega http://cachefly.cachefly.net/10mb.test ; date
–2020-08-07 13:56:49–  http://cachefly.cachefly.net/10mb.test
Resolving cachefly.cachefly.net (cachefly.cachefly.net)… 205.234.175.175
Connecting to cachefly.cachefly.net (cachefly.cachefly.net)|205.234.175.175|:80… connected.
HTTP request sent, awaiting response… 200 OK
Length: 10485760 (10M) [application/octet-stream]
Saving to: ‘/dev/null’

     0K …….. …….. …….. …….. …….. …….. 30%  142M 0s
  3072K …….. …….. …….. …….. …….. …….. 60%  179M 0s
  6144K …….. …….. …….. …….. …….. …….. 90%  204M 0s
  9216K …….. ……..                                    100%  197M=0.06s

2020-08-07 13:56:50 (173 MB/s) – ‘/dev/null’ saved [10485760/10485760]

Fri 07 Aug 2020 01:56:50 PM UTC


To be sure you have a real picture on remote machine Internet speed it is always a good idea to run download of random big files on a certain locations that are well known to have a very stable Internet bandwidth to the Internet backbone routers.

4. Using Simple shell script to test Internet speed


Fetch and use speedtest.sh


wget https://raw.github.com/blackdotsh/curl-speedtest/master/speedtest.sh && chmod u+x speedtest.sh && bash speedtest.sh


5. Using iperf to test connectivity between two servers 


iperf is another good tool worthy to mention that can be used to test the speed between client and server.

To use iperf install it with apt and do on the server machine to which bandwidth will be tested:


# iperf -s 


On the client machine do:


# iperf -c 192.168.1.1 


where 192.168.1.1 is the IP of the server where iperf was spawned to listen.

6. Using Netflix fast to determine Internet connection speed on host


Fast

fast is a service provided by Netflix. Its web interface is located at Fast.com and it has a command-line interface available through npm (npm is a package manager for nodejs) so if you don't have it you will have to install it first with:

# apt install –yes npm


Note that if you run on Debian this will install you some 249 new nodejs packages which you might not want to have on the system, so this is useful only for machines that has already use of nodejs.


$ fast


     82 Mbps ↓


The command returns your Internet download speed. To get your upload speed, use the -u flag:


$ fast -u


   ⠧ 80 Mbps ↓ / 8.2 Mbps ↑


7. Use speedometer / iftop to measure incoming and outgoing traffic on interface


If you're measuring connectivity on a live production server system, then you might consider that the measurement output might not be exactly correct especially if you're measuring the Uplink / Downlink on a Heavy loaded webserver / Mail Server / Samba or DNS server.
If this is the case a very useful tools to consider to extract the already taken traffic used on your Incoming and Outgoing ( TX / RX ) Network interfaces
are speedometer and iftop, they're present and installable depending on the OS via yum / apt or the respective package manager.


To install on Debian server:


# apt install –yes iftop speedometer


The most basic use to check the live received traffic in a nice Ncurses like text graphic is with: 


# speedometer -r 


speedometer-check-received-transmitted-network-traffic-on-linux1

To generate real time ASCII art graph on RX / TX traffic do:


# speedometer -r eth0 -t eth0


speedometer-check-received-transmitted-network-traffic-on-linux


# iftop -P -i eth0


iftop-show-statistics-on-connections-screenshot-pcfreak