![]()
There are plenty of GNU / Linux softwares to monitor server performance (hard disk space, network and CPU load) and general hardware health both text based for SSH console) and from web.
Just to name a few for console precious tools, such are:
- sar (sysstats)
- lm-sensors
- iostat
- top, htop
- collectl
- nmon
- nethogs
And for web based Linux / Windows server monitoring my favourite tools are:
- Nagios – The industry standard in IT infrastructure monitoring
- Icinga – Open Source network and computer system monitoring
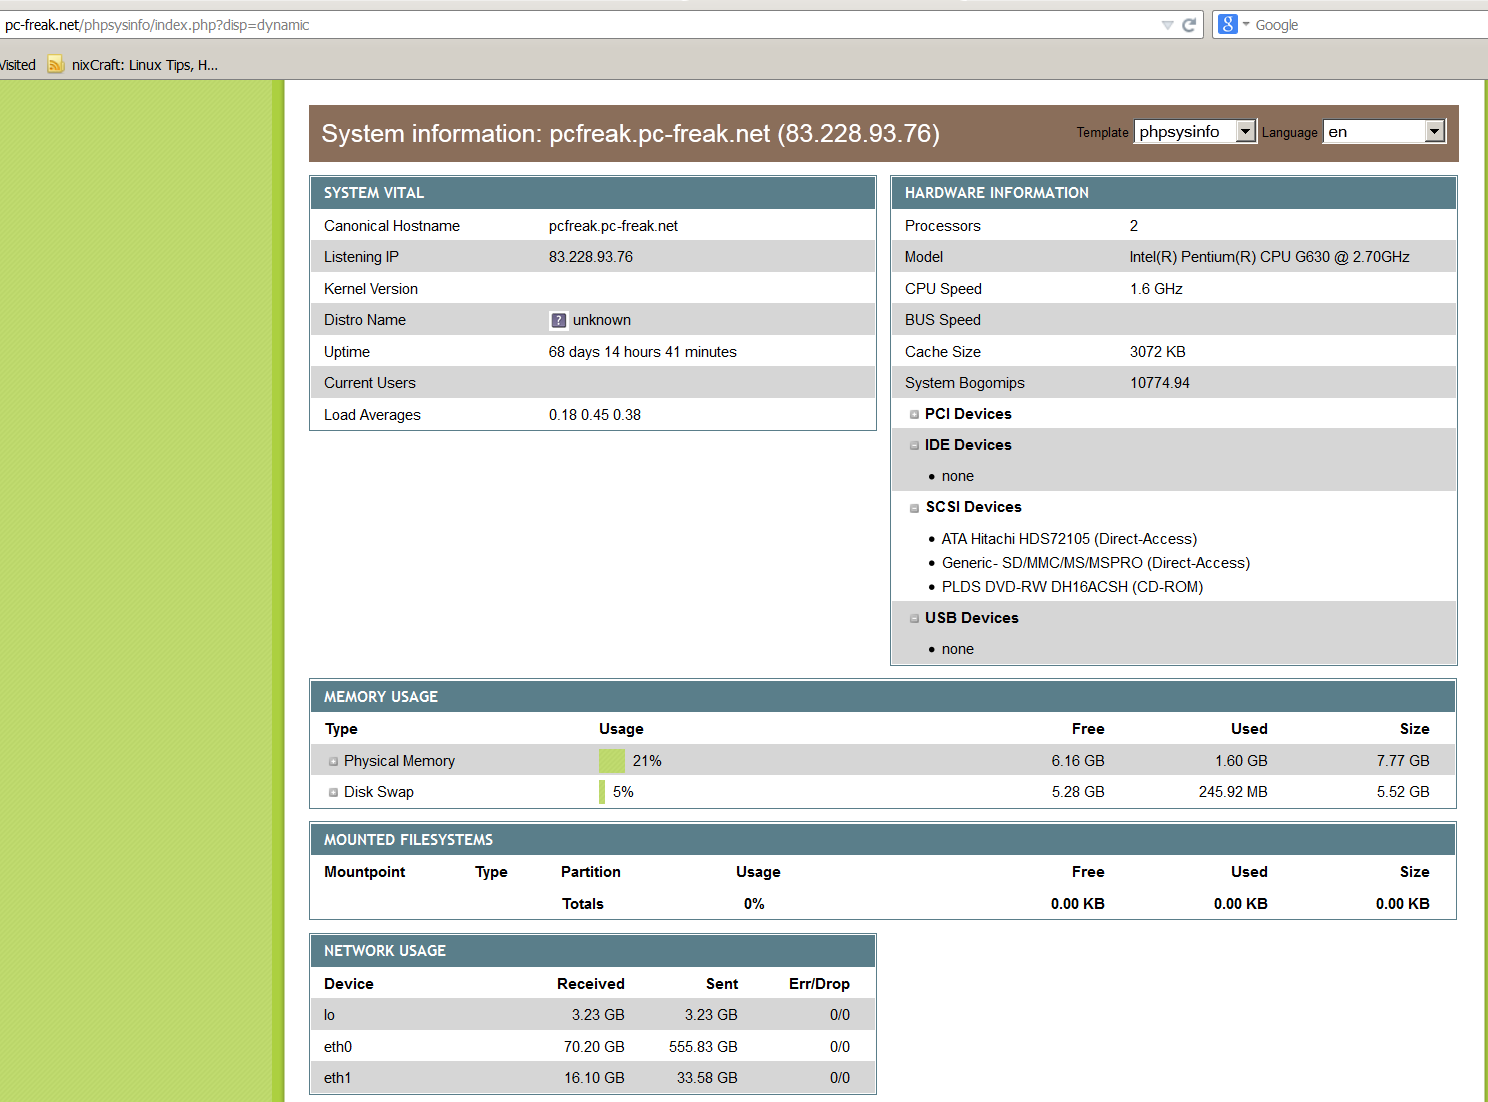
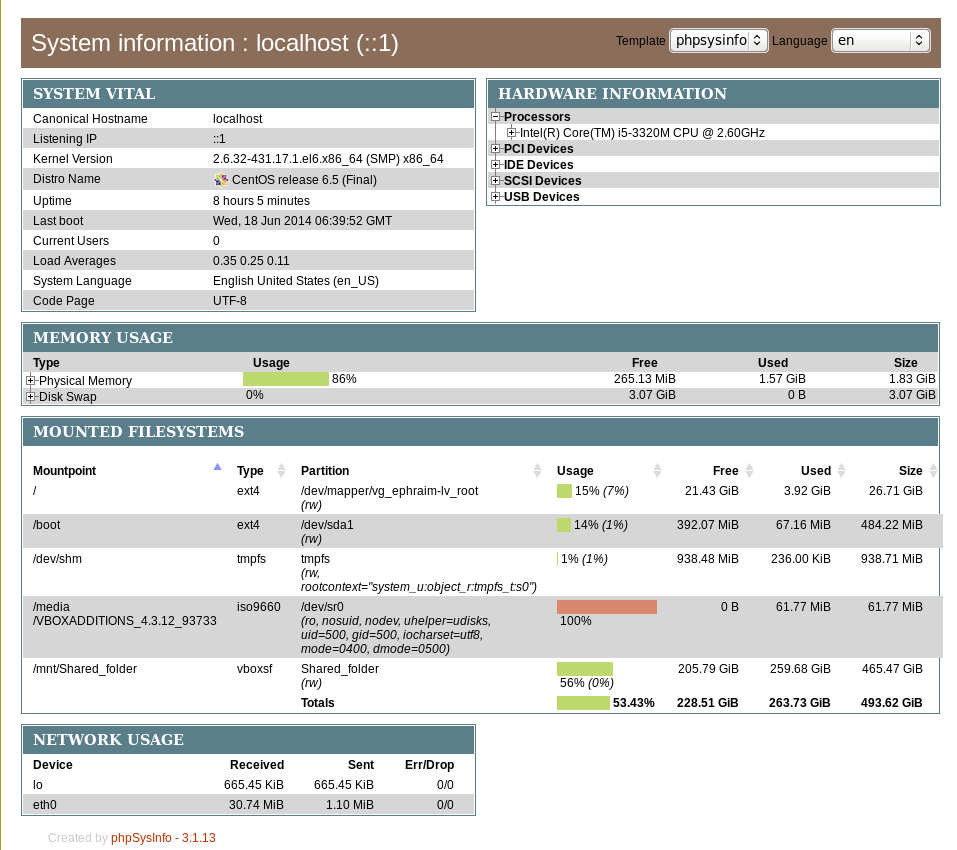
phpsysinfo is yet another web based Linux monitoring software for small companies or home router use it is perfect for people who don't want to spend time learning how to configure complicated and robust multiple server monitoring software like Nagios or Icanga.
phpsysinfo is quick and dirty way to monitor system uptime, network, disk and memory usage, get information on CPU model, attached IDEs, SCSI devices and PCIs from the web and is perfect for Linux servers already running Apache and PHP.
1. Installing PHPSysInfo on Debian, Ubuntu and deb derivative Linux-es
PHPSysInfo is very convenient and could be prefered instead of above tools for the reason it is available by default in Debian and Ubuntu package repositories and installable via apt-get and it doesn't require any further configuration, to roll it you install you place a config and you forget it.
# apt-cache show phpsysinfo |grep -i desc -A 2
Description: PHP based host information
phpSysInfo is a PHP script that displays information about the
host being accessed.
Installation is a piece of cake:
# apt-get install --yes phpsysinfo
…
Add phpsysinfo directives to /etc/apache2/conf.d/phpsysinfo.conf to make it accessible via default set Apache vhost domain under /phpsysinfo
Paste in root console:
cat > /etc/apache2/conf.d/phpsysinfo.conf <<-EOF
Alias /phpsysinfo /usr/share/phpsysinfo
<Location /phpsysinfo>
 Options None
 Order deny,allow
 Deny from all
 #Allow from localhost
 #Allow from 192.168.56.2
 Allow from all
</Location>
EOF
Above config will allow access to /phpsysinfo from any IP on the Internet, this could be a security hole, thus it is always better to either protect it with access .htaccess password login or allow it only from certain IPs, from which you will access it with something like:
Allow from 192.168.2.100
Then restart Apache server:
# /etc/init.d/apache2 restart
To access phpsysinfo monitoring gathered statistics, access it in a browser http://defaultdomain.com/phpsysinfo/
2. Installing PHPSysinfo on CentOS, Fedora and RHEL Linux
Download and untar
# cd /var/www/html

# wget https://github.com/phpsysinfo/phpsysinfo/archive/v3.1.13.tar.gz

# tar -zxvf phpsysinfo-3.1.13.tar.gz

# ln -sf phpsysinfo-3.1.13 phpsysinfo

# mv phpsysinfo.ini.new phpsysinfo.ini
Install php php-xml and php-mbstring RPM packages
yum -y install php php-xml php-mbstring

...
Start Apache web service
[root@ephraim html]# /etc/init.d/httpd restart
…
[root@ephraim html]# ps ax |grep -i http

 8816 ?        Ss     0:00 /usr/sbin/httpd

 8819 ?        S      0:00 /usr/sbin/httpd
As PhpSysInfo is written in PHP it is also possible to install phpsysinfo on Windows.
phpsysinfo is not the only available simple monitoring server performance remotely tool, if you're looking for a little bit extended information and a better visualization interface alternative to phpsysinfo take a look at linux-dash.
In context of web monitoring other 2 web PHP script tools useful in remote server monitoring are:
OpenStatus – A simple and effective resource and status monitoring script for multiple servers.
LookingGlass – User-friendly PHP Looking Glass (Web interface to use Host (Nslookup), Ping, Mtr – Matt Traceroute)


More helpful Articles

Tags: configure, default, hard disk, information, init, installation, linux windows, little bit, php, rhel, script, security hole, server performance, system, usr, web


