Posts Tagged ‘usr’

How to set up Notify by email expiring local UNIX user accounts on Linux / BSD with a bash script

Thursday, August 24th, 2023

password-expiry-linux-tux-logo-script-picture-how-to-notify-if-password-expires-on-unix

If you have already configured Linux Local User Accounts Password Security policies Hardening – Set Password expiry, password quality, limit repatead access attempts, add directionary check, increase logged history command size and you want your configured local user accounts on a Linux / UNIX / BSD system to not expire before the user is reminded that it will be of his benefit to change his password on time, not to completely loose account to his account, then you might use a small script that is just checking the upcoming expiry for a predefined users and emails in an array with lslogins command like you will learn in this article.

The script below is written by a colleague Lachezar Pramatarov (Credit for the script goes to him) in order to solve this annoying expire problem, that we had all the time as me and colleagues often ended up with expired accounts and had to bother to ask for the password reset and even sometimes clearance of account locks. Hopefully this little script will help some other unix legacy admin systems to get rid of the account expire problem.

For the script to work you will need to have a properly configured SMTP (Mail server) with or without a relay to be able to send to the script predefined email addresses that will get notified. 

Here is example of a user whose account is about to expire in a couple of days and who will benefit of getting the Alert that he should hurry up to change his password until it is too late 🙂

[root@linux ~]# date
Thu Aug 24 17:28:18 CEST 2023

[root@server~]# chage -l lachezar
Last password change                                    : May 30, 2023
Password expires                                        : Aug 28, 2023
Password inactive                                       : never
Account expires                                         : never
Minimum number of days between password change          : 0
Maximum number of days between password change          : 90
Number of days of warning before password expires       : 14

Here is the user_passwd_expire.sh that will report the user

# vim  /usr/local/bin/user_passwd_expire.sh

#!/bin/bash

# This script will send warning emails for password expiration 
# on the participants in the following list:
# 20, 15, 10 and 0-7 days before expiration
# ! Script sends expiry Alert only if day is Wednesday – if (( $(date +%u)==3 )); !

# email to send if expiring
alert_email='alerts@pc-freak.net';
# the users that are admins added to belong to this group
admin_group="admins";
notify_email_header_customer_name='Customer Name';

declare -A mails=(
# list below accounts which will receive account expiry emails

# syntax to define uid / email
# [“account_name_from_etc_passwd”]="real_email_addr@fqdn";

#    [“abc”]="abc@fqdn.com"
#    [“cba”]="bca@fqdn.com"
    [“lachezar”]="lachezar.user@gmail.com"
    [“georgi”]="georgi@fqdn-mail.com"
    [“acct3”]="acct3@fqdn-mail.com"
    [“acct4”]="acct4@fqdn-mail.com"
    [“acct5”]="acct5@fqdn-mail.com"
    [“acct6”]="acct6@fqdn-mail.com"
#    [“acct7”]="acct7@fqdn-mail.com"
#    [“acct8”]="acct8@fqdn-mail.com"
#    [“acct9”]="acct9@fqdn-mail.com"
)

declare -A days

while IFS="=" read -r person day ; do
  days[“$person”]="$day"
done < <(lslogins –noheadings -o USER,GROUP,PWD-CHANGE,PWD-WARN,PWD-MIN,PWD-MAX,PWD-EXPIR,LAST-LOGIN,FAILED-LOGIN  –time-format=iso | awk '{print "echo "$1" "$2" "$3" $(((($(date +%s -d \""$3"+90 days\")-$(date +%s)))/86400)) "$5}' | /bin/bash | grep -E " $admin_group " | awk '{print $1 "=" $4}')

#echo ${days[laprext]}
for person in "${!mails[@]}"; do
     echo "$person ${days[$person]}";
     tmp=${days[$person]}

#     echo $tmp
# each person will receive mails only if 20th days / 15th days / 10th days remaining till expiry or if less than 7 days receive alert mail every day

     if  (( (${tmp}==20) || (${tmp}==15) || (${tmp}==10) || ((${tmp}>=0) && (${tmp}<=7)) )); 
     then
         echo "Hello, your password for $(hostname -s) will expire after ${days[$person]} days.” | mail -s “$notify_email_header_customer_name $(hostname -s) server password expiration”  -r passwd_expire ${mails[$person]};
     elif ((${tmp}<0));
     then
#          echo "The password for $person on $(hostname -s) has EXPIRED before{days[$person]} days. Please take an action ASAP.” | mail -s “EXPIRED password of  $person on $(hostname -s)”  -r EXPIRED ${mails[$person]};

# ==3 meaning day is Wednesday the day on which OnCall Person changes

        if (( $(date +%u)==3 ));
        then
             echo "The password for $person on $(hostname -s) has EXPIRED. Please take an action." | mail -s "EXPIRED password of  $person on $(hostname -s)"  -r EXPIRED $alert_email;
        fi
     fi  
done


To make the script notify about expiring user accounts, place the script under some directory lets say /usr/local/bin/user_passwd_expire.sh and make it executable and configure a cron job that will schedule it to run every now and then.

# cat /etc/cron.d/passwd_expire_cron

# /etc/cron.d/pwd_expire
#
# Check password expiration for users
#
# 2023-01-16 LPR
#
02 06 * * * root /usr/local/bin/user_passwd_expire.sh >/dev/null

Script will execute every day morning 06:02 by the cron job and if the day is wednesday (3rd day of week) it will send warning emails for password expiration if 20, 15, 10 days are left before account expires if only 7 days are left until the password of user acct expires, the script will start sending the Alarm every single day for 7th, 6th … 0 day until pwd expires.

If you don't have an expiring accounts and you want to force a specific account to have a expire date you can do it with:

# chage -E 2023-08-30 someuser


Or set it for new created system users with:

# useradd -e 2023-08-30 username


That's it the script will notify you on User PWD expiry.

If you need to for example set a single account to expire 90 days from now (3 months) that is a kind of standard password expiry policy admins use, do it with:

# date -d "90 days" +"%Y-%m-%d"
2023-11-22


Ideas for user_passwd_expire.sh script improvement
 

The downside of the script if you have too many local user accounts is you have to hardcode into it the username and user email_address attached to and that would be tedios task if you have 100+ accounts. 

However it is pretty easy if you already have a multitude of accounts in /etc/passwd that are from UID range to loop over them in a small shell loop and build new array from it. Of course for a solution like this to work you will have to have defined as user data as GECOS with command like chfn.
 

[georgi@server ~]$ chfn
Changing finger information for test.
Name [test]: 
Office []: georgi@fqdn-mail.com
Office Phone []: 
Home Phone []: 

Password: 

[root@server test]# finger georgi
Login: georgi                       Name: georgi
Directory: /home/georgi                   Shell: /bin/bash
Office: georgi@fqdn-mail.com
On since чт авг 24 17:41 (EEST) on :0 from :0 (messages off)
On since чт авг 24 17:43 (EEST) on pts/0 from :0
   2 seconds idle
On since чт авг 24 17:44 (EEST) on pts/1 from :0
   49 minutes 30 seconds idle
On since чт авг 24 18:04 (EEST) on pts/2 from :0
   32 minutes 42 seconds idle
New mail received пт окт 30 17:24 2020 (EET)
     Unread since пт окт 30 17:13 2020 (EET)
No Plan.

Then it should be relatively easy to add the GECOS for multilpe accounts if you have them predefined in a text file for each existing local user account.

Hope this script will help some sysadmin out there, many thanks to Lachezar for allowing me to share the script here.
Enjoy ! 🙂

Unfreeze stucked “freezed” messages from Exim Mail server queue

Friday, June 16th, 2023

how-to-unfreeze-messages-from-exim-mail-server-smtp-logo-linux-and-some-other-useful-exim-commands.png

Messages are frozen when the mail server has determined it cannot do anything to deliver the message. (they can also be manually frozen).

Exim has option to set how long frozen messages are kept on the system.

On a Debian/Ubuntu based install the /etc/exim4/conf.d/main/02_exim4-config_options file has the option timeout_frozen_after = 7d. Which means messages frozen for 7 days will get expunged.

Frozen messages really shouldn't be a problem on most systems. They are often just spam messages that can't get properly delivered.

If you have to deal with freezed mails from the exim mail server, unlike postfix, where there is no "freeze" scheme but the messages just stuck in the queue and you might want to simply ask the mail server to resend failed to deliver messages once again through a simple:

# postqueue -f


With exim to ask the server to resend the freeze-d states messages there is another aproach:

It is for this reason that I am writing this post to share how you can ask the exim to resend the "frozen" messages, as on exim there is no so much straight forward way.

To find out what letters are stored in the exim queue run

# exim -bp

To unfreeze the messages a simple while loop can be written, which lists all frozen state messages and unfreezes these letters one by one in a cycle:

# exim -bp | grep -i frozen | awk '{print $3}' | while read LINE; do exim -Mt $LINE; done

Another approach to unfreeze the frozen multitude of messages which should be a bit quicker if you have to do it for a very large amount of frozen states mails is to use xargs command:

# mailq | grep frozen | awk '{print $3}' | xargs exim -v -M

Since we on exim topic in this article, for starters with Exim, here is few other useful exim queue commands, that might be beneficial if you have to deal with EXIM SMTP.

Attempting to send a mail with a specified ID

# /usr/sbin/exim -M email-id


Forcefully run another queue to execute

# /usr/sbin/exim -qf

We see the logs related to letter

# /usr/sbin/exim -Mvl messageID

To see the body of the letter

# /usr/sbin/exim -Mvb messageID

To see the beginning (header) of the letter only

# /usr/sbin/exim -Mvh messageID

Deletes the mail without sending any error messages

# /usr/sbin/exim -Mrm messageID

Shows the number of letters in the queue

# /usr/sbin/exim -bpr | grep "<" | wc -l

Shows the number of frozen mails in the queue

# /usr/sbin/exim -bpr | grep frozen | wc -l

Deletes all frozen letters

# /usr/sbin/exim -bpr | grep frozen | awk {'print $3'} | xargs exim -Mrm

To remove a message from the Exim queue

# exim -Mrm {message-id}

Remove all messages from the Exim queue

# exim -bp | awk '/^ *[0-9]+[mhd]/{print "exim -Mrm " $3}' | bash

Another way to do it:

# exim -bp | exiqgrep -i | xargs exim -Mrm


Fastest solution to delete all emails in exim queue (for less than 5 seconds) is
 

# cd /var/spool
# mv exim exim.old
# mkdir -p exim/input
# mkdir -p exim/msglog
# mkdir -p exim/db
# chown -R mail:mail exim
# /sbin/service exim restart

or if you have AV / AntiSpam integrated to mail server:

# cd /var/spool
# mv exim exim.old
# mkdir -p exim/db
# mkdir -p exim/input
# mkdir -p exim/msglog
# mkdir -p exim/scan
# chown -R mail:mail exim
# /sbin/service exim restart

Deletes the entire exim queue

# /usr/sbin/exim -qff

Configure aide file integrity check server monitoring in Zabbix to track for file changes on servers

Tuesday, March 28th, 2023

zabbix-aide-log-monitoring-logo

Earlier I've written a small article on how to setup AIDE monitoring for Server File integrity check on Linux, which put the basics on how this handy software to improve your server overall Security software can be installed and setup without much hassle.

Once AIDE is setup and a preset custom configuration is prepared for AIDE it is pretty useful to configure AIDE to monitor its critical file changes for better server security by monitoring the AIDE log output for new record occurs with Zabbix. Usually if no files monitored by AIDE are modified on the machine, the log size will not grow, but if some file is modified once Advanced Linux Intrusion Detecting (aide) binary runs via the scheduled Cron job, the /var/log/app_aide.log file will grow zabbix-agentd will continuously check the file for size increases and will react.

Before setting up the Zabbix required Template, you will have to set few small scripts that will be reading a preconfigured list of binaries or application files etc. that aide will monitor lets say via /etc/aide-custom.conf
 

1. Configure aide to monitor files for changes


Before running aide, it is a good idea to prepare a file with custom defined directories and files that you plan to monitor for integrity checking e.g. future changes with aide, for example to capture bad intruders who breaks into server which runs aide and modifies critical files such as /etc/passwd /etc/shadow /etc/group or / /usr/local/etc/* or /var/* / /usr/* critical files that shouldn't be allowed to change without the admin to soon find out.

# cat /etc/aide-custom.conf

# Example configuration file for AIDE.
@@define DBDIR /var/lib/aide
@@define LOGDIR /var/log/aide
# The location of the database to be read.
database=file:@@{DBDIR}/app_custom.db.gz
database_out=file:@@{DBDIR}/app_aide.db.new.gz
gzip_dbout=yes
verbose=5

report_url=file:@@{LOGDIR}/app_custom.log
#report_url=syslog:LOG_LOCAL2
#report_url=stderr
#NOT IMPLEMENTED report_url=mailto:root@foo.com
#NOT IMPLEMENTED report_url=syslog:LOG_AUTH

# These are the default rules.
#
#p:      permissions
#i:      inode:
#n:      number of links
#u:      user
#g:      group
#s:      size
#b:      block count
#m:      mtime
#a:      atime
#c:      ctime
#S:      check for growing size
#acl:           Access Control Lists
#selinux        SELinux security context
#xattrs:        Extended file attributes
#md5:    md5 checksum
#sha1:   sha1 checksum
#sha256:        sha256 checksum
#sha512:        sha512 checksum
#rmd160: rmd160 checksum
#tiger:  tiger checksum

#haval:  haval checksum (MHASH only)
#gost:   gost checksum (MHASH only)
#crc32:  crc32 checksum (MHASH only)
#whirlpool:     whirlpool checksum (MHASH only)

FIPSR = p+i+n+u+g+s+m+c+acl+selinux+xattrs+sha256

#R:             p+i+n+u+g+s+m+c+acl+selinux+xattrs+md5
#L:             p+i+n+u+g+acl+selinux+xattrs
#E:             Empty group
#>:             Growing logfile p+u+g+i+n+S+acl+selinux+xattrs

# You can create custom rules like this.
# With MHASH…
# ALLXTRAHASHES = sha1+rmd160+sha256+sha512+whirlpool+tiger+haval+gost+crc32
ALLXTRAHASHES = sha1+rmd160+sha256+sha512+tiger
# Everything but access time (Ie. all changes)
EVERYTHING = R+ALLXTRAHASHES

# Sane, with multiple hashes
# NORMAL = R+rmd160+sha256+whirlpool
NORMAL = FIPSR+sha512

# For directories, don't bother doing hashes
DIR = p+i+n+u+g+acl+selinux+xattrs

# Access control only
PERMS = p+i+u+g+acl+selinux

# Logfile are special, in that they often change
LOG = >

# Just do sha256 and sha512 hashes
LSPP = FIPSR+sha512

# Some files get updated automatically, so the inode/ctime/mtime change
# but we want to know when the data inside them changes
DATAONLY =  p+n+u+g+s+acl+selinux+xattrs+sha256

##############TOUPDATE
#To delegate to app team create a file like /app/aide.conf
#and uncomment the following line
#@@include /app/aide.conf
#Then remove all the following lines
/etc/zabbix/scripts/check.sh FIPSR
/etc/zabbix/zabbix_agentd.conf FIPSR
/etc/sudoers FIPSR
/etc/hosts FIPSR
/etc/keepalived/keepalived.conf FIPSR
# monitor haproxy.cfg
/etc/haproxy/haproxy.cfg FIPSR
# monitor keepalived
/home/keepalived/.ssh/id_rsa FIPSR
/home/keepalived/.ssh/id_rsa.pub FIPSR
/home/keepalived/.ssh/authorized_keys FIPSR

/usr/local/bin/script_to_run.sh FIPSR
/usr/local/bin/another_script_to_monitor_for_changes FIPSR

#  cat /usr/local/bin/aide-config-check.sh
#!/bin/bash
/sbin/aide -c /etc/aide-custom.conf -D

# cat /usr/local/bin/aide-init.sh
#!/bin/bash
/sbin/aide -c /etc/custom-aide.conf -B database_out=file:/var/lib/aide/custom-aide.db.gz -i


# cat /usr/local/bin/aide-check.sh

#!/bin/bash
/sbin/aide -c /etc/custom-aide.conf -Breport_url=stdout -B database=file:/var/lib/aide/custom-aide.db.gz -C|/bin/tee -a /var/log/aide/custom-aide-check.log|/bin/logger -t custom-aide-check-report
/usr/local/bin/aide-init.sh


# cat /usr/local/bin/aide_app_cron_daily.txt

#!/bin/bash
#If first time, we need to init the DB
if [ ! -f /var/lib/aide/app_aide.db.gz ]
   then
    logger -p local2.info -t app-aide-check-report  "Generating NEW AIDE DATABASE for APPLICATION"
    nice -n 18 /sbin/aide –init -c /etc/aide_custom.conf
    mv /var/lib/aide/app_aide.db.new.gz /var/lib/aide/app_aide.db.gz
fi

nice -n 18 /sbin/aide –update -c /etc/aide_app.conf
#since the option for syslog seems not fully implemented we need to push logs via logger
/bin/logger -f /var/log/aide/app_aide.log -p local2.info -t app-aide-check-report
#Acknoledge the new database as the primary (every results are sended to syslog anyway)
mv /var/lib/aide/app_aide.db.new.gz /var/lib/aide/app_aide.db.gz

What above cron job does is pretty simple, as you can read it yourself. If the configuration predefined aide database store file /var/lib/aide/app_aide.db.gz, does not
exists aide will create its fresh empty database and generate a report for all predefined files with respective checksums to be stored as a comparison baseline for file changes. 

Next there is a line to write aide file changes via rsyslog through the logger and local2.info handler


2. Setup Zabbix Template with Items, Triggers and set Action

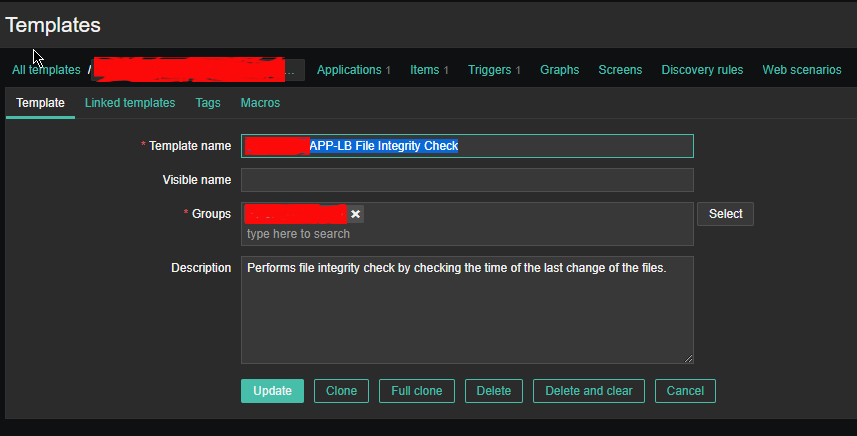
2.1 Create new Template and name it YourAppName APP-LB File integrity Check

aide-itengrity-check-zabbix_ Configuration of templates

Then setup the required Items, that will be using zabbix's Skip embedded function to scan file in a predefined period of file, this is done by the zabbix-agent that is
supposed to run on the server.

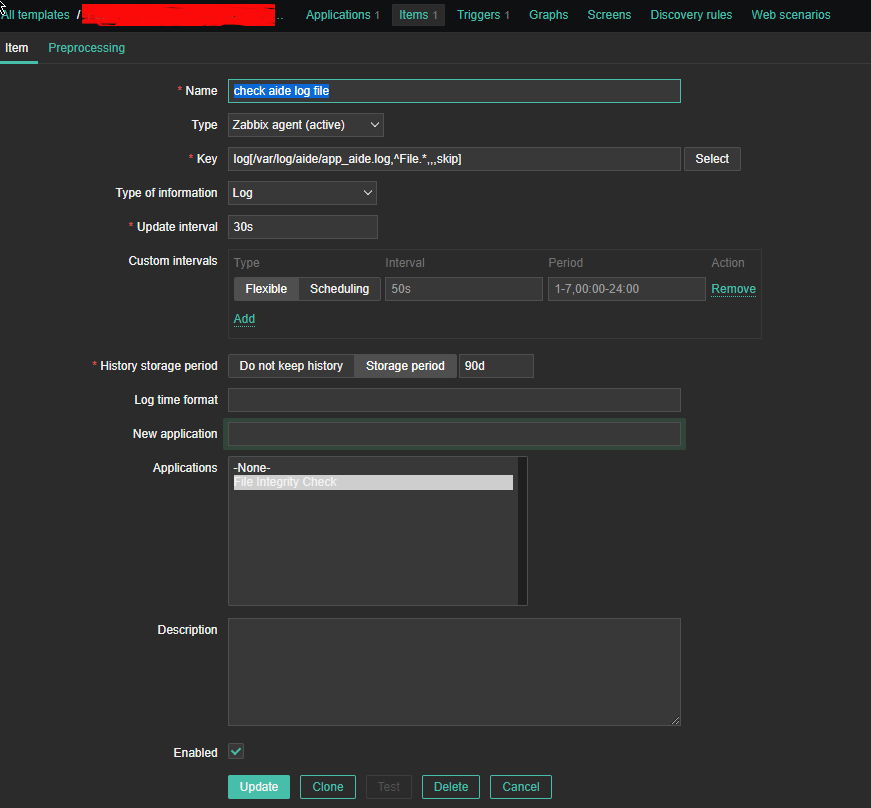
2.2 Configure Item like

aide-zabbix-triggers-screenshot
 

*Name: check aide log file

Type: zabbix (active)

log[/var/log/aide/app_aide.log,^File.*,,,skip]

Type of information: Log

Update Interval: 30s

Applications: File Integrity Check

Configure Trigger like

Enabled: Tick On

images/aide-zabbix-screenshots/check-aide-log-item


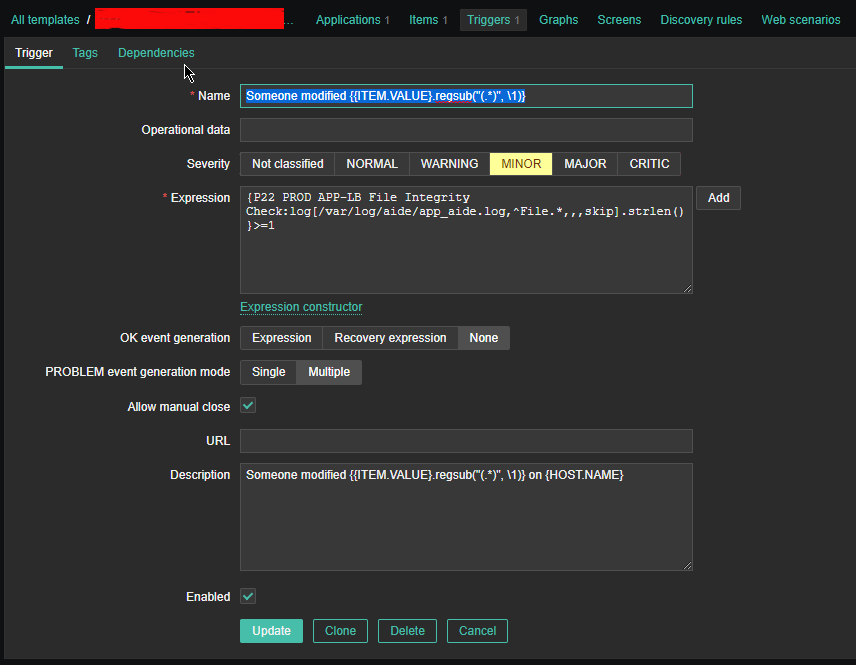
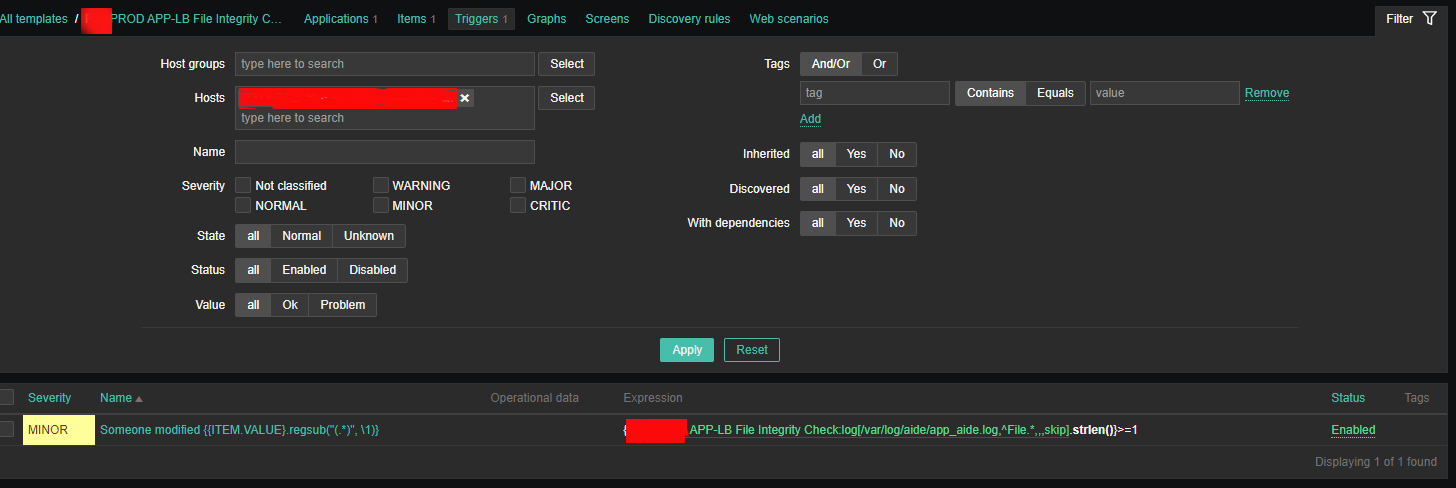
2.3 Create Triggers with the respective regular expressions, that would check the aide generated log file for file modifications


aide-zabbix-screenshot-minor-config

Configure Trigger like
 

Enabled: Tick On


*Name: Someone modified {{ITEM.VALUE}.regsub("(.*)", \1)}

*Expression: {PROD APP-LB File Integrity Check:log[/var/log/aide/app_aide.log,^File.*,,,skip].strlen()}>=1

Allow manual close: yes tick

*Description: Someone modified {{ITEM.VALUE}.regsub("(.*)", \1)} on {HOST.NAME}


2.4 Configure Action


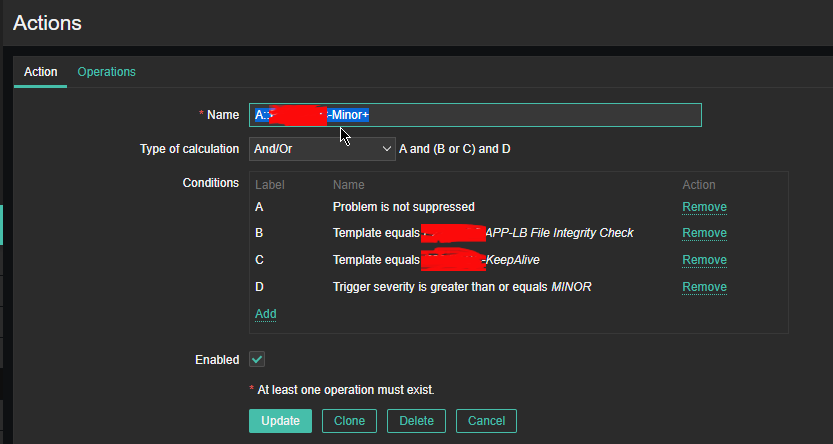
aide-zabbix-file-monitoring-action-screensho

Now assuming the Zabbix server has  a properly set media for communication and you set Alerting rules zabbix-server can be easily set tosend mails to a Support email to get Notifications Alerts, everytime a monitored file by aide gets changed.

That's all folks ! Enjoy being notified on every file change on your servers  !
 

Enable zabbix agent to work with SeLinux enabled on CentOS 7 Linux

Wednesday, October 19th, 2022

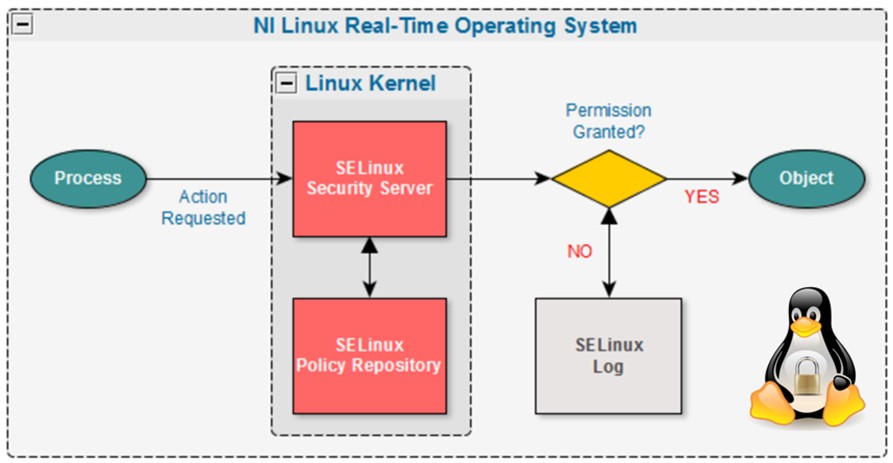
If you have the task to install and use zabbix-agent or zabbix-proxy to report to zabbix-server on CentOS 7 with enabled SeLinux services for security reasons and you have no mean to disable the selinux which is a common step to take under this circumstances, you will have to add the zabbix services to be exluded as permissive in selinux. In below article I'll show you how this is done in few easy steps.

zabbix-agent-service-selinux-linux-real-time-operating-sytems


1. Check the system sestatus

[root@linux zabbix]# sestatus
SELinux status:                 enabled
SELinuxfs mount:                /sys/fs/selinux
SELinux root directory:         /etc/selinux
Loaded policy name:             targeted
Current mode:                   enforcing
Mode from config file:          enforcing

Policy MLS status:              enabled
Policy deny_unknown status:     allowed
Max kernel policy version:      28


2. Enable zabbix to be permissive in selinux

To be able to set zabbix to be in permissive mode as well as for further troubleshooting if you have to enable other  linux services inside selinux you have to install below RPM packs.

[root@linux zabbix]# yum install setroubleshoot.x86_64 setools.x86_64 setools-console.x86_64 policycoreutils-python.x86_64

Set the zabbix permissive exclude rule in SeLINUX

[root@linux zabbix]# semanage permissive –add zabbix_t

Re-run the zabbix proxy (if you have a local zabbix-proxy running and the zabbix-agent)

[root@linux zabbix]# systemctl start zabbix-proxy.service

[root@linux zabbix]# systemctl start zabbix-agent.service

[root@linux zabbix]# systemctl status zabbix-agent
● zabbix-agent.service – Zabbix Agent
   Loaded: loaded (/usr/lib/systemd/system/zabbix-agent.service; enabled; vendor preset: disabled)
   Active: active (running) since Tue 2022-10-18 09:30:16 CEST; 1 day 7h ago
 Main PID: 962952 (zabbix_agentd)
    Tasks: 6 (limit: 100884)
   Memory: 5.1M
   CGroup: /system.slice/zabbix-agent.service
           ├─962952 /usr/sbin/zabbix_agentd -c /etc/zabbix/zabbix_agentd.conf
           ├─962955 /usr/sbin/zabbix_agentd: collector [idle 1 sec]
           ├─962956 /usr/sbin/zabbix_agentd: listener #1 [waiting for connection]
           ├─962957 /usr/sbin/zabbix_agentd: listener #2 [waiting for connection]
           ├─962958 /usr/sbin/zabbix_agentd: listener #3 [waiting for connection]
           └─962959 /usr/sbin/zabbix_agentd: active checks #1 [idle 1 sec]

Oct 18 09:30:16 linux systemd[1]: Starting Zabbix Agent…
Oct 18 09:30:16 linux systemd[1]: Started Zabbix Agent.

3. Check inside audit logs all is OK

To make sure zabbix is really enabled to be omitted by selinux rules check audit.log

[root@linux zabbix]# grep zabbix_proxy /var/log/audit/audit.log

That's all folks, Enjoy ! 🙂

How to create multiple haproxy instance separate processes for different configuration listeners with systemd on single Linux server

Tuesday, August 30th, 2022

HAProxy-Multiple-instanes-with-systemd-on-same-host-howto-Load-Balance-Your-Servers

In this aticle will be explained, howto configure multiple haproxy instances with separate haproxy binary wrappers and configs to run on the same Linux server host
by creating and using systemd additional .services.

Usually haproxy as installed and  ran standard on Linux swapns 2 listener processes which are configured to serve any proxy configuration setup inside /etc/haproxy/haproxy.cfg.

Here is example:

[root@haproxy2:~ ]# ps -ef|grep -i haproxy
root      128464       1  0 Aug11 ?        00:01:19 /usr/sbin/haproxy -Ws -f /etc/haproxy/haproxy.cfg -p /run/haproxy.pid -S /run/haproxy-master.sock
haproxy   128466  128464  0 Aug11 ?        00:49:24 /usr/sbin/haproxy -Ws -f /etc/haproxy/haproxy.cfg -p /run/haproxy.pid -S /run/haproxy-master.sock

However what if you need to have a multiple services to be proxied and you need to have multiple configuration files separated under various
/etc/haproxy/ stored files (.e.g /etc/haproxy/haproxy-customer1.cfg /etc/haproxy-customer2.cfg /etc/haproxy-custmXYZ.fg) etc. , what then how this can be done ?

Besides the many down sides of involving systemd into Linux, there is some good sides of it, as on any modern Linux there is a separate service to manage haproxy as of year 2022 on most modern Linuxes Debian / CentOS / Redhat the location where usually systemd service scripts are located is under directory /usr/lib/systemd/system/ the systemd managed service files are with extension .service

[root@haproxy2:/usr/lib/systemd/system ]# ls -al haproxy.service
-rw-r–r– 1 root root 1509 Sep  5  2021 haproxy.service

[root@haproxy2:/usr/lib/systemd/system ]# ls -al cron.service
-rw-r–r– 1 root root 316 Feb 23  2021 cron.service

[root@haproxy2:/usr/lib/systemd/system ]# ls -al networking.service
-rw-r–r– 1 root root 643 Sep 21  2020 networking.service

[root@haproxy2:/usr/lib/systemd/system ]# ls -al systemd-journald.service
-rw-r–r– 1 root root 1812 Jul 13  2021 systemd-journald.service


1. Create new haproxy-custom.service and /etc/haproxy.cfg file copies
 

Adding new services that will be managed by systemd is pretty simple hence, you just need to have the original service file in that case this is haproxy.service and modify it a bit, original haproxy.service file on Red Hat Enterprise Linux release 8.5 (Ootpa) would look like this

Make exact copy of haproxy.service to haproxy-your-custom.service

[root@haproxy2:/usr/lib/systemd/system ]#  cp -vprf haproxy.service haproxy-customname.service
'haproxy.service' -> 'haproxy-customname.service'

[root@haproxy2:/usr/lib/systemd/system]# cp -vrpf /etc/haproxy/haproxy.cfg /etc/haproxy/haproxy_customname_prod.cfg
'/etc/haproxy/haproxy.cfg' -> '/etc/haproxy/haproxy_customname_prod.cfg'


2. Modify the new haproxy-customname.service and haproxy-custoname.cfg

a) Create hardlink copy of /usr/sbin/haproxy binary

It is a good idea to separte the haproxy executable binary for the additional systemd haproxy instance. This can be done either by copying /usr/sbin/haproxy to something like /usr/sbin/haproxy-customname-wrapper or by creating a hard link. As i'm cautious to keep the haproxy-customname-wrapper binary up2date and updated together once the haproxy rpm package / deb package is updated either with yum or apt depending on the Linux distro, hard link  use is always better.
Just for reference hardlink does keep an own copy of the binary data and occupies additional Filesystem inodes, but at the same time the first inode of the binary does point to the original binary, meaning that a package update will make the hardlink be updated up to the latest version of the file and no extra management of the hard linked haproxy-customname-wrapper is necessery.

[root@haproxy2:/usr/sbin ]# ln haproxy haproxy-custname-wrapper

[root@haproxy2:/usr/sbin ]#  ls -al haproxy-custname-wrapper
-rwxr-xr-x 2 root root 2541848 Sep  5  2021 haproxy-custname-wrapper*
root@haproxy2:/usr/sbin# ls -al haproxy
-rwxr-xr-x 2 root root 2541848 Sep  5  2021 haproxy*


b) Modify haproxy-custoname.service systemd instance

The original service file will have content like

[Unit]
Description=HAProxy Load Balancer
After=network-online.target
Wants=network-online.target

[Service]
Environment="CONFIG=/etc/haproxy/haproxy.cfg" "PIDFILE=/run/haproxy.pid"
EnvironmentFile=/etc/sysconfig/haproxy
ExecStartPre=/usr/sbin/haproxy -f $CONFIG -c -q $OPTIONS
ExecStart=/usr/sbin/haproxy -Ws -f $CONFIG -p $PIDFILE $OPTIONS
ExecReload=/usr/sbin/haproxy -f $CONFIG -c -q $OPTIONS

ExecReload=/bin/kill -USR2 $MAINPID
SuccessExitStatus=143
KillMode=mixed
Type=notify

[Install]
WantedBy=multi-user.target


The modified one for the customname.service should have content similar to:
 

[Unit]
Description=HAProxy Load Balancer
After=network-online.target
Wants=network-online.target

[Service]
Environment="CONFIG=/etc/haproxy/haproxy_customname_prod.cfg" "PIDFILE=/run/haproxy_customname_prod.pid"
EnvironmentFile=/etc/sysconfig/haproxy
ExecStartPre=/usr/sbin/haproxy_customname -f $CONFIG -c -q $OPTIONS
ExecStart=/usr/sbin/haproxy_customname -Ws -f $CONFIG -p $PIDFILE $OPTIONS
ExecReload=/usr/sbin/haproxy_customname -f $CONFIG -c -q $OPTIONS

ExecReload=/bin/kill -USR2 $MAINPID
SuccessExitStatus=143
KillMode=mixed
Type=notify

[Install]
WantedBy=multi-user.target

c) modify haproxy_customname_prod.cfg

Do the required config and save the file, below is minimal config sample:

[root@haproxy2:/etc/haproxy ]#  vim /etc/haproxy/haproxy_customname_prod.cfg
 

#———————————————————————
# Global settings
#———————————————————————
global
    log          127.0.0.1 local6 debug
    chroot       /var/lib/haproxy
    pidfile      /run/haproxy.pid
    stats socket /var/lib/haproxy/haproxy.sock mode 0600 level admin
    maxconn      4000
    user         haproxy
    group        haproxy
    daemon
    #debug
    #quiet

#———————————————————————
# common defaults that all the 'listen' and 'backend' sections will
# use if not designated in their block
#———————————————————————
defaults
    mode        tcp
    log         global
#    option      dontlognull
#    option      httpclose
#    option      httplog
#    option      forwardfor
    option      redispatch
    option      log-health-checks
    timeout connect 10000 # default 10 second time out if a backend is not found
    timeout client 300000
    timeout server 300000
    maxconn     60000
    retries     3


#———————————————————————
# round robin balancing between the various backends
#———————————————————————

frontend Frotnend_customname1
        bind 10.10.10.1:15000
        mode tcp
        option tcplog
        #log global
        log-format [%t]\ %ci:%cp\ %bi:%bp\ %b/%s:%sp\ %Tw/%Tc/%Tt\ %B\ %ts\ %ac/%fc/%bc/%sc/%rc\ %sq/%bq

       default_backend Frontend_customname1

backend Frontend_customname1
        balance roundrobin
        timeout client 350000
        timeout server 350000
        timeout connect 35000
        server backend-server1 10.10.10.50:15000 weight 1 check port 15000
        server backend-server2 10.10.10.51:15000 weight 2  check port 15000


3. Reload systemd to make haproxy-customname.service known to systemctl, restart the freshly created service
and check its status


a) Execute daemon-reload to refresh known .service files in systemd

[root@haproxy2:/etc/haproxy ]# systemctl daemon-reload
[root@haproxy2:/etc/haproxy ]#


b) Restart haproxy-customname

[root@haproxy2:/usr/lib/systemd/system ]# systemctl restart haproxy-customname
[root@haproxy2:/usr/lib/systemd/system ]#

c) Check status is active running and process is properly forked

[root@haproxy2:/usr/lib/systemd/system ]# systemctl status haproxy-customname
● haproxy-customname.service – HAProxy Load Balancer
     Loaded: loaded (/lib/systemd/system/haproxy-customname.service; disabled; vendor preset: enabled)
     Active: active (running) since Tue 2022-08-30 13:15:35 EEST; 16s ago
       Docs: man:haproxy(1)
             file:/usr/share/doc/haproxy/configuration.txt.gz
    Process: 346635 ExecStartPre=/usr/sbin/haproxy-customname-wrapper -f $CONFIG -c -q $EXTRAOPTS (code=exited, status=0/SUCCES>
   Main PID: 346637 (haproxy-customn)
      Tasks: 3 (limit: 4654)
     Memory: 14.5M
        CPU: 68ms
     CGroup: /system.slice/haproxy-customname.service
             ├─346637 /usr/sbin/haproxy-customname-wrapper -Ws -f /etc/haproxy/haproxy_customname_prod.cfg -p /run/haproxy_cust>
             └─346639 /usr/sbin/haproxy-customname-wrapper -Ws -f /etc/haproxy/haproxy_customname_prod.cfg -p /run/haproxy_cust>

Aug 30 13:15:35 haproxy2 haproxy-customname-wrapper[346637]:    | timeouts are set to a non-zero value: 'client', 'connect', 's>
Aug 30 13:15:35 haproxy2 haproxy-customname-wrapper[346637]: [NOTICE] 241/131535 (346637) : New worker #1 (346639) forked
Aug 30 13:15:35 haproxy2 haproxy-customname-wrapper[346637]: Proxy webservers_http started.
Aug 30 13:15:35 haproxy2 haproxy-customname-wrapper[346637]: Proxy https-in started.
Aug 30 13:15:35 haproxy2 haproxy-customname-wrapper[346637]: Proxy webservers-https started.
Aug 30 13:15:35 haproxy2 haproxy-customname-wrapper[346637]: Proxy stats started.

The new haproxy-customname.service processes will be visible in process list together with the normal haproxy.service spawned processes:

[root@haproxy2:/usr/lib/systemd/system ]# ps -ef|grep -i hapro|grep -v grep
root      128464       1  0 Aug11 ?        00:01:19 /usr/sbin/haproxy -Ws -f /etc/haproxy/haproxy.cfg -p /run/haproxy.pid -S /run/haproxy-master.sock
haproxy   128466  128464  0 Aug11 ?        00:49:29 /usr/sbin/haproxy -Ws -f /etc/haproxy/haproxy.cfg -p /run/haproxy.pid -S /run/haproxy-master.sock

root      346637       1  0 13:15 ?        00:00:00 /usr/sbin/haproxy-customname-wrapper -Ws -f /etc/haproxy/haproxy_customname_prod.cfg -p /run/haproxy_customname_prod.pid -S /run/haproxy-customname-master.sock
haproxy   346639  346637  0 13:15 ?        00:00:00 /usr/sbin/haproxy-customname-wrapper -Ws -f /etc/haproxy/haproxy_customname_prod.cfg -p /run/haproxy_customname_prod.pid -S /run/haproxy-customname-master.sock


Following the same steps you can create as many separate haproxy instances as you like, but you have to be cautious not to intermix the listener ports for frontends. There is always risk when you copy from the original /etc/haproxy/haproxy.cfg to /etc/haproxy/haproxy-whatever.cfg to forget to change the listen port addresses in new config. 
Also note, that you might have problems, if you exceeed the usual maximum number of ports  65535 by using a high port ranges in the listeneres and due to that your additional systemd instances might refuse to start.

If you need to create a multiple bunch of systemd separte instances and haproxy configurations you can write easily a small script in bash that does this steps automatically.
Hope this article helped someone. If so drop me a thanks email or do your appreatiation for my blog by supporting my patreon.

Cheers ! 🙂

How to disable appArmor automatically installed and loaded after Linux Debian 10 to 11 Upgrade. Disable Apparmour on Deb based Linux

Friday, January 28th, 2022

check-apparmor-status-linux-howto-disable-Apparmor_on-debian-ubuntu-mint-and-other-deb-based-linux-distributions

I've upgraded recently all my machines from Debian Buster Linux 10 to Debian 11 Bullseye (if you wonder what Bullseye is) this is one of the heroes of Disneys Toy Stories which are used for a naming of General Debian Distributions.
After the upgrade most of the things worked expected, expect from some stuff like MariaDB (MySQL) and other weirdly behaving services. After some time of investigation being unable to find out what was causing the random issues observed on the machines. I finally got the strange daemon improper functioning and crashing was caused by AppArmor.

AppArmor ("Application Armor") is a Linux kernel security module that allows the system administrator to restrict programs' capabilities with per-program profiles. Profiles can allow capabilities like network access, raw socket access, and the permission to read, write, or execute files on matching paths. AppArmor supplements the traditional Unix discretionary access control (DAC) model by providing mandatory access control (MAC). It has been partially included in the mainline Linux kernel since version 2.6.36 and its development has been supported by Canonical since 2009.

The general idea of apparmor is wonderful as it could really strengthen system security, however it should be setup on install time and not setup on update time. For one more time I got convinced myself that upgrading from version to version to keep up to date with security is a hard task and often the results are too much unexpected and a better way to upgrade from General version to version any modern Linux / Unix distribution (and their forked mobile equivalents Android etc.) is to just make a copy of the most important configuration, setup the services on a freshly new installed machine be it virtual or a physical Server and rebuild the whole system from scratch, test and then run the system in production, substituting the old server general version with the new machine. 

The rest is leading to so much odd issues like this time with AppArmors causing distractions on the servers hosted applications.

But enough rent if you're unlucky and unwise enough to try to Upgrade Debian / Ubuntu 20, 21 / Mint 18, 19 etc. or whatever Deb distro from older general release to a newer One. Perhaps the best first thing to do onwards is stop and remove AppArmor (those who are hardcore enthusiasts could try to enable the failing services due to apparmor), by disabling the respective apparmor hardening profile but i did not have time to waste on stupid stuff and experiment so I preferred to completely stop it. 

To identify the upgrade oddities has to deal with apparmors service enabled security protections you should be able to find respective records inside /var/log/messages as well as in /var/log/audit/audit.log


# dmesg

[   64.210463] audit: type=1400 audit(1548120161.662:21): apparmor="DENIED" operation="sendmsg" info="Failed name lookup – disconnected path" error=-13 profile="/usr/sbin/mysqld" name="run/systemd/notify" pid=2527 comm="mysqld" requested_mask="w" denied_mask="w" fsuid=113 ouid=0
[  144.364055] audit: type=1400 audit(1548120241.595:22): apparmor="DENIED" operation="sendmsg" info="Failed name lookup – disconnected path" error=-13 profile="/usr/sbin/mysqld" name="run/systemd/notify" pid=2527 comm="mysqld" requested_mask="w" denied_mask="w" fsuid=113 ouid=0
[  144.465883] audit: type=1400 audit(1548120241.699:23): apparmor="DENIED" operation="sendmsg" info="Failed name lookup – disconnected path" error=-13 profile="/usr/sbin/mysqld" name="run/systemd/notify" pid=2527 comm="mysqld" requested_mask="w" denied_mask="w" fsuid=113 ouid=0
[  144.566363] audit: type=1400 audit(1548120241.799:24): apparmor="DENIED" operation="sendmsg" info="Failed name lookup – disconnected path" error=-13 profile="/usr/sbin/mysqld" name="run/systemd/notify" pid=2527 comm="mysqld" requested_mask="w" denied_mask="w" fsuid=113 ouid=0
[  144.666722] audit: type=1400 audit(1548120241.899:25): apparmor="DENIED" operation="sendmsg" info="Failed name lookup – disconnected path" error=-13 profile="/usr/sbin/mysqld" name="run/systemd/notify" pid=2527 comm="mysqld" requested_mask="w" denied_mask="w" fsuid=113 ouid=0
[  144.767069] audit: type=1400 audit(1548120241.999:26): apparmor="DENIED" operation="sendmsg" info="Failed name lookup – disconnected path" error=-13 profile="/usr/sbin/mysqld" name="run/systemd/notify" pid=2527 comm="mysqld" requested_mask="w" denied_mask="w" fsuid=113 ouid=0
[  144.867432] audit: type=1400 audit(1548120242.099:27): apparmor="DENIED" operation="sendmsg" info="Failed name lookup – disconnected path" error=-13 profile="/usr/sbin/mysqld" name="run/systemd/notify" pid=2527 comm="mysqld" requested_mask="w" denied_mask="w" fsuid=113 ouid=0


1. How to check if AppArmor is running on the system

If you have a system with enabled apparmor you should get some output like:

root@haproxy2:~# apparmor_status 
apparmor module is loaded.
5 profiles are loaded.
5 profiles are in enforce mode.
   /usr/sbin/ntpd
   lsb_release
   nvidia_modprobe
   nvidia_modprobe//kmod
   tcpdump
0 profiles are in complain mode.
1 processes have profiles defined.
1 processes are in enforce mode.
   /usr/sbin/ntpd (387) 
0 processes are in complain mode.
0 processes are unconfined but have a profile defined.


Also if you check the service you will find out that Debian's Major Release upgrade from 10 Buster to 11 BullsEye with.

apt update -y && apt upgrade -y && apt dist-update -y

automatically installed apparmor and started the service, e.g.:

# systemctl status apparmor
● apparmor.service – Load AppArmor profiles
     Loaded: loaded (/lib/systemd/system/apparmor.service; enabled; vendor pres>
     Active: active (exited) since Sat 2022-01-22 23:04:58 EET; 5 days ago
       Docs: man:apparmor(7)
             https://gitlab.com/apparmor/apparmor/wikis/home/
    Process: 205 ExecStart=/lib/apparmor/apparmor.systemd reload (code=exited, >
   Main PID: 205 (code=exited, status=0/SUCCESS)
        CPU: 43ms

яну 22 23:04:58 haproxy2 apparmor.systemd[205]: Restarting AppArmor
яну 22 23:04:58 haproxy2 apparmor.systemd[205]: Reloading AppArmor profiles
яну 22 23:04:58 haproxy2 systemd[1]: Starting Load AppArmor profiles…
яну 22 23:04:58 haproxy2 systemd[1]: Finished Load AppArmor profiles.


# dpkg -l |grep -i apparmor
ii  apparmor                          2.13.6-10                      amd64        user-space parser utility for AppArmor
ii  libapparmor1:amd64                2.13.6-10                      amd64        changehat AppArmor library
ii  libapparmor-perl:amd64               2.13.6-10


In case AppArmor is disabled, you will get something like:

root@pcfrxenweb:~# aa-status 
apparmor module is loaded.
0 profiles are loaded.
0 profiles are in enforce mode.
0 profiles are in complain mode.
0 processes have profiles defined.
0 processes are in enforce mode.
0 processes are in complain mode.
0 processes are unconfined but have a profile defined.


2. How to disable AppArmor for particular running services processes

In my case after the upgrade of a system running a MySQL Server suddenly out of nothing after reboot the Database couldn't load up properly and if I try to restart it with the usual

root@pcfrxen: /# systemctl restart mariadb

I started getting errors like:

DBI connect failed : Can't connect to local MySQL server through socket '/var/run/mysqld/mysqld.sock' (2)

To get an idea of what kind of profile definitions, could be enabled disabled on apparmor enabled system do:
 

root@pcfrxen:/var/log# ls -1 /etc/apparmor.d/
abstractions/
force-complain/
local/
lxc/
lxc-containers
samba/
system_tor
tunables/
usr.bin.freshclam
usr.bin.lxc-start
usr.bin.man
usr.bin.tcpdump
usr.lib.telepathy
usr.sbin.clamd
usr.sbin.cups-browsed
usr.sbin.cupsd
usr.sbin.ejabberdctl
usr.sbin.mariadbd
usr.sbin.mysqld
usr.sbin.named
usr.sbin.ntpd
usr.sbin.privoxy
usr.sbin.squid

Lets say you want to disable any protection AppArmor profile for MySQL you can do it with:

root@pcfrxen:/ #  ln -s /etc/apparmor.d/usr.sbin.mysqld /etc/apparmor.d/disable/
root@pcfrxen:/ # apparmor_parser -R /etc/apparmor.d/usr.sbin.mysqld 


To make the system know you have disabled a profile you should restart apparmor service:
 

root@pcfrxen:/ # systemctl restart apparmor.service


3. Disable completely AppArmor to save your time weird system behavior and hang bangs

In my opinion the best thing to do anyways, especially if you don't run Containerized applications, that runs only one single application / service at at time is to completely disable apparmor, otherwise you would have to manually check each of the running applications before the upgrade and make sure that apparmor did not bring havoc to some of it.
Hence my way was to simple get rid of apparmor by disable and remove the related package completely out of the system to do so:

root@pcfrxen:/ # systemctl stop apparmor
root@pcfrxen:/ # systemctl disable apparmor
root@pcfrxen:/ # apt-get remove -y apparmor

Once  disabled to make the system completely load out anything loaded related to apparmor loaded into system memory, you should do machine reboot.

root@pcfrxen:/ # shutdown -r now

Hopefully if you run into same issue after removal of apparmor most of the things should be working fine after the upgrade. Anyways I had to go through each and every app everywhere and make sure it is working as expected. The major release upgrade has also automatically enabled me some of the already disable services, thus if you have upgraded like me I would advice you do a close check on every enabled / running service everywhere:

root@pcfrxen:/# systemctl list-unit-files|grep -i enabled

Beware of AppArmor  !!! 🙂

Install and enable Sysstats IO / DIsk / CPU / Network monitoring console suite on Redhat 8.3, Few sar useful command examples

Tuesday, September 28th, 2021

linux-sysstat-monitoring-logo


Why to monitoring CPU, Memory, Hard Disk, Network usage etc. with sysstats tools?
 

Using system monitoring tools such as Zabbix, Nagios Monit is a good approach, however sometimes due to zabbix server interruptions you might not be able to track certain aspects of system performance on time. Thus it is always a good idea to 
Gain more insights on system peroformance from command line. Of course there is cmd tools such as iostat and top, free, vnstat that provides plenty of useful info on system performance issues or bottlenecks. However from my experience to have a better historical data that is systimized and all the time accessible from console it is a great thing to have sysstat package at place. Since many years mostly on every server I administer, I've been using sysstats to monitor what is going on servers over a short time frames and I'm quite happy with it. In current company we're using Redhats and CentOS-es and I had to install sysstats on Redhat 8.3. I've earlier done it multiple times on Debian / Ubuntu Linux and while I've faced on some .deb distributions complications of making sysstat collect statistics I've come with an article on Howto fix sysstat Cannot open /var/log/sysstat/sa no such file or directory” on Debian / Ubuntu Linux
 

Sysstat contains the following tools related to collecting I/O and CPU statistics:
iostat
Displays an overview of CPU utilization, along with I/O statistics for one or more disk drives.
mpstat
Displays more in-depth CPU statistics.
Sysstat also contains tools that collect system resource utilization data and create daily reports based on that data. These tools are:
sadc
Known as the system activity data collector, sadc collects system resource utilization information and writes it to a file.
sar
Producing reports from the files created by sadc, sar reports can be generated interactively or written to a file for more intensive analysis.

My experience with CentOS 7 and Fedora to install sysstat it was pretty straight forward, I just had to install it via yum install sysstat wait for some time and use sar (System Activity Reporter) tool to report collected system activity info stats over time.
Unfortunately it seems on RedHat 8.3 as well as on CentOS 8.XX instaling sysstats does not work out of the box.

To complete a successful installation of it on RHEL 8.3, I had to:

[root@server ~]# yum install -y sysstat


To make sysstat enabled on the system and make it run, I've enabled it in sysstat

[root@server ~]# systemctl enable sysstat


Running immediately sar command, I've faced the shitty error:


Cannot open /var/log/sysstat/sa18:
No such file or directory. Please check if data collecting is enabled”


Once installed I've waited for about 5 minutes hoping, that somehow automatically sysstat would manage it but it didn't.

To solve it, I've had to create additionally file /etc/cron.d/sysstat (weirdly RPM's post install instructions does not tell it to automatically create it)

[root@server ~]# vim /etc/cron.d/sysstat

# run system activity accounting tool every 10 minutes
0 * * * * root /usr/lib64/sa/sa1 60 59 &
# generate a daily summary of process accounting at 23:53
53 23 * * * root /usr/lib64/sa/sa2 -A &


  • /usr/local/lib/sa1 is a shell script that we can use for scheduling cron which will create daily binary log file.
  • /usr/local/lib/sa2 is a shell script will change binary log file to human-readable form.


[root@server ~]# chmod 600 /etc/cron.d/sysstat

[root@server ~]# systemctl restart sysstat


In a while if sysstat is working correctly you should get produced its data history logs inside /var/log/sa

[root@server ~]# ls -al /var/log/sa 


Note that the standard sysstat history files on Debian and other modern .deb based distros such as Debian 10 (in  y.2021) is stored under /var/log/sysstat

Here is few useful uses of sysstat cmds


1. Check with sysstat machine history SWAP and RAM Memory use


To lets say check last 10 minutes SWAP memory use:

[hipo@server yum.repos.d] $ sar -W  |last -n 10
 

Linux 4.18.0-240.el8.x86_64 (server)       09/28/2021      _x86_64_        (8 CPU)

12:00:00 AM  pswpin/s pswpout/s
12:00:01 AM      0.00      0.00
12:01:01 AM      0.00      0.00
12:02:01 AM      0.00      0.00
12:03:01 AM      0.00      0.00
12:04:01 AM      0.00      0.00
12:05:01 AM      0.00      0.00
12:06:01 AM      0.00      0.00

[root@ccnrlb01 ~]# sar -r | tail -n 10
14:00:01        93008   1788832     95.06         0   1357700    725740      9.02    795168    683484        32
14:10:01        78756   1803084     95.81         0   1358780    725740      9.02    827660    652248        16
14:20:01        92844   1788996     95.07         0   1344332    725740      9.02    813912    651620        28
14:30:01        92408   1789432     95.09         0   1344612    725740      9.02    816392    649544        24
14:40:01        91740   1790100     95.12         0   1344876    725740      9.02    816948    649436        36
14:50:01        91688   1790152     95.13         0   1345144    725740      9.02    817136    649448        36
15:00:02        91544   1790296     95.14         0   1345448    725740      9.02    817472    649448        36
15:10:01        91108   1790732     95.16         0   1345724    725740      9.02    817732    649340        36
15:20:01        90844   1790996     95.17         0   1346000    725740      9.02    818016    649332        28
Average:        93473   1788367     95.03         0   1369583    725074      9.02    800965    671266        29


2. Check system load? Are my processes waiting too long to run on the CPU?

[root@server ~ ]# sar -q |head -n 10
Linux 4.18.0-240.el8.x86_64 (server)       09/28/2021      _x86_64_        (8 CPU)

12:00:00 AM   runq-sz  plist-sz   ldavg-1   ldavg-5  ldavg-15   blocked
12:00:01 AM         0       272      0.00      0.02      0.00         0
12:01:01 AM         1       271      0.00      0.02      0.00         0
12:02:01 AM         0       268      0.00      0.01      0.00         0
12:03:01 AM         0       268      0.00      0.00      0.00         0
12:04:01 AM         1       271      0.00      0.00      0.00         0
12:05:01 AM         1       271      0.00      0.00      0.00         0
12:06:01 AM         1       265      0.00      0.00      0.00         0


3. Show various CPU statistics per CPU use
 

On a multiprocessor, multi core server sometimes for scripting it is useful to fetch processor per use historic data, 
this can be attained with:


[hipo@server ~ ] $ mpstat -P ALL
Linux 4.18.0-240.el8.x86_64 (server)       09/28/2021      _x86_64_        (8 CPU)

06:08:38 PM  CPU    %usr   %nice    %sys %iowait    %irq   %soft  %steal  %guest  %gnice   %idle
06:08:38 PM  all    0.17    0.02    0.25    0.00    0.05    0.02    0.00    0.00    0.00   99.49
06:08:38 PM    0    0.22    0.02    0.28    0.00    0.06    0.03    0.00    0.00    0.00   99.39
06:08:38 PM    1    0.28    0.02    0.36    0.00    0.08    0.02    0.00    0.00    0.00   99.23
06:08:38 PM    2    0.27    0.02    0.31    0.00    0.06    0.01    0.00    0.00    0.00   99.33
06:08:38 PM    3    0.15    0.02    0.22    0.00    0.03    0.01    0.00    0.00    0.00   99.57
06:08:38 PM    4    0.13    0.02    0.20    0.01    0.03    0.01    0.00    0.00    0.00   99.60
06:08:38 PM    5    0.14    0.02    0.27    0.00    0.04    0.06    0.01    0.00    0.00   99.47
06:08:38 PM    6    0.10    0.02    0.17    0.00    0.04    0.02    0.00    0.00    0.00   99.65
06:08:38 PM    7    0.09    0.02    0.15    0.00    0.02    0.01    0.00    0.00    0.00   99.70


sar-sysstat-cpu-statistics-screenshot

Monitor processes and threads currently being managed by the Linux kernel.

[hipo@server ~ ] $ pidstat

pidstat-various-random-process-statistics

[hipo@server ~ ] $ pidstat -d 2


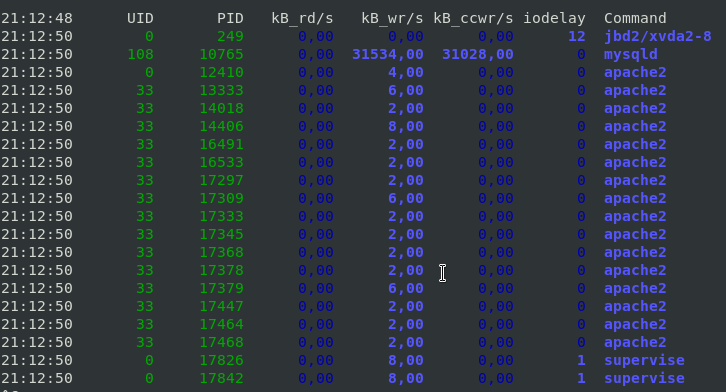
pidstat-show-processes-with-most-io-activities-linux-screenshot

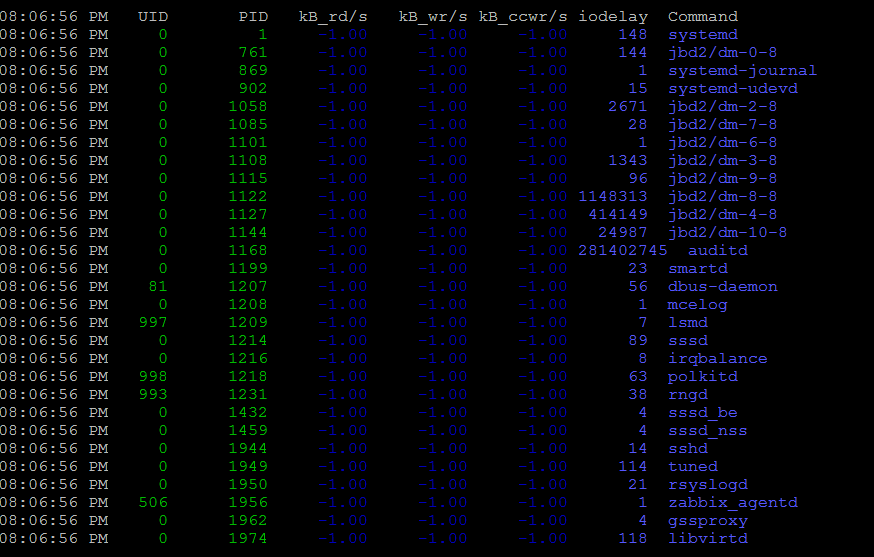
This report tells us that there is few processes with heave I/O use Filesystem system journalling daemon jbd2, apache, mysqld and supervise, in 3rd column you see their respective PID IDs.

To show threads used inside a process (like if you press SHIFT + H) inside Linux top command:

[hipo@server ~ ] $ pidstat -t -p 10765 1 3

Linux 4.19.0-14-amd64 (server)     28.09.2021     _x86_64_    (10 CPU)

21:41:22      UID      TGID       TID    %usr %system  %guest   %wait    %CPU   CPU  Command
21:41:23      108     10765         –    1,98    0,99    0,00    0,00    2,97     1  mysqld
21:41:23      108         –     10765    0,00    0,00    0,00    0,00    0,00     1  |__mysqld
21:41:23      108         –     10768    0,00    0,00    0,00    0,00    0,00     0  |__mysqld
21:41:23      108         –     10771    0,00    0,00    0,00    0,00    0,00     5  |__mysqld
21:41:23      108         –     10784    0,00    0,00    0,00    0,00    0,00     7  |__mysqld
21:41:23      108         –     10785    0,00    0,00    0,00    0,00    0,00     6  |__mysqld
21:41:23      108         –     10786    0,00    0,00    0,00    0,00    0,00     2  |__mysqld

10765 – is the Process ID whose threads you would like to list

With pidstat, you can further monitor processes for memory leaks with:

[hipo@server ~ ] $ pidstat -r 2


4. Report paging statistics for some old period


[root@server ~ ]# sar -B -f /var/log/sa/sa27 |head -n 10
Linux 4.18.0-240.el8.x86_64 (server)       09/27/2021      _x86_64_        (8 CPU)

15:42:26     LINUX RESTART      (8 CPU)

15:55:30     LINUX RESTART      (8 CPU)

04:00:01 PM  pgpgin/s pgpgout/s   fault/s  majflt/s  pgfree/s pgscank/s pgscand/s pgsteal/s    %vmeff
04:01:01 PM      0.00     14.47    629.17      0.00    502.53      0.00      0.00      0.00      0.00
04:02:01 PM      0.00     13.07    553.75      0.00    419.98      0.00      0.00      0.00      0.00
04:03:01 PM      0.00     11.67    548.13      0.00    411.80      0.00      0.00      0.00      0.00


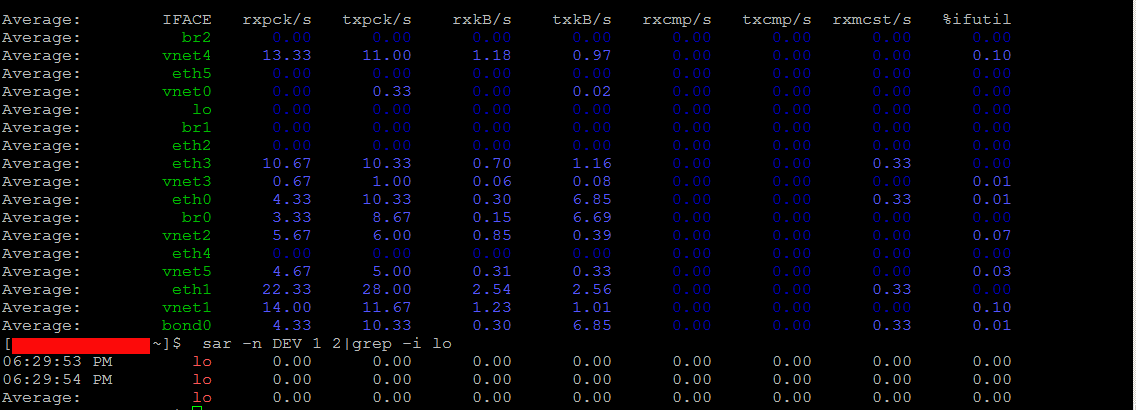
5.  Monitor Received RX and Transmitted TX network traffic perl Network interface real time
 

To print out Received and Send traffic per network interface 4 times in a raw

sar-sysstats-network-traffic-statistics-screenshot
 

[hipo@server ~ ] $ sar -n DEV 1 4


To continusly monitor all network interfaces I/O traffic

[hipo@server ~ ] $ sar -n DEV 1


To only monitor a certain network interface lets say loopback interface (127.0.0.1) received / transmitted bytes

[hipo@server yum.repos.d] $  sar -n DEV 1 2|grep -i lo
06:29:53 PM        lo      0.00      0.00      0.00      0.00      0.00      0.00      0.00      0.00
06:29:54 PM        lo      0.00      0.00      0.00      0.00      0.00      0.00      0.00      0.00
Average:           lo      0.00      0.00      0.00      0.00      0.00      0.00      0.00      0.00


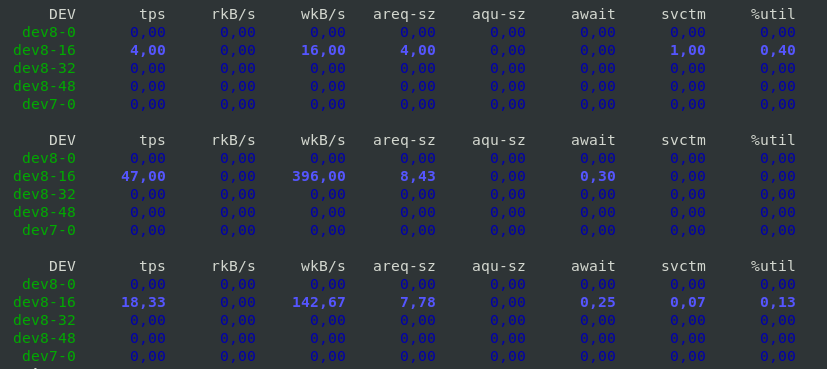
6. Monitor block devices use
 

To check block devices use 3 times in a raw
 

[hipo@server yum.repos.d] $ sar -d 1 3


sar-sysstats-blockdevice-statistics-screenshot
 

7. Output server monitoring data in CSV database structured format


For preparing a nice graphs with Excel from CSV strucuted file format, you can dump the collected data as so:

 [root@server yum.repos.d]# sadf -d /var/log/sa/sa27 — -n DEV | grep -v lo|head -n 10
server-name-fqdn;-1;2021-09-27 13:42:26 UTC;LINUX-RESTART    (8 CPU)
# hostname;interval;timestamp;IFACE;rxpck/s;txpck/s;rxkB/s;txkB/s;rxcmp/s;txcmp/s;rxmcst/s;%ifutil
server-name-fqdn;-1;2021-09-27 13:55:30 UTC;LINUX-RESTART    (8 CPU)
# hostname;interval;timestamp;IFACE;rxpck/s;txpck/s;rxkB/s;txkB/s;rxcmp/s;txcmp/s;rxmcst/s;%ifutil
server-name-fqdn;60;2021-09-27 14:01:01 UTC;eth1;19.42;16.12;1.94;1.68;0.00;0.00;0.00;0.00
server-name-fqdn;60;2021-09-27 14:01:01 UTC;eth0;7.18;9.65;0.55;0.78;0.00;0.00;0.00;0.00
server-name-fqdn;60;2021-09-27 14:01:01 UTC;eth2;5.65;5.13;0.42;0.39;0.00;0.00;0.00;0.00
server-name-fqdn;60;2021-09-27 14:02:01 UTC;eth1;18.90;15.55;1.89;1.60;0.00;0.00;0.00;0.00
server-name-fqdn;60;2021-09-27 14:02:01 UTC;eth0;7.15;9.63;0.55;0.74;0.00;0.00;0.00;0.00
server-name-fqdn;60;2021-09-27 14:02:01 UTC;eth2;5.67;5.15;0.42;0.39;0.00;0.00;0.00;0.00

To graph the output data you can use Excel / LibreOffice's Excel equivalent Calc or if you need to dump a CSV sar output and generate it on the fly from a script  use gnuplot 


What we've learned?


How to install and enable on cron sysstats on Redhat and CentOS 8 Linux ? 
How to continuously monitor CPU / Disk and Network, block devices, paging use and processes and threads used by the kernel per process ?  
As well as how to export previously collected data to CSV to import to database or for later use inrder to generate graphic presentation of data.
Cheers ! 🙂


Linux: How to set KVM Virtual Machine to autostart on system boot

Thursday, July 15th, 2021

linux-kvm-set-vm-to-automatically-boot-on-linux-system-boot

Recently I've written a short article on how to make auto boot OpenVZ container Virtual Machine if system gets rebooted as I had the task to do so in daily job as sysadmin.
Few days ago after some power outage in one of Frankfurt based Data Centers, some Rack tech equipment has been temporary powered of and once the electricity was up again, some Linux servers  running Kernel Based Virtualization ( KVM ) some of the virtual machines did not managed to automatically start up and we had to manually start them one by one.
To manually start each of the machines that did not start up had to do the trivial:

[root@hypervisor ~]# virsh list
 Id    Name                           State
—————————————————-
 3     VM500                   running

[root@hypervisor ~]# virsh dominfo VM500
Id:             3
Name:           VM500
UUID:           82075903-a4ce-5ec0-a3d8-9ee83d85fc75
OS Type:        hvm
State:          running
CPU(s):         2
CPU time:       247407.9s
Max memory:     2097152 KiB
Used memory:    2097152 KiB
Persistent:     yes
Autostart:      disable
Managed save:   no
Security model: selinux
Security DOI:   0
Security label: system_u:system_r:svirt_t:s0:c447,c723 (permissive)

[root@hypervisor ~]# virsh start VM_domain_Name

Of course logcally to prevent future issues in case if Linux server gets suddenly rebooted due to whatever reason, we had to configure the machines in questions to automatically boot on OS system boot.

In some rare cases if above start command does not help you might want to check what is the status of libvirtd and investigate the logs in /var/log/libvirt/ i.e. /var/log/libvirt/libvirt.log

An alternative but more complicated way to set virtual machine to automatically start on boot is by using default location for automatic VM start just like OpenXEn has its /etc/xen/auto/ dirtory from where each soft symlinked VM configuration from /etc/xen/VM_name.cfg is started in KVM Hypervisor hosts to auto boot a certain vm you have to link /etc/libvirt/qemu/VM-to-autoboot-name.xml to /etc/libvirt/qemu/autostart/VM-to-autoboot-name.xml

[root@hypervisor ~]# systemctl status libvirtd
● libvirtd.service – Virtualization daemon
   Loaded: loaded (/usr/lib/systemd/system/libvirtd.service; enabled; vendor preset: enabled)
   Active: active (running) since Tue 2021-06-29 10:21:30 CEST; 2 weeks 2 days ago
     Docs: man:libvirtd(8)
           https://libvirt.org
 Main PID: 1809 (libvirtd)
    Tasks: 22 (limit: 32768)
   CGroup: /system.slice/libvirtd.service
           ├─1809 /usr/sbin/libvirtd
           ├─2335 /usr/sbin/dnsmasq –conf-file=/var/lib/libvirt/dnsmasq/default.conf –leasefile-ro –dhcp-script=/us…
           ├─2336 /usr/sbin/dnsmasq –conf-file=/var/lib/libvirt/dnsmasq/default.conf –leasefile-ro –dhcp-script=/us…
           ├─2386 /usr/sbin/dnsmasq –conf-file=/var/lib/libvirt/dnsmasq/Host-Only.conf –leasefile-ro –dhcp-script=/…
           └─2387 /usr/sbin/dnsmasq –conf-file=/var/lib/libvirt/dnsmasq/Host-Only.conf –leasefile-ro –dhcp-script=/…

If for some reason libvirtd is not running or disabled state you will have to enable it with:

[root@hypervisor ~]# systemctl enable libvirtd

If the virtualization is running on some RPM based distribtuion OpenSuse whatever and libvirtd is controlled via chkconfig (redhat runlevel alternative system), you will have to :

[root@hypervisor ~]# chkconfig libvirtd on

Disabling KVM Virtual Machine from auto start on server boot

[root@hypervisor ~]# virsh autostart Debian10 –disable
Domain Debian10 unmarked as autostarted

Fix Zabbix selinux caused permission issues on CentOS 7 Linux / cannot set resource limit: [13] Permission denied error solution

Tuesday, July 6th, 2021

zabbix-selinux-logo-fix-zabbix-permission-issues-when-running-on-ceontos-linux-change-selinux-to-permissive-howto.

If you have to install Zabbix client that has to communicate towards Zabbix server via a Zabbix Proxy you might be unpleasently surprised that it cannot cannot be start if the selinux mode is set to Enforcing.
Error message like on below screenshot will be displayed when starting proxy client with systemctl.

zabbix-proxy-cannot-be-started-due-to-selinux-permissions

In the zabbix logs you will see error  messages such as:
 

"cannot set resource limit: [13] Permission denied, CentOS 7"


29085:20160730:062959.263 Starting Zabbix Agent [Test host]. Zabbix 3.0.4 (revision 61185).
29085:20160730:062959.263 **** Enabled features ****
29085:20160730:062959.263 IPv6 support: YES
29085:20160730:062959.263 TLS support: YES
29085:20160730:062959.263 **************************
29085:20160730:062959.263 using configuration file: /etc/zabbix/zabbix_agentd.conf
29085:20160730:062959.263 cannot set resource limit: [13] Permission denied
29085:20160730:062959.263 cannot disable core dump, exiting…


Next step to do is to check whether zabbix is listed in selinux's enabled modules to do so run:
 

[root@centos ~ ]# semodules -l

…..
vhostmd    1.1.0
virt    1.5.0
vlock    1.2.0
vmtools    1.0.0
vmware    2.7.0
vnstatd    1.1.0
vpn    1.16.0
w3c    1.1.0
watchdog    1.8.0
wdmd    1.1.0
webadm    1.2.0
webalizer    1.13.0
wine    1.11.0
wireshark    2.4.0
xen    1.13.0
xguest    1.2.0
xserver    3.9.4
zabbix    1.6.0
zarafa    1.2.0
zebra    1.13.0
zoneminder    1.0.0
zosremote    1.2.0


[root@centos ~ ]# sestatus
# sestatusSELinux status:                 enabled
SELinuxfs mount:                /sys/fs/selinux
SELinux root directory:         /etc/selinux
Loaded policy name:             targeted
Current mode:                   enforcing
Mode from config file:          enforcing
Policy MLS status:              enabled
Policy deny_unknown status:     allowed
Max kernel policy version:      28

To get exact zabbix IDs that needs to be added as permissive for Selinux you can use ps -eZ like so:

[root@centos ~ ]# ps -eZ |grep -i zabbix
system_u:system_r:zabbix_agent_t:s0 1149 ?     00:00:00 zabbix_agentd
system_u:system_r:zabbix_agent_t:s0 1150 ?     00:04:28 zabbix_agentd
system_u:system_r:zabbix_agent_t:s0 1151 ?     00:00:00 zabbix_agentd
system_u:system_r:zabbix_agent_t:s0 1152 ?     00:00:00 zabbix_agentd
system_u:system_r:zabbix_agent_t:s0 1153 ?     00:00:00 zabbix_agentd
system_u:system_r:zabbix_agent_t:s0 1154 ?     02:21:46 zabbix_agentd

As you can see zabbix is enabled and hence selinux enforcing mode is preventing zabbix client / server to operate and communicate normally, hence to make it work we need to change zabbix agent and zabbix proxy to permissive mode.

Setting selinux for zabbix agent and zabbix proxy to permissive mode

If you don't have them installed you might neet the setroubleshoot setools, setools-console and policycoreutils-python rpms packs (if you have them installed skip this step).

[root@centos ~ ]# yum install setroubleshoot.x86_64 setools.x86_64 setools-console.x86_64 policycoreutils-python.x86_64

Then to add zabbix service to become permissive either run

[root@centos ~ ]# semanage permissive –add zabbix_t

[root@centos ~ ]# semanage permissive -a zabbix_agent_t


In some cases you might also need in case if just adding the permissive for zabbix_agent_t try also :

setsebool -P zabbix_can_network=1

Next try to start zabbox-proxy and zabbix-agent systemd services 

[root@centos ~ ]# systemctl start zabbix-proxy.service

[root@centos ~ ]# systemctl start zabbix-agent.service

Hopefully all should report fine with the service checking the status should show you something like:

[root@centos ~ ]# systemctl status zabbix-agent
● zabbix-agent.service – Zabbix Agent
   Loaded: loaded (/usr/lib/systemd/system/zabbix-agent.service; enabled; vendor preset: disabled)
   Active: active (running) since Thu 2021-06-24 07:47:42 CEST; 1 weeks 5 days ago
 Main PID: 1149 (zabbix_agentd)
   CGroup: /system.slice/zabbix-agent.service
           ├─1149 /usr/sbin/zabbix_agentd -c /etc/zabbix/zabbix_agentd.conf
           ├─1150 /usr/sbin/zabbix_agentd: collector [idle 1 sec]
           ├─1151 /usr/sbin/zabbix_agentd: listener #1 [waiting for connection]
           ├─1152 /usr/sbin/zabbix_agentd: listener #2 [waiting for connection]
           ├─1153 /usr/sbin/zabbix_agentd: listener #3 [waiting for connection]
           └─1154 /usr/sbin/zabbix_agentd: active checks #1 [idle 1 sec]

Check the Logs finally to make sure all is fine with zabbix being allowed by selinux.

[root@centos ~ ]# grep zabbix_proxy /var/log/audit/audit.log

[root@centos ~ ]# tail -n 100 /var/log/zabbix/zabbix_agentd.log


If no errors are in and you receive and you can visualize the usual zabbix collected CPU / Memory / Disk etc. values you're good, Enjoy ! 🙂

How to install / add new root certificates on Debian, Ubuntu, Mint Linux

Saturday, October 21st, 2017

add-install-new-root-ca-certificates-to-debian-ubuntu-linux-howto

How to add / Installing a root/CA Certificate on Debian, Ubuntu, Mint Linux


 Because of various auditing failures and other security issues, the CAcert root certificate set is slowly disappearing from the Ubuntu and Debian ‘ca-certificates’ package.

That's really tricky because if you're a system administrator or have a bunch of programmers whose needs is to install a new set of root certificates for their freshly develped Application or you have to make a corporate certificates added to debian rootca, then the good news is it is quite easy to install new certificates to deb based distributions.


Given a CA certificate file foo.crt, follow these steps to install it on Debian / Ubuntu:

    Create a directory for extra CA certificates in /usr/share/ca-certificates:


    debian:~# mkdir /usr/share/ca-certificates/extra-certificates


    Copy the CA .crt file to this directory:


    debian:~# cp foo.crt /usr/share/ca-certificates/extra-certificates/foo.crt


    Let Debian / Ubuntu add the .crt file's path relative to /usr/share/ca-certificates to /etc/ca-certificates.conf (the file lists certificates that you wish to use or to ignore to be installed in /etc/ssl/certs)


    debian:~# dpkg-reconfigure ca-certificates


In case you want to include a .pem file to the list of trustable certificates on Debian / Ubuntu, it must first be converted to a .crt file first, you can do that with:


    debian:~# openssl x509 -in foo.pem -inform PEM -out foo.crt


Lets say you want to add some custom Root certificate for exapmle cacert.org


   debian:~# mkdir /usr/local/share/ca-certificates/cacert.org
   debian:~# cd /usr/local/share/ca-certificates/cacert.org
   debian:~# mkdir /usr/local/share/ca-certificates/cacert.org
   debian:~# wget -P /usr/local/share/ca-certificates/cacert.org http://www.cacert.org/certs/root.crt http://www.cacert.org/certs/class3.crt


Then once again update the ca certificates bundle

   debian:~# update-ca-certificates