Archive for April, 2010

Checking your website for broken Links on Linux with linkchecker and htcheck / How to find broken links on your website

Friday, April 30th, 2010

Have you wondered how could you check your website for broken links? Cause I did!
You might wonder why should I care so hard about the broken links?

Well it’s simple broken links on your webpage will have an influence on how Google indexesyour website, and how often does it bother to crawl on your website in other words, havinga eagly eye on your broken links interface is a vital for every self respecting web developer,as well as for system administrators.
From a web development perspective, it’s important that your website have as less 404 error pages possible since that is important for Webpages W3C Compliancy.
On other hand if you’re a SEO Specialist, having as less broken links on your domains is vital for Google Pageranking,Yahoo, Live.com, Altavista, Yandex etc, as well as for general Good Search Engine Indexing.
Having said all that you should already feel the topic is really interesting. I believe not many people has wrote stuff aboutit online.
That’s why I decided to share with you a possible way on how to track your broken web domain for broken pages on the Linux and possibly other Unix compatible architectures.

There are plenty of tools available that could be used for finding out the broken linkson your website using Linux operating system.

I used apt-get in order to look for a link checker software for Linux

noah:/home/hipo/Desktop# apt-cache search 'link check'
htcheck-php - Simple php interface to database generated by ht://Check
htcheck - Utility for checking web site for dead/external links
linkchecker - check websites and HTML documents for broken links
linklint - A fast link checker and web site maintenance tool

The 2 error link reporting tools I used were:

1. linkchecker

and

2. Htcheck

I’ll evaluate both of the tools and will share with you my impressions of the two really valuable,broken link checking tools for Linux.

Let me begin with a short introduction on what you could expect from the linkchecker broken links (error 404) links.

Here are the linkchecker Featuresrecursive and multithreaded checking
output in colored or normal text, HTML, SQL, CSV, XML or a sitemap graph in different formats
HTTP/1.1, HTTPS, FTP, mailto:, news:, nntp:, Telnet and local file links support
restriction of link checking with regular expression filters for URLs
proxy support
username/password authorization for HTTP and FTP and Telnet
honors robots.txt exclusion protocol
Cookie support
HTML and CSS syntax check
Antivirus check
a command line interface
a GUI client interface
a (Fast)CGI web interface (requires HTTP server)

Luckily linchecker has a Debian package port so installing it comes as easily as executing:

root@noah:~# apt-get install linkchecker linkchecker-gui

However at the present moment on Debian Sid (Testing/Unstable) linkchecker-gui is missing some dependencies with libqt and python
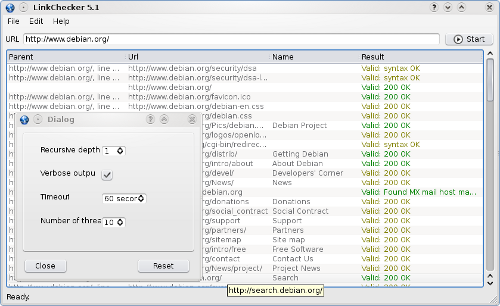
so I was not able to install and test the Graphic User Interface for Linkchecker .Anyways here is a screenshot of the linkchecker GUI interface in order to give you a glipmse on what to expect if you succeed in installing it on Mac OS X or some other operating system.

Linkchecker GUI, Link Checker Graphic User Interface

Using linkchecker’s command line interface is really straight forward you just have too invoke the linkchecker command and pipe it too the tee shell command

Here is how:

root@noah:~# linkcheker https://www.pc-freak.net/ | tee -a www.pc-freak.net-broken-links-linkchecker.log

Though it’s simplicity to use from a first look checking the manual of linkchecker reveals quite many interesting usage parameters, so be sure also to take a look at the manual.
Of course it might be wise to combine linkchecker with some bash scripting in order to pereodically review your website or websites for broken links.

I intend to do that in the coming days so if I write some script that uses linkchecker and facilitates the search for a broken links I’ll post it on the blog.

Having said all that linkchecker goody, let me proceed further to Htcheck

HtCheck is really wondeful and it in a certain sense better than linkchecker, because it offers some extra possibilities like for instance generation of reports which could be stored in MySQL and could be visualized any time via a web browser.

Here is a descrition extracted from HtCheck’s website:

ht://Check is more than a link checker. It is a console application written for Linux systems in C++ and derived from ht://Dig.

It can retrieve information through HTTP/1.1 and store the information in a MySQL database, and it is particularly suitable for
small Internet domains or Intranet.

Its purpose is to help a webmaster manage one or more related sites: after a “crawl”, ht://Check gives back very useful summaries
and reports, including broken links, anchors not found, content-types and HTTP status codes summaries, etc.

From version 1.2.3, ht://Check also performs accessibility checks in accordance with the principles of the University of Toronto’s
Open Accessibility Checks (OAC) project, allowing users to discover site-wide barriers like images without proper alternatives,
missing titles, etc.

ht://Check can also be used for Web structure analysis, as it stores information regarding links between HTML documents.

I have to admit this htcheck-php is really handy! To use the extra php web interface to htcheck you’ll need the htcheck-php package installed.

To install both htcheck and it’s web interface on Debian you’ll need to issue the command:

root@noah:~# apt-get install htcheck htcheck-php

Now there are few more things to do before you could start using htcheck.
You’ll need to edit /etc/htcheck/htcheck.conf

There you will need to change at least the start_url variable.

Another necessery thing will be to use phpmyadmin or the console mysql client in order to create the required htcheck username and password and grant some relevant permissions to the htcheck user in MySQL.

Yet if you try to execute the htcheck binary (which by the way is written in C) to generate you will experience a problem with connecting to mysql’s database and you will most likely get the error message.

noah:/home/hipo# htcheck
Error (1045): Access denied for user 'root'@'localhost' (using password: NO)
! htcheck: Database error

That really pissed me off but anyways you’re lucky that I got it for you.
This whole issue is well documented in htcheck’s installation notes which you can read here

If you’re lazy reading the whole document just skip and read The Htcheck MySQL Connection Settings part

The solutions to the above pointed htcheck problem, where htcheck could not connect to the database is easily solvable, by creating a .my.cnf file in your home directory e.g. ~/ .

Let’s say you’re running with a root user the htcheck, all you need to do is edit /root/.my.cnf and place in it:

[client]
host=127.0.0.1
user=htcheck
password=yoursqlpassword

That’s it now issue again the htcheck command again, so that it could create the proper “htcheck” database (created by default) and store crawl your website for broken links and generate and store the reports in your MySQL server.

root@noah:~# htcheck -i

In the above example the “-i” option passed to htcheck will take care for “htcheck”‘s database to be rebuilt, that’s necessery especially if you made any changes in /etc/htcheck/htcheck.conf after the first time you have invoked on htcheck and you’d like the new configuration changes to reflected in the generated reports in MySQL.

However if you run the htcheck tool for a first time, you can start it without the “-i” flag.

In order to configure htcheck’s web reporting interface to be properly show website crawling statistics you’ll have also to edit /etc/htcheck/global.inc.php and set the username and password variables according to the ones you have previously choose while creating the htcheck’s MySQL username and password.

As a last step before you could use the htcheck’s Web gui interface through your browser is to either configure a virtualhost for htcheck in your Apache configuration or simply make an Apache Alias from your Apache configuration, on Debian, you’ll have to edit /etc/apache2/apache2.conf
Place the following Apache Alias in order to be able to access your htcheck’s statistics from your default configured Apache domain name.

Alias /usr/share/htcheck/php/ /htcheck/

In order to load the new Apache configurations as usual you’ll need an Apache WebServer restart

root@noah:~# /etc/init.d/apache2 restart

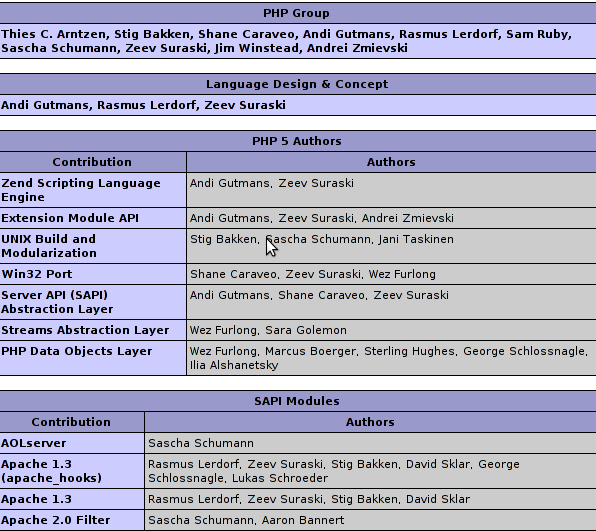
Here you can take a quick look what to expect from Htcheck’s PHP Web Error 404 reporting interface on a Debian GNU/Linux System:

htcheck php graphic user interface, htcheck gui interface

Now Enjoy htcheck neat Error page discover tool and it’s web statistics interface!

Nessus 2.2.10 “scan stops incomplete with remote host is dead message” on Debian Sid / How to resolve the Nessus not scanning issues on Debian Sid(Testing/unstable)

Thursday, April 29th, 2010

I haven’t used my nessus installation which seemed to be hanging around since more than a year.
I have no memory which exactly was the last case I used Nessus in order to conduct some automated generalSecurity testing of Linux and Windows servers. However when I launched the nessus client and logged in to the Nessusd server and attempted to scan a host,I experienced an issue, whether scan was terminated in just about 3 seconds time.
I checked nessusd’s log file /var/log/nessus/nessusd.messages and found messages claiming,some file nessus plugin rules file dependencies were missing. The whole list of the file dependencieswhich caused my nessusd misbehaving you can read in nessusd.messages
In order to check this issues I had to select the tick Enable Dependencies at runtime in my Nessus Plugins tab

This solved the dependencies issues, however the nessus scanner was completing it’s scan in just a few seconds once again.
This time checking the nessus log file doesn’t provided me with any meaningful information on what could be causing Nessusrefusals to scan the node’s security.

A search in Google pointed me to the following forum which suggested a solution to the problems with nessus misbehaves.

The solution is really simple, somehow the whole scanning issues are caused by two Ticks in Nessus client program interface:
To solve the issues go to Nessus Client in Prefs. tab and uncheck the Do a TCP ping and Do an ICMP ping that will solve the issue for you.

Anyways before I can proceed to that firstIt was necessery for me to add a new user to it and start the nessus service.
Here is how I achieved that:

root@noah:~# nessus-adduser Now you will have to answer to a few questions:

Add a new nessusd user
----------------------

Login : baklava
Authentication (pass/cert) [pass] :
Login password :
Login password (again) :

User rules
———-nessusd has a rules system which allows you to restrict the hosts
that baklava has the right to test. For instance, you may want
him to be able to scan his own host only.

Please see the nessus-adduser(8) man page for the rules syntax
.
Enter the rules for this user, and hit ctrl-D once you are done :
(the user can have an empty rules set)

Login : baklava
Password : ***********
DN :
Rules :

Is that ok ? (y/n) [y]

All you need to fill from the above fill in fields is is the Login and Login Password
After you have filled that you have to press ctrl-D as the text instructs you.
On the “Is that ok field” just answer y and continue to bringing up the Nessus Network server.
Before you bring up the nessus daemon listening for connections from the nessus client, you’ll have to provide the serverwith a well configured nessusd.conf
I decided to share with you my nessusd.conf file in order to make your file a bit easier on that.
Download the copy of nessusd.conf here and place it in:
/etc/nessusd/ directory on your Linux system.
root@noah:~# /etc/init.d/nessusd start

Now I simply launched the nessus client program and started the scan. Thanksfully now Nessus worked like a charm ! 🙂

Opening DICOM File Format images in Debian Testing/Unstable with MRICRON

Thursday, April 29th, 2010

RMI scan of hip0 brain

Digital Imaging and Communications in Medicine is a well established standard for handling storing, printing and transmitting information in medical imaging.
I’ve recently been through a RMI Scan

The image in the beginning of the blog post is actually the RMI scan of my brain :)!

The Doctors which took participation in the Magnetic Resonance Examination gave me a whole CD with pictures of my brain in the DICOM file format. Though the CD I was provided with included a Windows version of a program called Dicom Viewer I didn’t have a way to open the DICOM file format on my Debian Linux

A quick research in Google indicated that happily the DICOM file format is able to be opened also in GNU/Linux

There are few options if you’d like to open the file format on Linux.

The easiest one seemed through the KDE’s Kradview DICOM opening application. Kradview is quite simple, it is created for just one purpose opening DICOM file format on Linux, nothing more or less. So don’t expect too much!
Kradview didn’t have a precompiled package for the Debian Linux distrubution, that’s why if you indend to use this software on Debian Linux you’ll have to compile it from source as explained on Kradview’s website Install instructions

I am naturally a Gnome user and therefore Kradview was not something that fits my Gnome taste. Trying to compile it on my gnome ended with the nasty compile time error:

checking for Qt... configure: error: Qt (>= Qt 3.0) (headers and libraries) not found. Please check your installation!For more details about this problem, look at the end of config.log. Definitely not cool, thefore I was forced to look for some alternatives to Kradview which will either be easily compiled and installed from source on Debian or even better will be prepackaged in the debian’s deb file format.

A quick search led me to the Debian’s Neuro Science Repository!

Debian Neuro Science Repository Logo

Truly I never suspected Debian is SO BIG! This guys even have a separate repository for neuro science, that’s wild seriously!

Quick look through Debia’s neuro science repository led me to a nifty software called MRICron

Mricron Logo

MRICron is a package which includes few gui based executables which are capable of:
magnetic resonance image conversion, viewing and analysis quite cool!
There was even a package for sid which good suited me since my Desktop is running on top of Debian Testing Unstable.

I used the Following repository link to download the Debian Sid testing/unstable MRICron package

I’m running a 64 bit debian (amd64) therefore I needed to download and install the 64 bit release of MRICron.
Here is how I did it:

hipo@noah:~# wget http://neuro.debian.net/debian/pool/main/m/mricron/mricron-data_0.20100422.1~dfsg.1-1~sid.nd1_all.deb
hipo@noah:~# wget http://neuro.debian.net/debian/pool/main/m/mricron/mricron_0.20100422.1~dfsg.1-1~sid.nd1_amd64.deb

Then I used Debian’s dpkg to install the packages, as you can see down:

hipo@noah:~# dpkg -i mricron-data_0.20100422.1~dfsg.1-1~sid.nd1_all.deb
hipo@noah:~# dpkg -i mricron_0.20100422.1~dfsg.1-1~sid.nd1_amd64.deb

I was lucky that I had all the dependcy packages required by mricron-data and the mricron debian sid packages. And the two ones installed “in a blink of an eye without no further issues”.

As I already had the mricron installed I had to invoke from command line the:

hipo@noah:~# /usr/bin/dcm2niigui

I used the dcm2niigui selecting the DICOM medical imaging data files to convert them to the Nifty file format (*.nii)

Next I used the hipoa@noah:~# /usr/bin/mricron

to open the converted DICOM format files to the Nifty Format.I won’t sink into details about how to use the two forementioned problems since their user interface is quite self-explanatory.
The results from the RMI scan examinations prooved my fears that I could be suffering a severe brian damage completely groundless.

Praise the Lord for that!
In another post I’ll sink into details on what kind of thought tortures I’ve been through before the RMI examination showed I don’t have problems with my brian.
Here is one more wondeful looking picture from above taken by the RMI machine during the RMI examinations.
RMI hip0 Brain from Above

I’m really happy that Linux is developing day by day and that I could see the DICOM pictures of my brain even on a free software platform as Linux is!

How to resolve network issues with Java 6 JRE on Debian / Java proxy spawn on Debian sid not working by default – A Small tip on running WebScarab and Paros local Proxy on Debian’s Java

Wednesday, April 28th, 2010

In an attempt to use Paros Proxy and WebScarab on Debian I faced a shitty issues with Java’s Networking.

Neither of the forementioned Security Applications’s Local Proxy to be spawned by the Java server won’t work.

I assured my self there is nothing running on the ports 8080 on which the two Java applications attempted to run their local proxy server.
Being sure that nothing is listening on the 8080 port. I suspected that there is something wrong with Debian’s Java networking.
A quick search in Google pointed me to the Debian.Net’s forums where the issue was described as serious proxy error after updates .

The error that was returned by the ParosProxy Server on my Desktop Debian can be reviewed below:

hipo@noah:~/paros$ /usr/lib/jvm/java-6-sun-1.6.0.17/jre/bin/java -jar paros.jar
file:/home/hipo/paros/paros.jar
java.net.SocketException: Invalid argument
at java.net.PlainSocketImpl.socketBind(Native Method)
at java.net.PlainSocketImpl.bind(PlainSocketImpl.java:365)
at java.net.ServerSocket.bind(ServerSocket.java:319)
at java.net.ServerSocket.<init>(ServerSocket.java:185)
at org.parosproxy.paros.core.proxy.ProxyServer.createServerSocket(Unknown Source)
at org.parosproxy.paros.core.proxy.ProxyServer.startServer(Unknown Source)
at org.parosproxy.paros.control.Proxy.startServer(Unknown Source)
at org.parosproxy.paros.control.Control.init(Unknown Source)
at org.parosproxy.paros.control.Control.<init>(Unknown Source)
at org.parosproxy.paros.control.Control.initSingletonWithView(Unknown Source)
at org.parosproxy.paros.Paros.runGUI(Unknown Source)
at org.parosproxy.paros.Paros.run(Unknown Source)
at org.parosproxy.paros.Paros.main(Unknown Source)

All a man can grasp from the Error is that there is something wrong with running the Paros Proxy server.
So far so good since the last release of Paros Proxy originates back to the year 2006 and it’s not really supported this days at first I thought this could be causing the error.
By the way the paros proxy is available via the debian packaging system. So I use the packaged version of paros to install the Debian packaged version of Paros Proxy issue the cmd:

root@noah:~# apt-get install paros

In that manner of thoughts I decided to try out the newer more modern HTTP and HTTPS Security Analysing Application WebScarab

I followed the start up instructions on WebScarab’s Website in order to run the application.
It was really simple. All I had to do is download the webscarab-current.zip which of the time of writting this post is webscarab-20100414-0036 and then launch the Java Debian Virtual machine.

However though my hopes that WebScarab’s local Proxy server will be running fine I was unpleasently suprised by the error which shown below:

hipo@noah:~/webscarab-20100414-0036$ java -jar webscarab.jar
Help set not found
11:43:36 main(Proxy.parseListenerConfig): No proxies configured!?
11:43:39 Proxy(Proxy.run): Unable to start listener 127.0.0.1:8008

Ain’t pretty heh?! … Even nasty !

However I was lucky to find the solution in some 20 minutes, so hopefully it took you less to find this post.

The solution to the above Proxy Spawn Error with Paros and Webscarab on Debian Lenny’s Java 6 Sun Server is really simple and it comes to this:

1. edit /etc/sysctl.d/bindv6only.conf and change the value

net.ipv6.bindv6only = 1
# to
net.ipv6.bindv6only = 0

2. Restart procps

root@noah:/home/hipo/webscarab-20100414-0036# invoke-rc.d procps restart

Now launch once again either Paros Proxy or Webscarab, the Local Proxy Server by each of them will bind to either port 8008 (WebScarab) or port 8008 (Paros Proxy).

Protecting Debian Lenny against Slowloris Denial of Service attack with mod_antiloris

Wednesday, April 28th, 2010

I’ve written in my previous posts some possible ways to protect against slowloris on Debian with the mod_qos module.
For more on mod_qos see here

This solution to the denial of service attack against which probably at least 40 percents of the Apache webservers online are still vulnerable is not really applicable on 64 bit Debian GNU Linux.
I installed the mod-qos on a Debian Linux running an amd64 bit kernel and used the Apache server with this module for just a few days on a newly configured productive Linux server running mostly some PHP applications based on top of Zend Framework .
At first all looked fine, the mod-qos was up and running and defending the Apache Webserver from the nasty slowloris DoS attack, however at a certain point.
The PHP application developers reported that Apache is crashing while executing some of the PHP codes developed by the programmers team.
After quick examination of the Apache error logs I realized the Apache crashes are caused by misbehaving behavior of the mod-qos module.

Realizing that mod_qos is creating the Apache segfaults on the amd64 architecture I abandoned the idea of using it and after a some time spend in researching what can I use as a substitute to protect against the Slowloris DoS attack I found the mod_antiloris.
Mod_antiloris is a tiny Apache module dedicated only as a work around (fix) for Apache against the Slowloris denial of service.

Though the package is officially included as a package for Debian Sid and is in the testing/unstable Debian repositories.
It’s still not available via official Debian repositories in Lenny, neither through Debian Lenny backports.

Therefore the only way to install this In my humble view compulsory module to guarantee some security against modern Denial of Service Attacks, you will need to compile the module from source.
So here is how to install the mod_antiloris module on Debian Lenny via source:

1. Download and untar (unarchive) the mod_antiloris

debian-server:~# wget ftp://ftp.monshouwer.eu/pub/linux/mod_antiloris/mod_antiloris-0.4.tar.bz2
debian-server:~# tar -jxvvf mod_antiloris-0.4.tar.bz2
debian-server:~# cd mod_antiloris-0.4/

2. Install necessery header files and Apache development programs necessery for the compilation of mod_antiloris

debian-server:~# apt-get install gcc apache2-threaded-dev

3. Compile the mod_antiloris module

debian-server:~# /usr/bin/apxs2 -i -c mod_antiloris.c

4. Create necessery configuration files and Enable the mod_antiloris module in Apache

debian-server:~# echo "LoadModule antiloris_module /usr/lib/apache2/modules/mod_antiloris.so" > /etc/apache2/mods-available/antiloris.load
debian-server:~# a2enmod antiloris
Enabling module antiloris.
Run '/etc/init.d/apache2 restart' to activate new configuration!

5. Restart the Apache WebServer

debian-server~:~# /etc/init.d/apache2 restart

6. Use the slowloris.pl Denial of Service tool to ensure yourself Apache is Secured by mod_antiloris and no longer vulnerable to the slowloris attack

debian-server:~# perl slowloris.pl -dns yourdomainname.com -port 80 -timeout 1 -num 200 -cache

Open an SSH connection to some free shell with a a text browser lynx or links or some other Linux system you have access to or use some proxy to test if your WebServer is responding while the above attack is taking action.
In case if after the test your webserver opens normally your hosted webpages then congrats you’re secure!
You can sleep well at night with less worries about Denial of Service attacks 🙂

Tightening PHP Security on Apache 2.2 with ModSecurity2 on Debian Lenny Linux

Monday, April 26th, 2010

Tightening-PHP-Security-on-Apache-2.2-2.4-with-Apache-ModSecurity2
In this article you'll learn how I easily installed and configured the ModSecurity 2 on a Debian Lenny system.
First let me give you a few introductionary words to modsecurity, what is it and why it's a good idea to install and use it on your Apache Webserver.

ModSecurity is an Apache module that provides intrusion detection and prevention for web applications. It aims at shielding web applications from known and unknown attacks, such as SQL injection attacks, cross-site scripting, path traversal attacks, etc.

As you can see from ModSecurity’s description it’s a priceless module add on to Apache that is able to protect your PHP Applications and Apache server from a huge number of hacker attacks undertook against your Online Web Application or Webserver.
The only thing I don’t like about this module is that it is actually a 3rd party module (e.g. not officially part of Apache). Some time ago I remember there was even an exploit for one of the versions of the module.
So in some cases the ModSecurity could also pose a security risk, so beware!
However if you know what you'rre doing and you keep a regular track of security news on some major security websites, that shouldn’t be a concern for you.
Now let'ss proceed to the install of the ModSecurity module itself.
The install is a piece of cake on Debian though you'll be required to use the Debian Lenny backports

Here is the install of the module step by step:

1. First add the gpg key of the backports repository to your install

debian-server:~# gpg --keyserver pgp.mit.edu --recv-keys C514AF8E4BA401C3
# another possible way to add the repository as the website describes is through the command
debian-server:~# wget -O - http://backports.org/debian/archive.key | apt-key add -

2. Install the libapache-mod-security package from the backports Debian Lenny repository

debian-server~:~# apt-get -t lenny-backports install libapache2-mod-security2

Now as a last step of the install ModSeccurity install procedure you have to add some configuration directives to Apache and restart the server afterwards.

– Open your /etc/apache2/apache2.conf and place in it the following configurations


<IfModule mod_security2.c>
# Basic configuration options
SecRuleEngine On
SecRequestBodyAccess On
SecResponseBodyAccess Off

# Handling of file uploads
# TODO Choose a folder private to Apache.
# SecUploadDir /opt/apache-frontend/tmp/
SecUploadKeepFiles Off

# Debug log
SecDebugLog /var/log/apache2/modsec_debug.log
SecDebugLogLevel 0

# Serial audit log
SecAuditEngine RelevantOnly
SecAuditLogRelevantStatus ^5
SecAuditLogParts ABIFHZ
SecAuditLogType Serial
SecAuditLog /var/log/apache2/modsec_audit.log

# Maximum request body size we will
# accept for buffering
SecRequestBodyLimit 131072

# Store up to 128 KB in memory SecRequestBodyInMemoryLimit 131072
# Buffer response bodies of up to # 512 KB in length SecResponseBodyLimit 524288
</IfModule>

The ModSecurity2 module would be properly installed and configured as an Apache module.
3.All left is to restart Apache in order the new module and configurations to take effect.

debian-server:~# /etc/init.d/apache restart

Don’t forget to check the apache conf file for errors before restarting the Apache with the above command for that to happen issue the command:
debian-server:~# apache2ctl -t

If all is fine you should get as an output:

Syntax OK

4. Next to find out if the Apache ModSecurity2 module is enabled and already used by Apache as a mean of protection you,
you might want to check if the log files modsec_audit.log and modsec_debug.log files has grown and doesfeed a new content.
If they’re growing and you see messages concerning the operation of the ModSecurity2 Apache module that’s a sure sign all is fine.
5. As we have the Mod Security Apache module configured on our Debian Server, now we will need to apply some ModSecurity Core Rules .
In short ModSecurity Core Rules are some critical protection rules against attacks across almost every web architecture.
Another really neat thing about Core Rules (CRS) for ModSecurity is that they are written with a performance in mind.
So enabling this filter rules won’t be a too heavy load for your Apache server.

Here is how to install the core rules:

6. Download latest ModSecurity Code Rules

Download them from the following Code Rule url
At the time of writting this article the latest code rules are version modsecurity-crs_2.0.6.tar.gz

To download and install this rules issue some commands like:

debian-server:~# wget http://sourceforge.net/projects/mod-security/files/modsecurity-crs/0-CURRENT/modsecurity-crs_2.0.6.tar.gz/download
debian-server:~# cp -rpf ~/modsecurity-crs_2.0.6.tar.gz /etc/apache2/
debian-server:~# cd /etc/apache2/; tar -zxvvf modsecurity-crs_2.0.6.tar.gz

Besides physically storing the unarchived modsecirity-crs in your /etc/apache2 it’s also necessery to add to your Apache Ifmodule mod_security.c block of code the following two lines:

Include /etc/apache2/modsecurity-crs_2.0.6/*.conf
Include /etc/apache2/modsecurity-crs_2.0.6/base_rules/*.conf

Thus ultimately the configuration concerning ModSecurity in your Apache Server configuration should look like the following:

<IfModule mod_security2.c>
# Basic configuration options
SecRuleEngine On
SecRequestBodyAccess On
SecResponseBodyAccess Off

# Handling of file uploads
# TODO Choose a folder private to Apache.
# SecUploadDir /opt/apache-frontend/tmp/
SecUploadKeepFiles Off

# Debug log
SecDebugLog /var/log/apache2/modsec_debug.log
SecDebugLogLevel 0

# Serial audit log
SecAuditEngine RelevantOnly
SecAuditLogRelevantStatus ^5
SecAuditLogParts ABIFHZ
SecAuditLogType Serial
SecAuditLog /var/log/apache2/modsec_audit.log

# Maximum request body size we will
# accept for buffering
SecRequestBodyLimit 131072

# Store up to 128 KB in memory
SecRequestBodyInMemoryLimit 131072

# Buffer response bodies of up to
# 512 KB in length
SecResponseBodyLimit 524288
Include /etc/apache2/modsecurity-crs_2.0.6/*.conf
Include /etc/apache2/modsecurity-crs_2.0.6/base_rules/*.conf
</Ifmodule>

Once again you have to check if everything is fine with Apache configurations with:

debian-server:~# apache2ctl -t

If it’s showing once again an OK status. Then you’re ready to restart the Webserver.
debian-server:~# /etc/init.d/apache2 restart

One example goodness of setting up the ModSecurity + the Core rule sets are that after the above described installationis fully functional.

ModSecurity will be able to track if somebody tries to execute PHP Shell on your server .
ModSecurity will catch, log and block (forbid) requests to r99.txt, r59, safe0ver and possibly other hacked modifications of the php shell script

That’s it! Now Enjoy your tightened Apache Security and Hopefully catch the script kiddie trying to h4x0r yoU 🙂

Using PHP Spike Security Audit Tool on large source trees / Fixing issues with PHP Spike Security Audit (Fatal Error: Allowed memory size exhausted)

Sunday, April 25th, 2010

Whilst Running the PHP Spike Security Audit Tool to audit a php source files directory containing large number of PHP files,like let’s say 700+ php files produces the following error: Fatal error: Allowed memory size of 67108864 bytes exhausted (tried to allocate 71 bytes) in /usr/local/spike_phpSecAudit_0.27/util/TokenUtils.php on line 85

It’s obvious that php spike is written in a way that all audited php files are stored in memory before being processed.
Therefore the larger amount of php source code targeted to be audited by the Spike Security PHP Audit tool the highter the amount of necessery memory by the spike security audit php script.

For that reason it’s necessery to increase the allowed amount of memory that the php CLI (Command Line Interface) can consume.

The default value for memory limit on the PHP5 precompiled binary on Debian Lenny is 16 MB. This value is really low and needs to be increased in order to be able to run the spike PHP Sec Audit on directories with many php scripts.

There are basicly two ways to achieve that:

1. Edit /etc/php5/apache2/php.ini on Debian Linux

And Increase the value:

memory_limit = 200M

Increasing the memory_limit from the php.ini configuration is not really wise since that will lessen your security. So use this only if you know what you’re doing.

2. Or the other possibility to get around the error message is increase the memory_limit value via the PHP Spike Source Security Audit script

That is by the way, the better choise IMHO. If you go that way edit your run.php script bunled with the spike_phpSecAudit archive and there make sure you insert on the second line:

ini_set('memory_limit', '200M');

Generating Static Source Code Auditing reports with Spike PHP Security Audit Tool

Saturday, April 24th, 2010

I’m conducting a PHP Audit on a server in relation to that one of the audit criterias I follow is a
Static PHP Source Code Auditing of the php files source code located physically on the Linux server.
Auditing a tons of source code manually is a kind of impossible task, therefore I needed a quick way to at least
partly automate or fully automate the PHP applications source code.
A quick search in Google pointed me to a php application tool – Spike Security Audit .
This small application PHP written app is quite handy. It is able to either check a certain php source code file for WARNINGS or ERRORS or do a complete security source code analysis of a bunch of PHP files in a directory including all the other php source files in subdirectories.

After executed the PHP Security Audit Tool generates a nice source code analysis report in html that can easily be later observed with some Browser.

The use of the tool is pretty straight forward, all you have to do is download it from Spikeforge – the project’s official webpage and unzip it e.g.


debian-server:~# wget http://developer.spikesource.com/frs/download.php/136/spike_phpSecAudit_0.27.zip
debian-server:~# unzip spike_phpSecAudit_0.27.zip

Then you have to invoke the run.php with the php cli, that you need to have installed first.
If you don’t have the php cli yet please install it with the command:


debian-server:~# apt-get install php5-cli

Now you have to execute the run.php script bundled with the spike php security audit program source code.


debian-server:~# php run.php

Please specify a source directory/file using –src option.

Usage run.php options

Options:
–src Root of the source directory tree or a file.
–exclude [Optional] A directory or file that needs to be excluded.
–format [Optional] Output format (html/text). Defaults to ‘html’.
–outdir [Optional] Report Directory. Defaults to ‘./style-report’.
–help Display this usage information.

As you can see the spike php security audit has only few command line options and they’re quite easily understandable.
However in my case I had to audit a couple of directories which contained source code.
I also wanted the generated reports to be cyclic, on let’s say per daily basis cause I wanted to have the PHP applicaiton analysis generated on a daily basis.
In that reason I decided to write a small shell script that would aid the usage of php spike audit, I’ve called the script code-analysis.sh

The usage of the Automation source code analysis script for PHP Spike Audit can be downloaded here
The script has a few configuration options that you might need to modify before you can put it to execute on a crontab.

This are:


# Specify your domain name on which php spike audit reports will be accessed
domain_name='yourdomainname.com';
# put here the location where phpspike run.php execute is located
spike_phpsec=/usr/local/spike_phpSecAudit_0.27/run.php;
# specify here which will be the directory where the php source code analysis reports will be stored by php spike
log_dir=/root/code-analysis/;
# in that part you have to specify the physical location of the php cli it's located by default in /usr/bin/php on Debian GNU Linux.
php_bin=/usr/bin/php;
# the directory below should be set to a directory where the reports that will be visible from the webserver will be stored
www_dir=/var/www/code-analysis;

# in the variables

directory[1]=’/home/source-code1/’; ..
directory[2]=”; ..

# you should configure the directories containing php source code to be audited by the php spike audit tool.

After you have prepared the code-analysis.sh script with your custom likings, you can now put it to be executed periodically
using crontab or some other unix system scheduler of choice.

To do that edit your root crontab.

crontab -u root -e

and put in it.

# code analysis results
05 3 * * * /usr/local/bin/code-analysis.sh >/dev/null 2>&1

Now hopefully you can edit your /etc/apache2/apache2.conf or your httpd.conf depending on your linux or unix architecture and make a Alias like:


Alias /code-analysis "/var/www/code-analysis"

Now your php source code analysis from the php spike audit tool will be generated daily.
You will be able to access them via web using http://yourdomain.com/code-analysis/

That way, you can review your php source code written or changed in your php applications on daily basis and you can a way easily track your coding mistakes, as well as track for possible security issues in your code.

For the sake of security I’ve also decided to protect the /code-analysis Apache directory with a password using the following .htaccess file:


AuthUserFile /var/www/code-analysis/.htpasswd
AuthGroupFile /dev/null
AuthName "Login to access PHP Source Code Analysis"
AuthType Basic

< Limit GET >
require valid-user
< /Limit >

If you decide to protect yours as well you have to also generate the .htpasswd file using the following command:


debian-server:~# htpasswd -c /var/www/code-analysis/.htpasswd admin

You will be asked for a password. The code-analysis.sh script will also take care to generate an html file for you including links to reports to all the php source code audited directories reports.

Now accessing http://yourdomain.com/code-analysis/ will give you shiny look to the php source applications generated reports .

Disable PHP Expose / Disable PHP Credits page showing up with including some.php?=PHPB8B5F2A0-3C92-11d3-A3A9-4C7B08C10000 variable to a PHP powered WebServer

Friday, April 23rd, 2010

Many people are not aware that by default PHP 5 has enabled variable in the php.ini file which allows a third party person to query PHP for a few hard coded variables which displays various infos on PHP.
Some of the infos displayed are:
PHP Credits

To see that request in your browser to a PHP powered webserver.

http://domainname.com/some.php?=PHPB8B5F2A0-3C92-11d3-A3A9-4C7B08C10000

PHP Credits Reveal

This would reveal you the PHP version number + the PHP authors who took active part in the development of the current PHP release.
That could be even counted as a non-critical security flaw since it reveals PHP version and many companies nowadays prefers that the technology backing up their websites stays private.

Some other hard coded variables that can be requested to a PHP enabled server are:

http://domainname.com/some.php?=PHPE9568F34-D428-11d2-A769-00AA001ACF42 This will show you that the Apache Server or the questionable Server is configured to server PHP pages.

PHP Logo Reveal

http://domainname.com/some.php?=PHPE9568F35-D428-11d2-A769-00AA001ACF42 PHP with Zend Reveal

This simple method could be another security threat if you’re a security freak. It will reveal your Webserver is running PHP with Zend2 Framework extension enabled.

http://domainname.com/some.php?=PHPE9568F36-D428-11d2-A769-00AA001ACF42 Reveal Jagged PHP Logo

This last one reveals again the PHP logo a bit jagged.
Be aware that this 4 are enabled by default in php.ini on PHP version 5.x.
Therefore from a security standpoint as well as to show off your professionalism you can disable it simply by editing your php.ini and changing the variable expose_php = Off .To do that quickly on Debian running Apache 2.2.x from the command line issue the commands:

debian-server:~# sed -e "s#expose_php = On#expose_php = Off#g" /etc/php5/apache2/php.ini > /etc/php5/apache2/php.ini.1;
debian-server:~# mv /etc/php5/apache2/php.ini.1 /etc/php5/apache2/php.ini

That’s it now the annoying information concerning PHP Credits, PHP Logos, and PHP Zend Framework Logos won’t be exposed any more for pranksters.

Historically speaking in PHP version 4. There were are 3 really funny pictures hard coded into the PHP library. If you’re running PHP and you want to check them out you have to do a request to your server like the one below:

http://domainname.com/?=PHPE9568F36-D428-11d2-A769-00AA001ACF42

The following funny pictures should appear right away 🙂
php rabbit exposedphp developer dude exposedsome php developed terrier dogsome php developer's black dog, nothing to do with Led Zeppelin

Now take some time and test the hidden requests on your PHP powered servers 🙂

Disable Apache HTTP TRACE method to improve Apache security

Thursday, April 22nd, 2010

I’m doing a security web audit on a server. To get more accurate data about the current Linux powered serversecurity Level.
I’m intending to combine both automated scannings with softwares like Paros Proxy , Nessus , nmap as well as some more modern day web server scanners like:
Nikto . By the last mentioned Nikto is not something brand new, but it’s partly based on a on older web sever scanner called Whisker which nowadays is a depreceated piece of software though for it’s time it was a real buzz.

Anyways the audit I’m into is not the major topic of this post.
During some of the scans with the softwares forementioned I was warned by the security scanners that the HTTP TRACE on the webserver is enabled and this could possibly pose a security threat.
At first I had absolutely no idea what is HTTP TRACE and after some reading online I got it. It’s really simple and let me save you some time in Googling in researching.
What HTTP TRACE is is simply an integrated ECHO like service in the Apache server.
The Nikto web security scanner has identified that the Apache server I was auditing has an enabled HTTP TRACE method and warned that this could pose a security risk on the server.
At first I thought nikto is wrong and it’s reporting a false positive. However after checking out my Apache for HTTP TRACE method I realized the security scanner is right.

I wondered how such a tiny thing as HTTP TRACE could introduce a security threat and after reconsidering the issue I understood that having it enabled on the Webserver could be beneficial for an attacker if he tries to exercise Denial of Service or Distributed Denial of Service on the Apache Webserver.

So having that in mind I should confess the security scanners are right to point the HTTP TRACE as a possible security leak.

Here is an example on how to check your webserver if HTTP TRACE is enabled.

debian-server:~# telnet 127.0.0.1 80
Trying 127.0.0.1...
Connected to 127.0.0.1.
Escape character is '^]'.
TRACE / HTTP/1.1
Host: 127.0.0.1
Here Press ENTER twice!

HTTP/1.1 200 OK
Date: Thu, 22 Apr 2010 10:36:58 GMT
Server: Apache
Connection: close
Content-Type: message/http

TRACE / HTTP/1.0
Host: 127.0.0.1

Connection closed by foreign host.

If after the check you receive some HTTP TRACE output which is like the one above, then positively HTTP TRACE is enabled on your Apache and for security reasons it’s best to disable it.

There are two ways to do that:

1. You can either use a mod rewrite rule like the following and put it in your httpd.conf,apache2.conf (on Debian) or as an .htaccess file rules:

RewriteEngine On
RewriteCond %{REQUEST_METHOD} ^TRACE
RewriteRule .* - [F]

However note that this method is a real performance killer since, each and every request to the server will pass through the mod rewrite rule chain.

2. Or use the TraceEnable off Apache directive which is available on Apache 1.3.34 and on All Apache Servers versions 2.0.55 or higher.
The TraceEnable off Apache directive is also working on Apache 2.2.x including the current stable Debian Apache (2.2.9-10+lenny7).
Take in mind that in my case as I disired to disable the HTTP TRACE on a Debian server putting TraceEnable Off in /etc/apache2/apache2.conf didn’t disabled the HTTP TRACE for the Apache server.

To be able to disable it I had to edit my /etc/apache2/sites-enabled/000-default and put the TraceEnable Off variable in it.

If you want to make sure Apache HTTP TRACE method after using one of the forementioned methods for disabling it.
You should once again execute:

debian-server:~# telnet cadia 80Trying 127.0.0.1...
Connected to cadia.
Escape character is '^]'.
TRACE / HTTP/1.1
Host: 127.0.0.1
Press Enter Twice!

You should then receive a responce from Apache like:

HTTP/1.1 405 Method Not Allowed
Date: Thu, 22 Apr 2010 10:52:09 GMT
Server: Apache
Allow:
Vary: Accept-Encoding
Content-Length: 223
Content-Type: text/html; charset=iso-8859-1

Method Not Allowed

The requested method TRACE is not allowed for the URL

That’s all, now your Apache should be a bit more secure than before!