If you have to administrate a heterogenous network with Linux and FreeBSD or other UNIX like OSes you should sooner or later need for scripting purposes to have a way to list how much memory separate users take up on your system. Listing memory usage per user is very helpful for admins who manager free-shells or for companies where you have developers, developing software directly on the server via ssh. Being able to check which process eats up most memory is essential for every UNIX / Linux sysadmin, because often we as admins setup (daemons) on servers and we forgot about their existence, just to remember they exist 2 years later and see the server is crashing because of memory exhaustion. Tracking server bottlenecks where RAM memory and Swapping is the bottleneck is among the main swiss amry knives of admins. Checking which user occupies all server memory is among the routine tasks we're forced to do as admins, but because nowdays servers have a lot of memory and we put on servers often much more memory than ever will be used many admins forget to routinely track users / daemons memory consumption or even many probably doesn't know how. Probably all are aware of the easiest wy to get list of all users memory in console non interactively with free command, e.g.:
free -m
total used free shared buffers cached
Mem: 32236 26226 6010 0 983 8430
-/+ buffers/cache: 16812 15424
Swap: 62959 234 62725
but unfortunately free command only shows overall situation with memory and doesn't divide memory usage by user
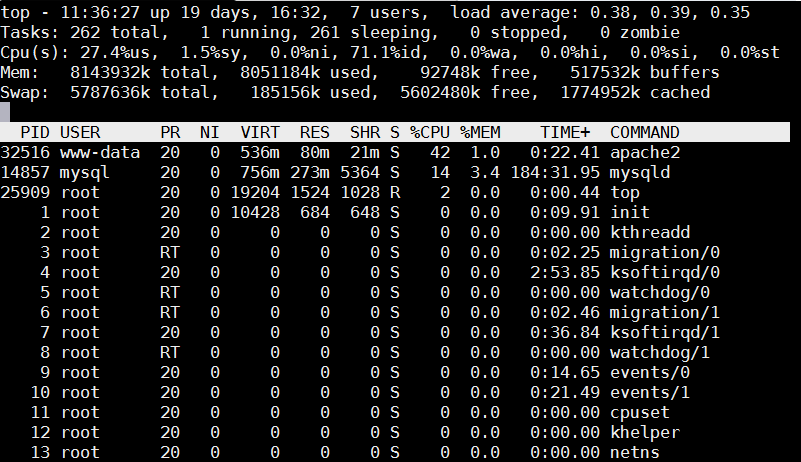
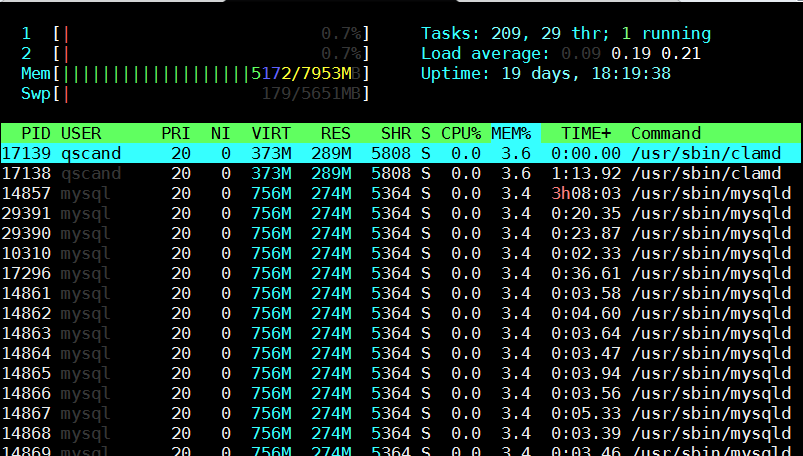
Thus probably to track memory users the only known way for most pepole is to (interactively) use good old top command or if you like modern (colorful) visualization with htop:
debian:~# top

Once top runs interactive press 'm' to get ordered list of processes which occupy most system memory on Linux server.Top process use status statistics will refresh by default every '3.0' seconds to change that behavior to '1' second press s and type '1.0'. To get Sort by Memory Use in htop also press 'm'
[root@mail-server ~]# htop

However if you need to be involved in scripting and setting as a cron job tasks to be performed in case if high memroy consumption by a service you will need to use few lines of code. Below are few examples on how Linux user memory usage can be shown with ps cmd.
Probably the most universal way to see memory usage by users on Debian / Ubuntu / CentOS / RHEL and BSDs (FreeBSD / NetBSD) is with below one liner:
server:~# ps hax -o rss,user | awk '{a[$2]+=$1;}END{for(i in a)print i” “int(a[i]/1024+0.5);}' | sort -rnk2
daemon 0
debian-tor 63
dnscache 1
dnslog 0
hipo 21
messagebus 1
mysql 268
ntp 2
privoxy 1
proftpd 1
qmaill 0
qmailq 0
qmailr 0
qmails 0
qscand 291
root 94
shellinabox 1
snmp 1
statd 1
vpopmail 80
www-data 6765
Output is in MBs
Below is output from machine where this blog is running, the system runs ( Apache + PHP + MySQL Webserver + Qmail Mail server and Tor) on Debian GNU / Linux.
To get more human readable (but obscure to type – useful for scripting) output list of which user takes how much memory use on deb / rpm etc. based Linux :
server:~# echo "USER RSS PROCS" ; echo "——————– ——– —–" ;
ps hax -o rss,user | awk '{rss[$2]+=$1;procs[$2]+=1;}END{for(user in rss) printf “%-20s %8.0f %5.0fn”, user, rss[user]/1024, procs[user];}' | sort -rnk2
USER RSS PROCS
——————– ——– —–
www-data 6918 100
qscand 291 2
mysql 273 1
root 95 120
vpopmail 81 4
debian-tor 63 1
hipo 21 15
ntp 2 1
statd 1 1
snmp 1 1
shellinabox 1 2
proftpd 1 1
privoxy 1 1
messagebus 1 1
dnscache 1 1
qmails 0 2
qmailr 0 1
qmailq 0 2
qmaill 0 4
dnslog 0 1
daemon 0 2
It is possible to get the list of memory usage listed in percentage proportion, with a tiny for bash loop and some awk + process list command
TOTAL=$(free | awk '/Mem:/ { print $2 }')
for USER in $(ps haux | awk '{print $1}' | sort -u)
do
ps hux -U $USER | awk -v user=$USER -v total=$TOTAL '{ sum += $6 } END { printf "%s %.2fn", user, sum / total * 100; }'
done107 1.34
115 2.10
119 1.34
daemon 1.32
dnscache 1.34
dnslog 1.32
hipo 1.59
mysql 4.79
ntp 1.34
privoxy 1.33
proftpd 1.32
qmaill 1.33
qmailq 1.33
qmailr 1.32
qmails 1.33
qscand 4.98
root 1.33
snmp 1.33
statd 1.33
vpopmail 2.35
www-data 86.48
Also a raw script which can be easily extended to give you some custom information on memory use by user list_memory_use_by_user.sh is here.
You can also want to debug further how much memory a certain users (lets say user mysql and my username hipo) is allocating, this can easily be achieved ps like so:
root@pcfreak:~# ps -o size,pid,user,command -u mysql –sort -size
SIZE PID USER COMMAND
796924 14857 mysql /usr/sbin/mysqld –basedir=/usr –datadir=/var/lib/mysql –plugin-dir=/usr/lib/mysql/plugin –user=mysql –pid-file=/var/run/mysqld/mysqld.pid –socket=/var/run/mysqld/mysqld.sock –port=3306
root@pcfreak~# ps -o size,pid,user,command -u hipo –sort -size|less
SIZE PID USER COMMAND
13408 19063 hipo irssi
3168 19020 hipo SCREEN
2940 2490 hipo -bash
1844 19021 hipo /bin/bash
1844 19028 hipo /bin/bash
1844 19035 hipo /bin/bash
1844 19042 hipo /bin/bash
1844 19491 hipo /bin/bash
1844 22952 hipo /bin/bash
744 2487 hipo sshd: hipo@pts/0
744 2516 hipo sshd: hipo@notty
524 2519 hipo screen -r
412 2518 hipo /usr/lib/openssh/sftp-server
You see from below output user running with www-data (this is Apache Webserver user in Debian) is eating 86.48% of overall system memory and MySQL server user is using only 4.79% of available memory
Output is shown in Megabytes per username memory usage, and user memory usage is ordered (stepping-down / descentive) from top to bottom
Getting more thoroughful and easier to read reporting without beeing a 31337 bash coder you can install and use on Linux smem – memory reporting tool .
SMEM can provide you with following memory info:
- system overview listing
- listings by process, mapping, user
- filtering by process, mapping, or user
- configurable columns from multiple data sources
- configurable output units and percentages
- configurable headers and totals
- reading live data from /proc
- reading data snapshots from directory mirrors or compressed tarballs
- lightweight capture tool for embedded systems
- built-in chart generation
Installing smem on Debian 6 / 7 / Ubuntu 14.04 / Turnkey Linux etc. servers is done with standard:
debian:~# apt-get install –yes smem
….
To install smem on CentOS 6 / 7:
[root@centos ~ ]# yum -y install smem
….
On Slackware and other Linux-es where smem is not available as a package you can install it easily from binary archive with:
cd /tmp/
wget http://www.selenic.com/smem/download/smem-1.3.tar.gz
tar xvf smem-1.3.tar.gz
sudo cp /tmp/smem-1.3/smem /usr/local/bin/
sudo chmod +x /usr/local/bin/smem
Two most common smem uses are:
root@mail:~# smem -u
User Count Swap USS PSS RSS
dnslog 1 44 48 54 148
qmaill 4 232 124 145 464
hipo 11 13552 8596 9171 13160
qscand 2 4500 295336 295602 297508
root 188 217312 4521080 4568699 7712776
Below command shows (-u – Report memory usage by user, -t – show totals, -k – show unix suffixes)
root@mail:~# smem -u -t -k
User Count Swap USS PSS RSS
dnslog 1 44.0K 48.0K 54.0K 148.0K
qmaill 4 232.0K 124.0K 145.0K 464.0K
hipo 11 13.2M 8.4M 9.0M 12.9M
qscand 2 4.4M 288.4M 288.7M 290.5M
root 188 212.2M 4.3G 4.4G 7.4G
—————————————————
206 230.1M 4.6G 4.6G 7.7G
To get users memory use by percentage with smem:
root@mail:~# smem -u -p
User Count Swap USS PSS RSS
dnslog 1 0.00% 0.00% 0.00% 0.00%
qmaill 4 0.00% 0.00% 0.00% 0.01%
hipo 11 0.17% 0.11% 0.11% 0.16%
qscand 2 0.05% 3.63% 3.63% 3.66%
root 194 2.64% 56.18% 56.77% 95.56%
It is also useful sometimes when you want to debug system overloads caused by external hardware drivers loaded into kernel causing issues to get list of system wide memory use sorted by user
root@mail:~# smem -w -p
Area Used Cache Noncache
firmware/hardware 0.00% 0.00% 0.00%
kernel image 0.00% 0.00% 0.00%
kernel dynamic memory 38.30% 36.01% 2.28%
userspace memory 60.50% 0.98% 59.53%
free memory 1.20% 1.20% 0.00%
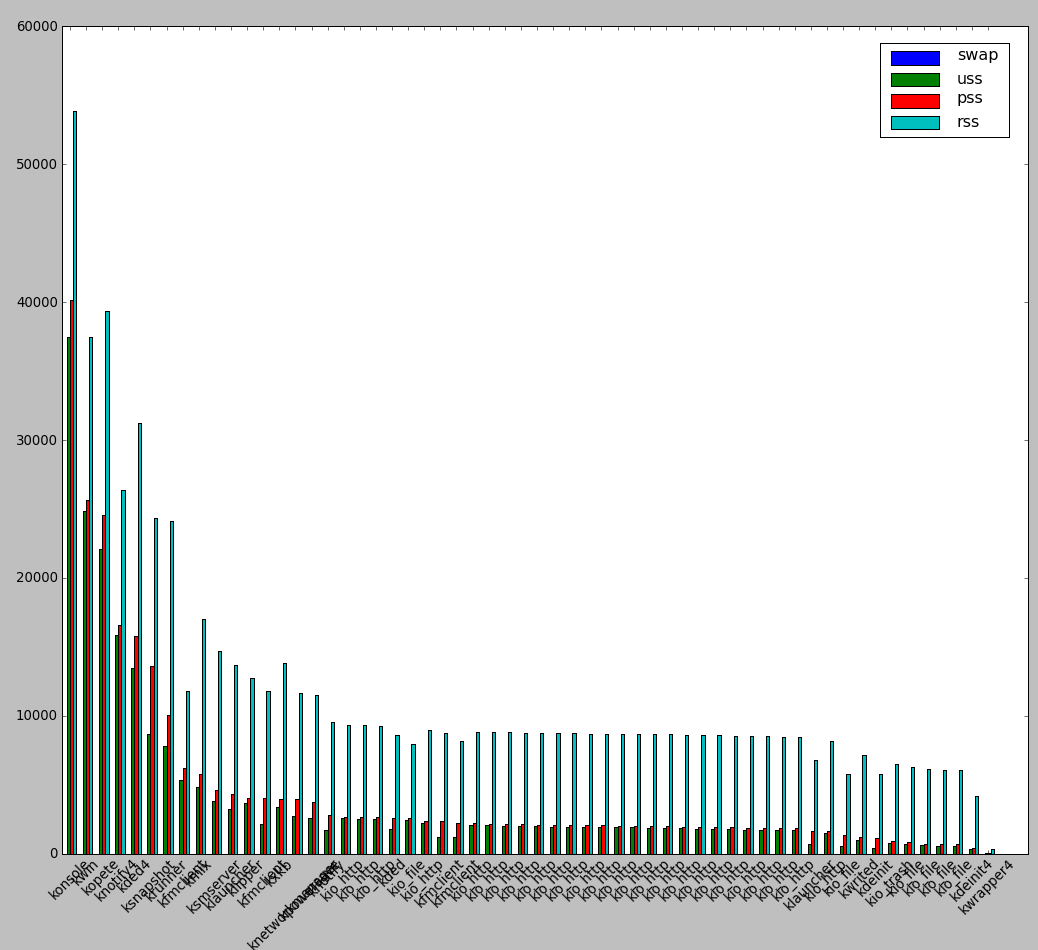
smem is very nice as if you're running it on a Desktop Linux system with Xserver installed you can see also graphical output of memory use by application:
root@desktop-pc:~# smem –bar pid -c "pss uss"

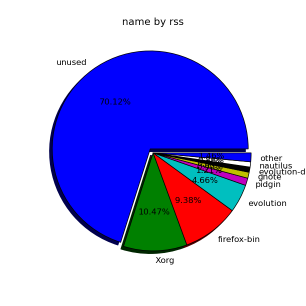
smem can even generate graphical pie charts to visualize better memory use
root@desktop-pc:~# smem -P '^k' –pie=name

If there is a high percentage shown in firmware/hardware this means some buggy module is loaded in kernel eating up memory, to fix it debug further and remove the problematic module.
userspace memory actually shows the percantage of memory out of all server available RAM that is being consumed by applications (non kernel and other system processes which make the system move). You see in above example the kernel itself is consuming about 40% of system overall available memory.
We all know the SWAP field stands for hard disk drive used as a memory when system is out, but there are 3 fields which smem will report which will be probably unclear for most here is also explanation on what USS / PSS / RSS means?
RSS is the Resident Set Size and is used to show how much memory is allocated to that process and is in RAM. It does not include memory that is swapped out. It does include memory from shared libraries as long as the pages from those libraries are actually in memory. It does include all stack and heap memory too.
There is also PSS (proportional set size). This is a newer measure which tracks the shared memory as a proportion used by the current process. So if there were two processes using the same shared library from before.
USS stands for Unique set size, USS is just the unshared page count, i.e. memory returned when process is killed
PSS = Proportional set size, (PSS), is a more meaningful representation of the amount of memory used by libraries and applications in a virtual memory system.
Because large portions of physical memory are typically shared among multiple applications, the standard measure of memory usage known as resident set size (RSS) will significantly overestimate memory usage. The parameter PSS instead measures each application’s “fair share” of each shared area to give a realistic measure. For most admins checking out the output from RSS (output) should be enough, it will indicate which user and therefore which daemon is eating up all your memory and will help you to catch problematic services which are cause your server to run out of RAM and start swapping to disk.
More helpful Articles

Tags: Below, check memory by user, command, commands for memory stats linux, daemons, end, generation, hipo, how to sort memory use by user, irssi, kernel image, Linux, Linux-es, list, memory, memory stats freebsd, memory stats linux, need, Output, process, root, scripting, scripts, servers, statd, top, total, unix


