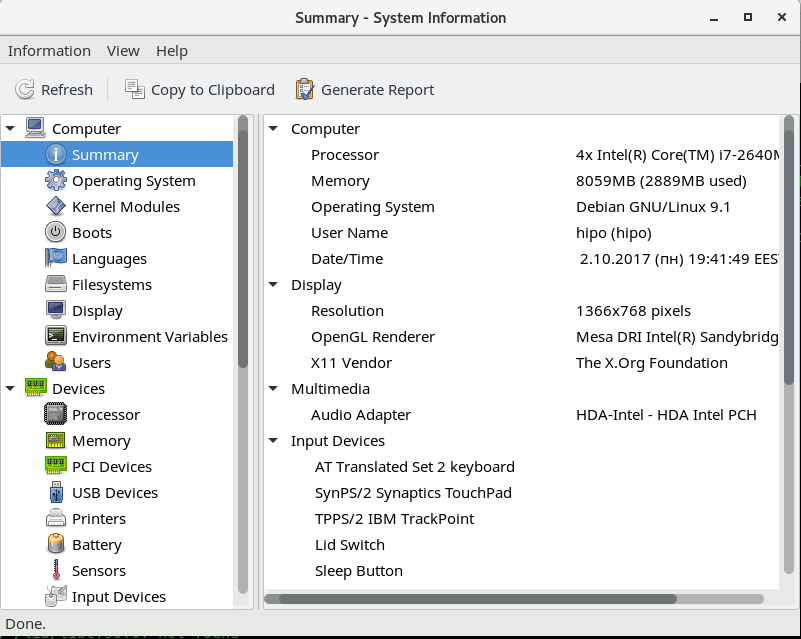
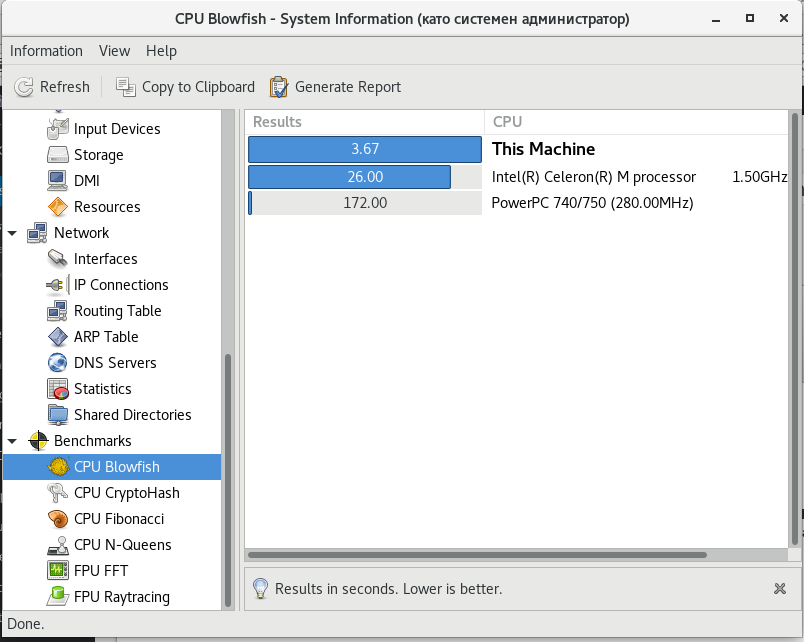
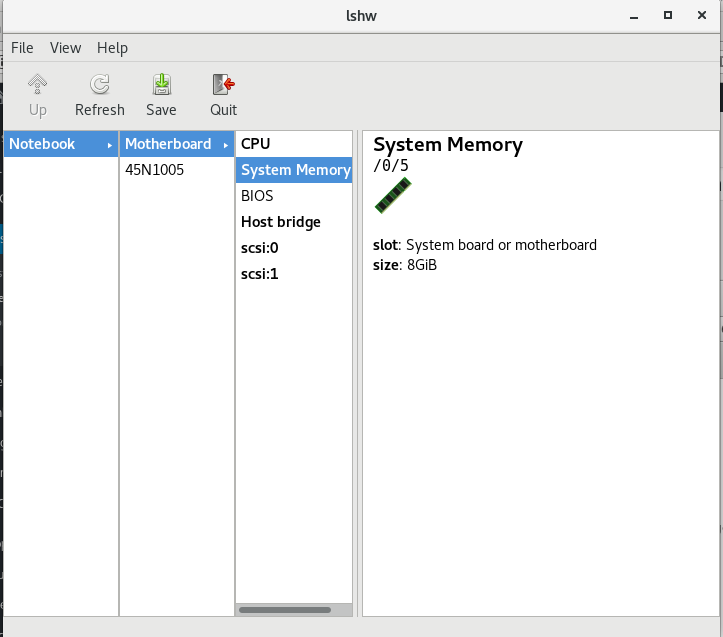
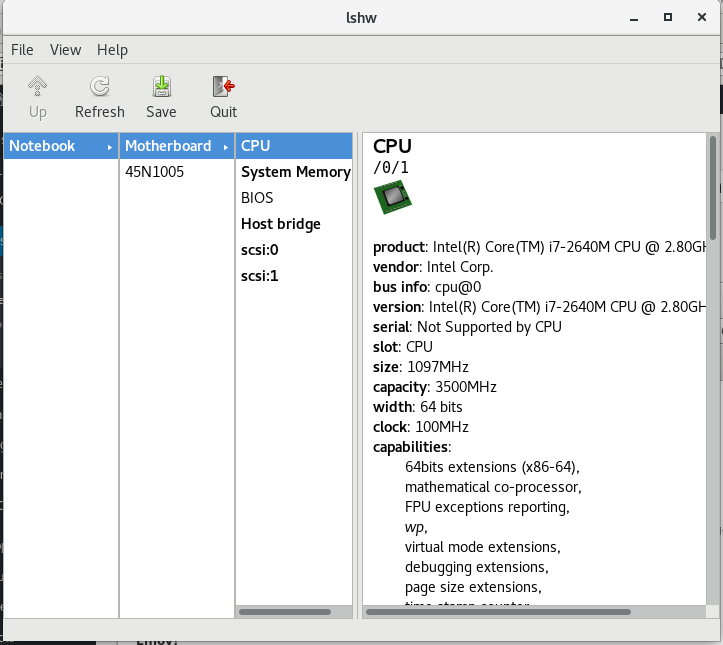
Biography of St. Prohor Pshinski
![]()
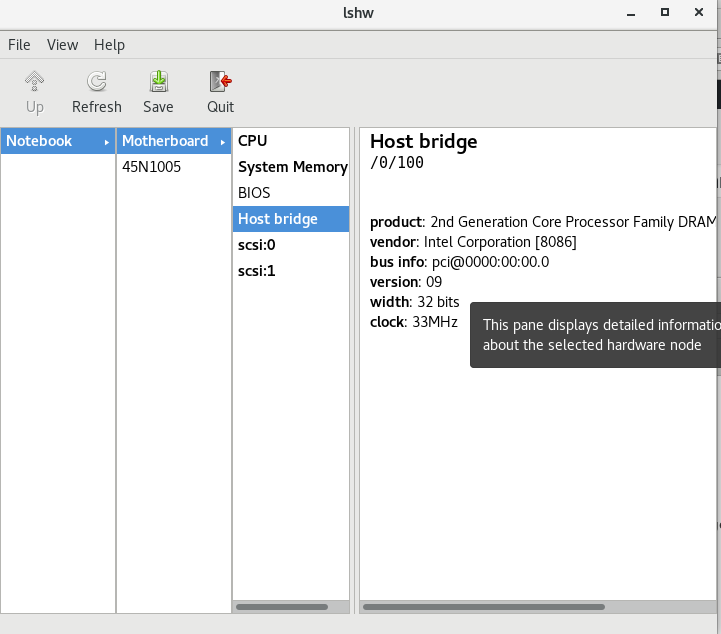
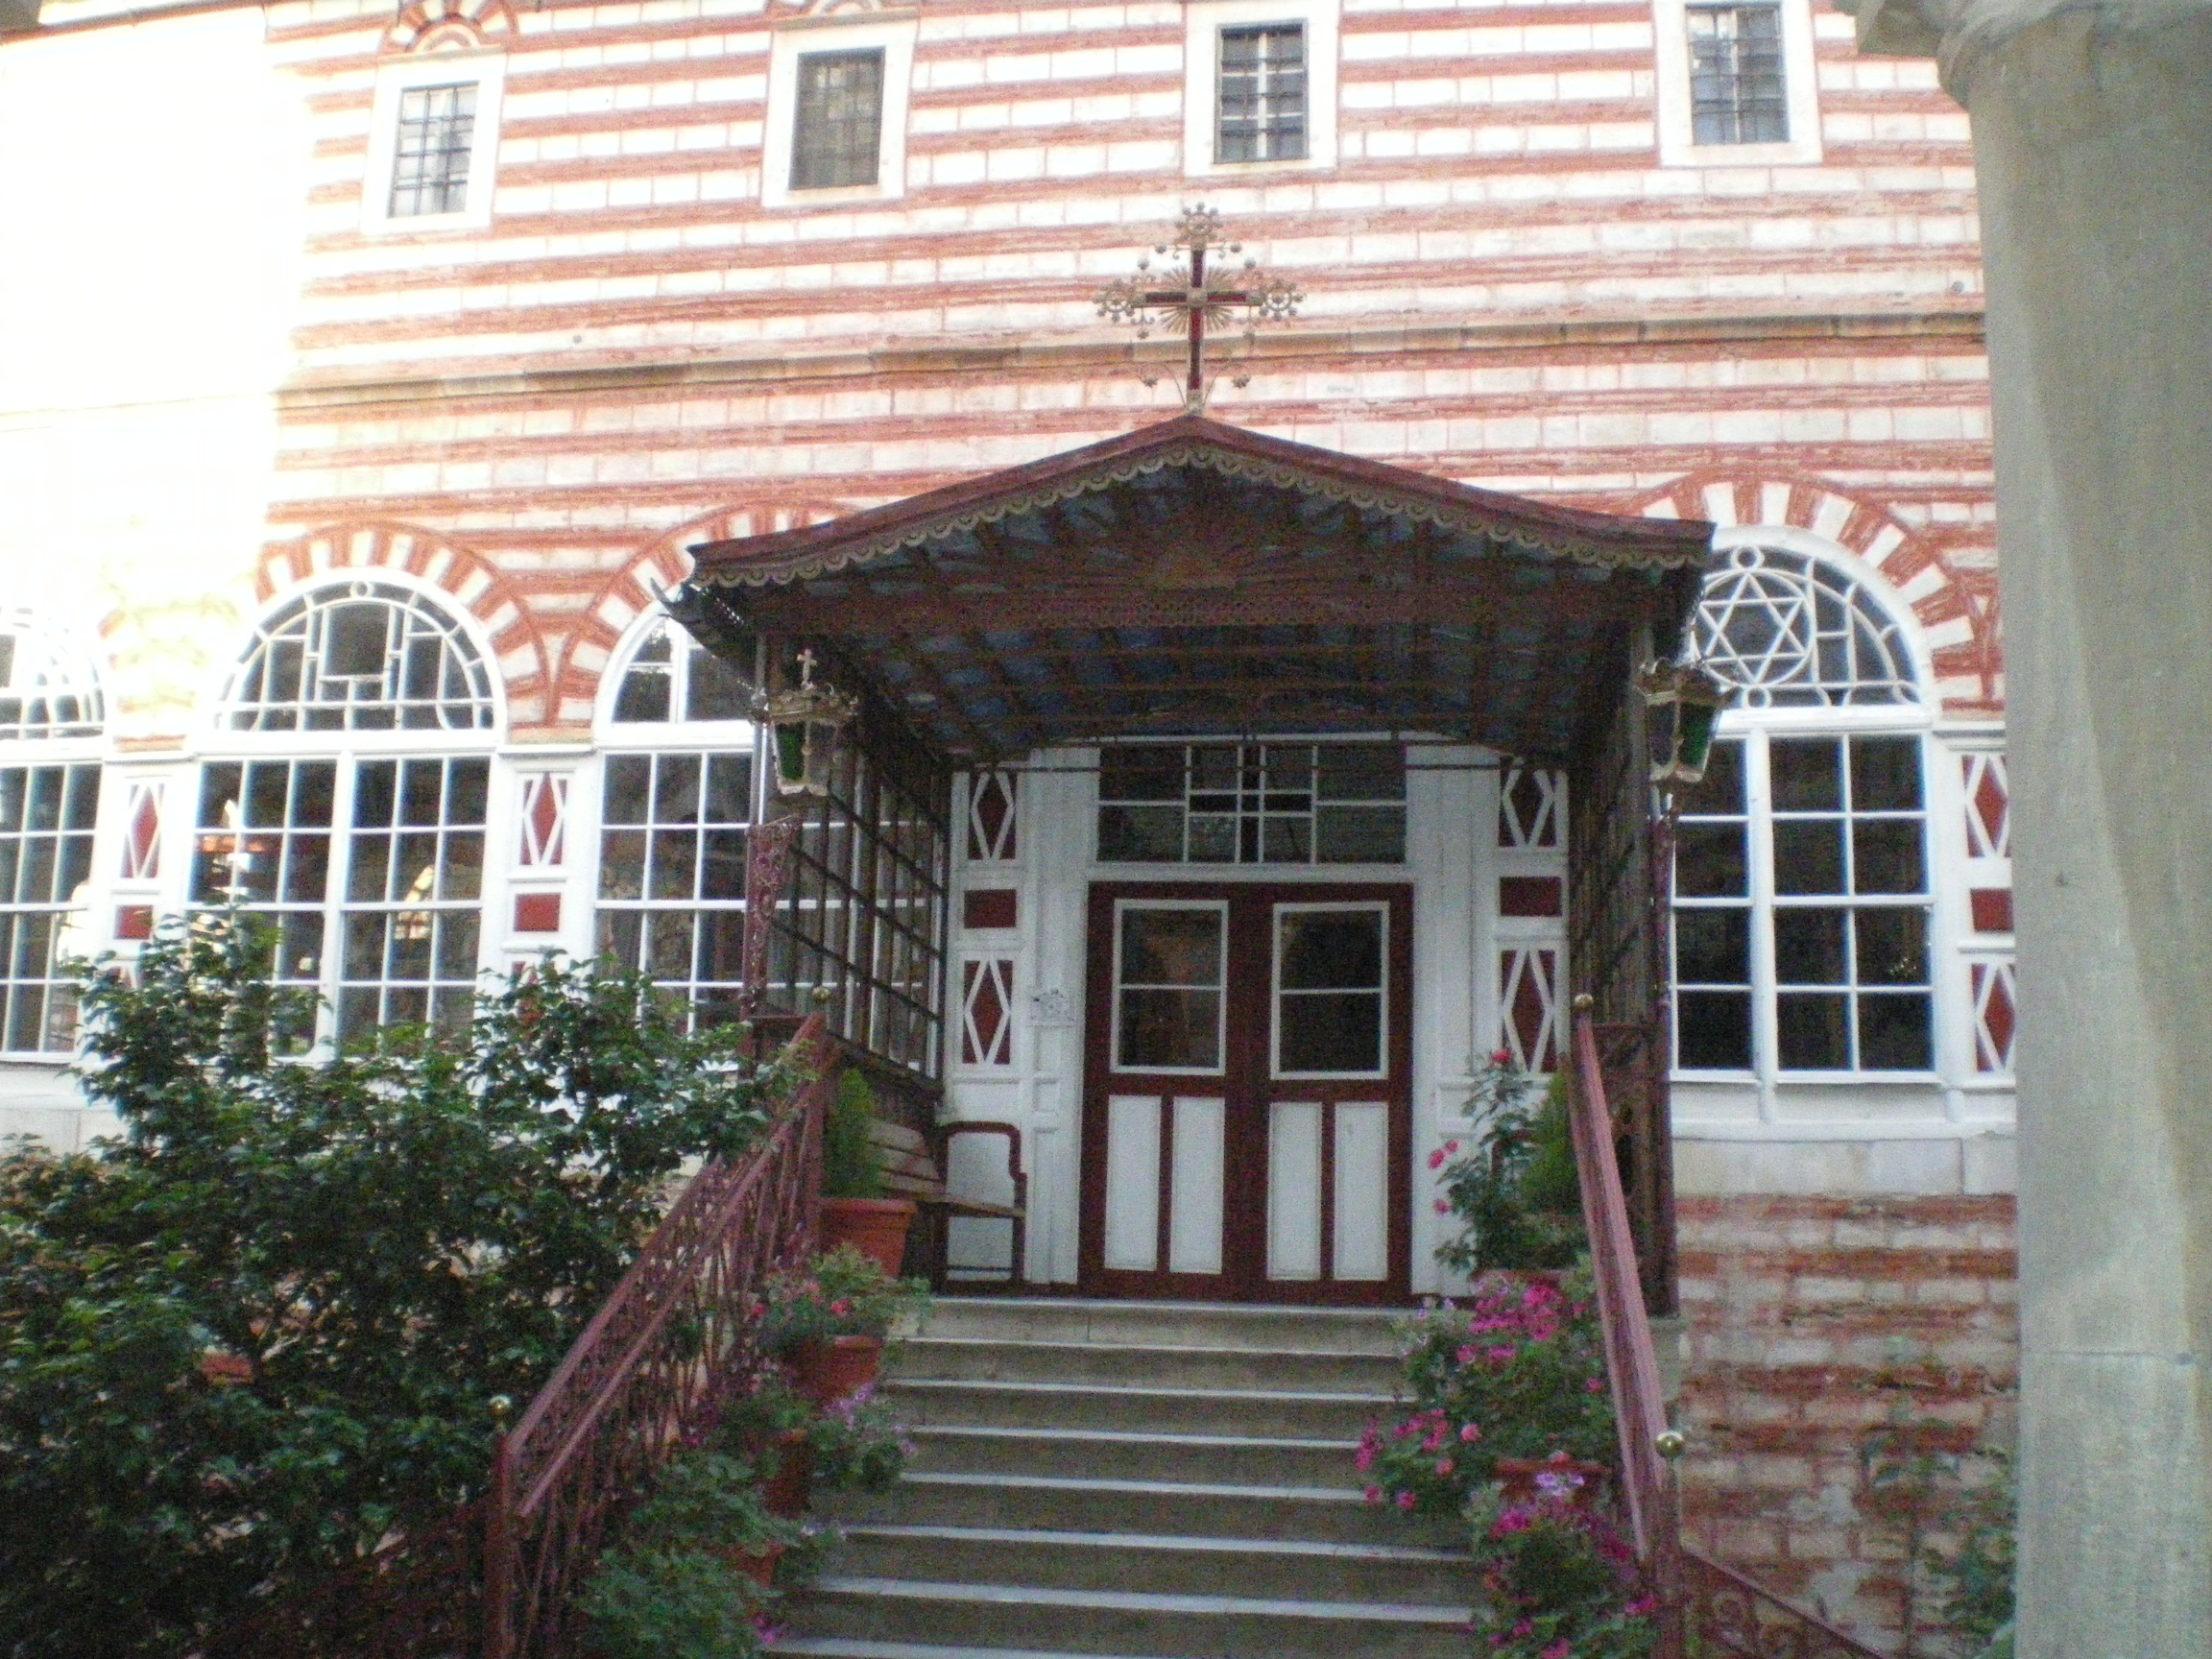
St. Prohor Pshinski. Mural from the 15th century in the church "St. Archangel Michael" in Saparevo near Kyustendil. Source: bartol, bartol.blog.bg
St. Prohor Pshinski. Mural from the 15th century in the church "St. Archangel Michael" in Saparevo near Kyustendil. Source: bartol, bartol.blog.bg The Rev.
Prohor Pshinski was a Bulgarian by birth from pious parents in the Ovce Pole region of northern Macedonia. It was given by God to childless parents for their prayers and sucked in along with his mother's milk and her high piety. When he grew up, his parents insisted on marrying him. But he once heard in the temple the words of the Savior: "He that loveth father or mother more than me is not worthy of me," (Matt. 10:37). the town of Vranje in Yugoslavia. He lived in a cave where water springs for 32 years. Once a frightened deer ran to him, chased by a hunter who soon appeared.
![]()
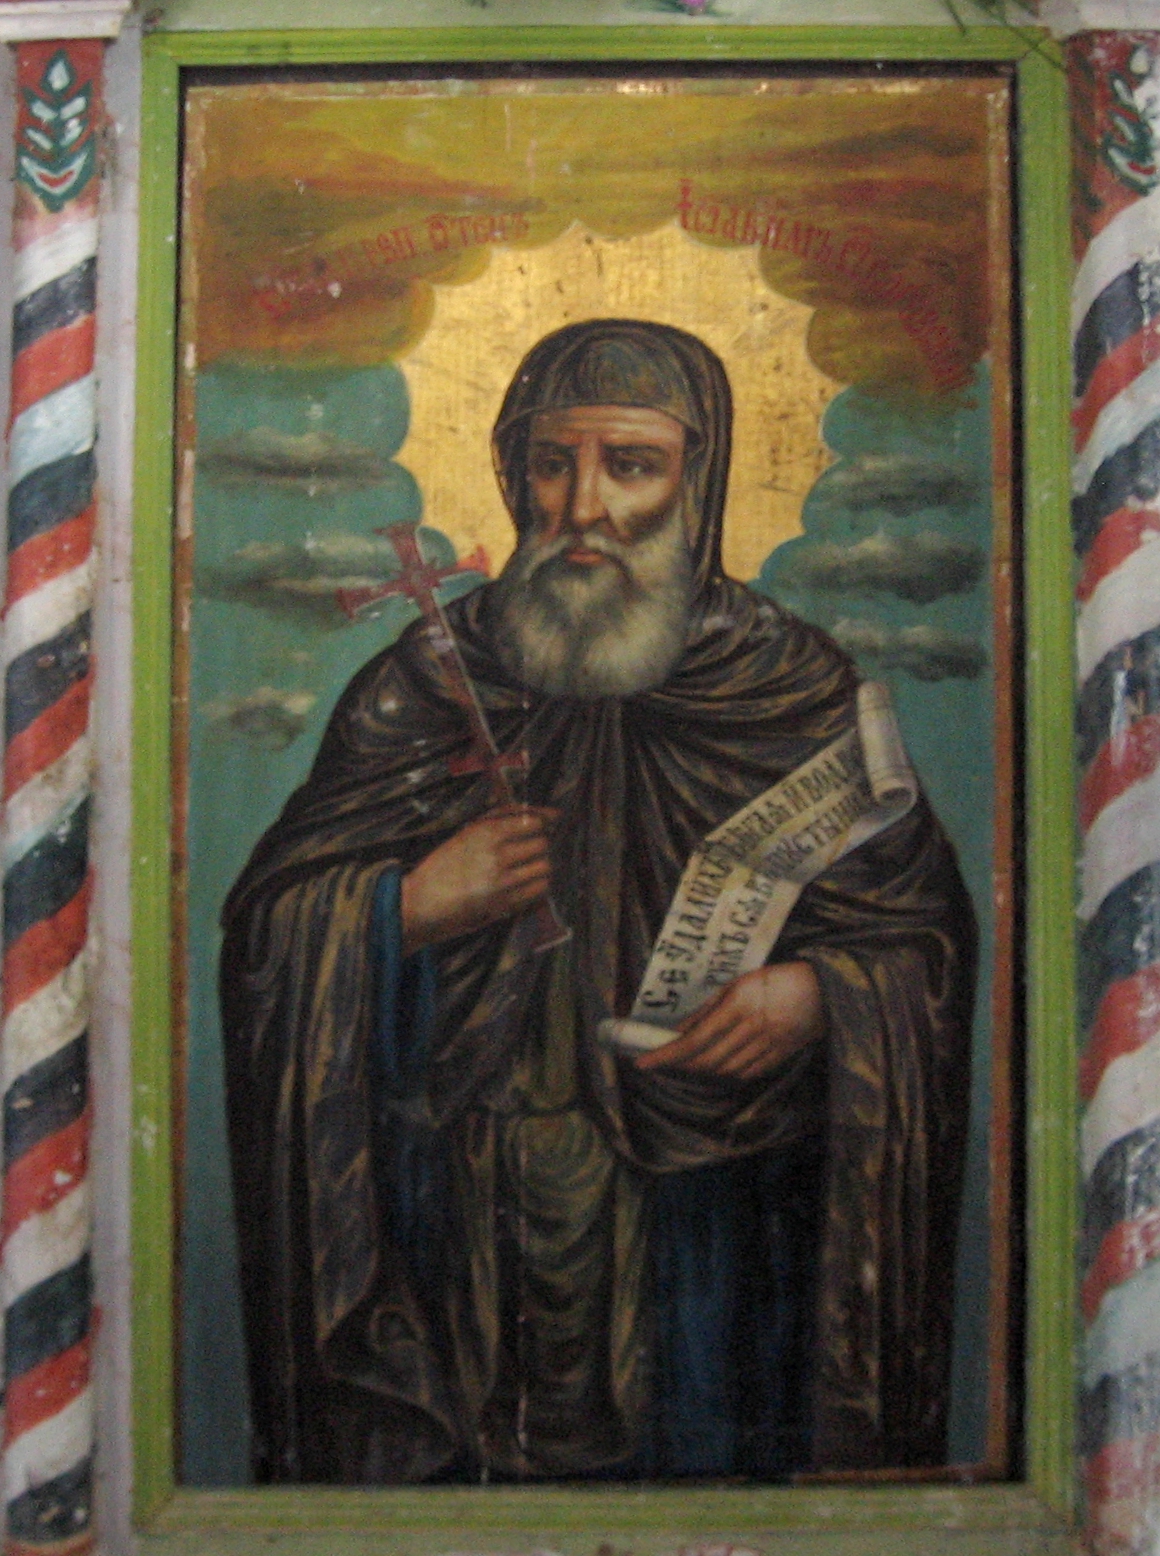
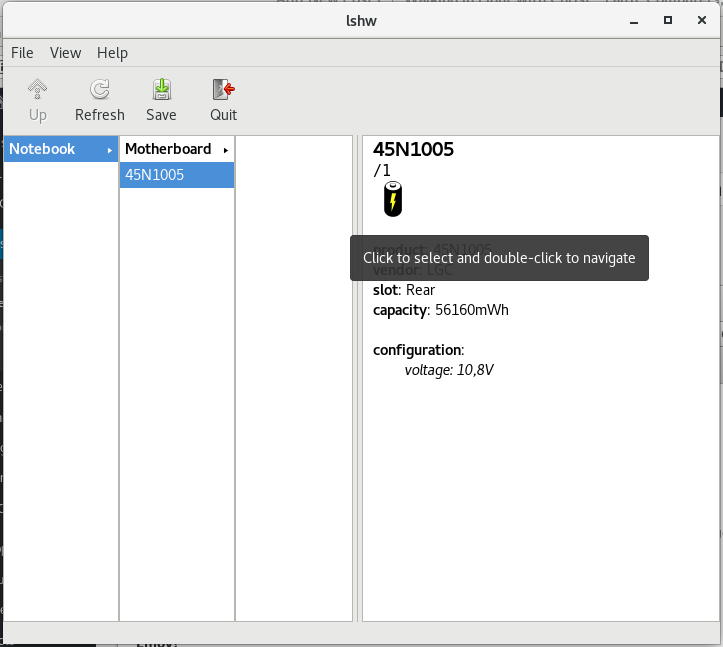
Prophor Pchinski (Pshinksi) Byzantine Empire Icon
At his first meeting, the monk called the hunter by name and predicted that he would soon become a Byzantine emperor. At that time Bulgaria was under Byzantine slavery (1018 – 1186). And indeed, after some time this man reigned under the name of Roman Diogenes (1067-1071). Astonished by the fulfillment of this prophecy, he discovered the incorruptible relics of the late Prohor Pshinski and built a large temple in the name of the saint on the site of his asceticism. His holy relics were laid there and a monastic fraternity gathered.
This monastery still exists. The Venerable Prohor Pshinski died on September 14, but due to the great feast of the Exaltation of the Holy Cross, the celebration of his memory was postponed to January 15. His monastery celebrates his memory on September 19.
© Lives of the Saints. Synodal Publishing House, Sofia, 1991, edited by Parthenius, Bishop of Lefkada (Levkijski) and Archimandrite Dr. Athanasius (Bonchev).
![]()
Saint Prohor Pchinski (Pshinski) Wall Painting icon XV century Kyustendil Bulgaria
The prologue biography of St. Prohor Pshinski is an original ancient Bulgarian writting, known in a single transcript in the New Prologue from the beginning of the 14th century (GIM, Uvar. 70). Under the date of October 19, the Venerable Hermit Saint is mentioned next to St. Ivan Rilski. Both texts are published by Kl. Ivanova (1977). D. Chesmedjiev (2009) points out that the cult of St. Prohor Pshinski is poorly fixed in the written tradition. All the details about the saint are known from his prologue. St. Prohor lived in the 11th century, working in the Kozyak mountain (near the village of Staro Nagorichino). After his death, his relics were transferred to the church he founded, called Pshinya, where he was healed.
Saint Prophor Pchinski in Modern Theology
His cult probably originated during the Byzantine rule. His memory is celebrated on September 13 and October 19. In the New Prologue, in addition to biographies of St. Ivan Rilski and St. Prohor Pshinski, there are also biographies of St. Achilles of Larissa, St. Simeon of Serbia and others. 30 years ago Kl. Ivanova (Ivanova 1977: 59) has suggested that the manuscript was compiled in the Pshin Monastery itself, but the spelling and language features of the collection are Serbian. According to the latest research by the same researcher, Nora's prologue originates from Jerusalem and was created in the Serbian monastery "St. Archangel Michael ”(Ivanova 2008: 68–70).
Biography of Saint Joachim of Osogovo
Images of St. Ivan Rilski and St. Joachim of Sarandapor from the Poganovo Monastery, end of the 15th century. It is not known where he came from, from his life it is known that he came from the west, according to Ivan Snegarov, perhaps from Zeta, in the Osogovo Mountains, where he sought monastic asylum.
An unknown boyar from the village of Gradets, not far from Kriva Palanka, today in northern Macedonia, shows him the place he was looking for monastic solitude – a cave by the Sarandapor River, today's Kriva River. Here St. Joachim spends his life as a hermit, in fasting and prayer, and the local Bulgarians revere him as a holy man.
Osogovo Monastery.
Osogovo Monastery Saint Joachim Icon
Joachim Osogowski died on August 16, 1105.On this date the Bulgarian Orthodox Church commemorates him.
Years later, the widowed priest Theodore of the Sheep Field settled in the place of Joachim's hermitage, adopting the monastic name Theophanes. After his saint appears, he discovers his miraculous relics, which are laid in the church built in his memory. In the 12th century, the cult of St. Joachim became so popular in northwestern Macedonia that a monastery of the same name was built around the temple.
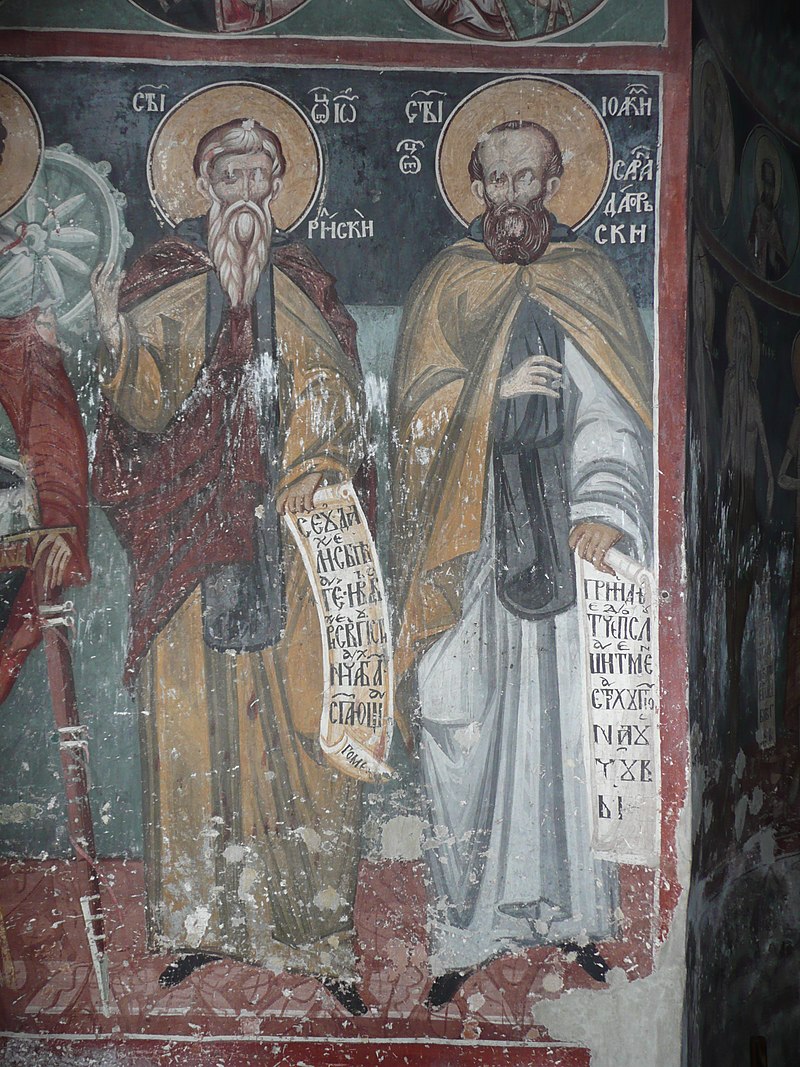
Images of St. Ivan Rilski and St. Joachim of Sarandapor from the Poganovo Monastery, end of the XV-th century ( the three most famous spiritual pupils of Saint John of Rila )
In the monastery, similar to the life of St. Ivan Rilski, a life of St. Joachim was created, known from later transcripts, as well as a service of the saint. Around the middle of the 14th century the cult of St. Joachim spread to the eastern Bulgarian lands, and at the end of the 14th century it was transferred to Russia.
Biography of Saint Gavriil (Gabriel) Lesnovski

Saint Gabriel of Lesnovo fresco from Archangels Chapel Rila Monastery, Bulgaria
![]()
St. Gavriil Lesnowski.
Detail of a mosaic on one of the doors of the Patriarchal Cathedral "St. Alexander Nevsky" in Sofia St. Gavriil Lesnowski. Detail of a mosaic on one of the doors of the Patriarchal Cathedral "St. Alexander Nevsky" in Sofia
Reverend Gavriil Lesnovski is one of the three great followers of the Rila desert dweller St. Ivan Rilski. He lived in the XI – XII century. He was born in the village of Osiche, Palaneshko (Macedonia). He came from rich Bulgarian parents and received a good education. When he was old, his parents betrothed him to a good-looking bride. Soon, however, his fiancée died. Then he entered a monastery and became a monk. With the inheritance he received from his parents, Gabriel built a monastery with a church named after St. Archangel Michael in the Lesnovo Mountains, northern Macedonia, near the present town of Kratovo.
The Venerable Father gathered monks, appointed an abbot, and he himself secluded himself in the mountains of desert life and silence, doing so for 30 years. He then returned to his monastery and died on January 15. Thirty years after the death of the Venerable Gabriel, a Russian monk named Joseph in the town of Sredets (Sofia) – at the suggestion of the saint – went to the place where the Venerable struggled, found his grave, found his incorruptible relics, laid them in a coffin and provided for prayer worship to believers.
For many years the holy relics of the Reverend Gabriel rested in the Lesnovo Monastery and performed many miracles. Probably in the thirteenth century one of the Bulgarian kings of the Assen dynasty brought them to his capital Tarnovo and laid them in the church "Holy Apostles" in Trapezitsa. According to the Reverend's prologue of 1330, "they have lain there until now and give healing." After the Ottoman invasion of Bulgaria, traces of the holy relics of the Venerable Gavriil Lesnovski are lost. The monastery he founded was later named after him and became an important literary center. © Lives of the Saints. Synodal Publishing House, Sofia, 1991, edited by Parthenius, Bishop of Lefkada (Levkijski) and Archimandrite Dr. Athanasius (Bonchev).
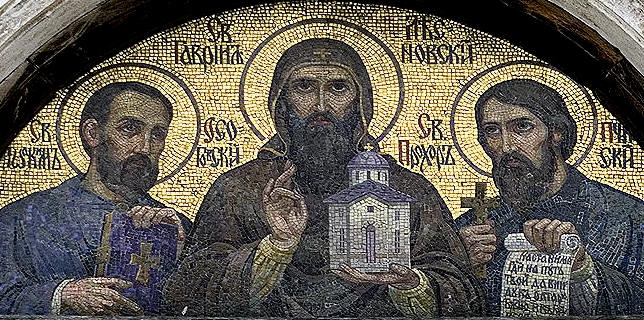 Saint Gabriel of Lesnovo, Saint Joachim of Osogovo and Saint Prohor Pchinski mosaic saint Alexander Nevski Cathedral Church, Sofia, Bulgaria
The Saints Prohor Pchinski, Joachim of Osogovo together with Saint Gabriel of Lesnovo according to Bulgarian Orthodox Church tradition are considered to be 3 of the many pupil monks of Saint John of Rila who spread the light of Holy Eastern Orthodox Christian faith in whole Bulgarian lands and from there towards Russia and far west Serbia, Croatia, Hungary who historically has been orthodox and later converted to Roman Catholicism.


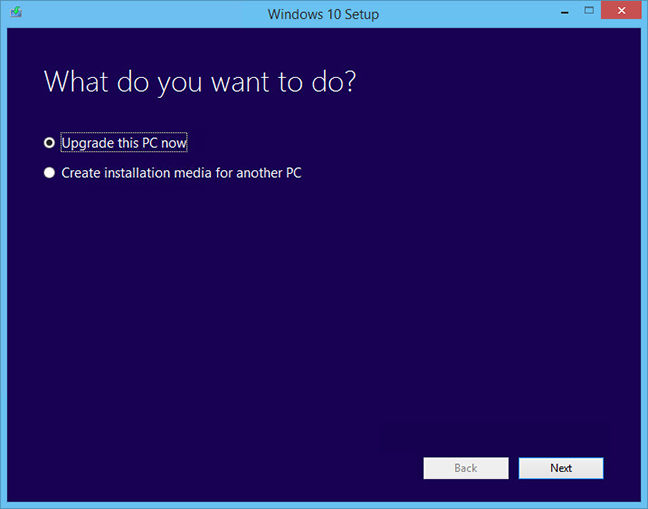
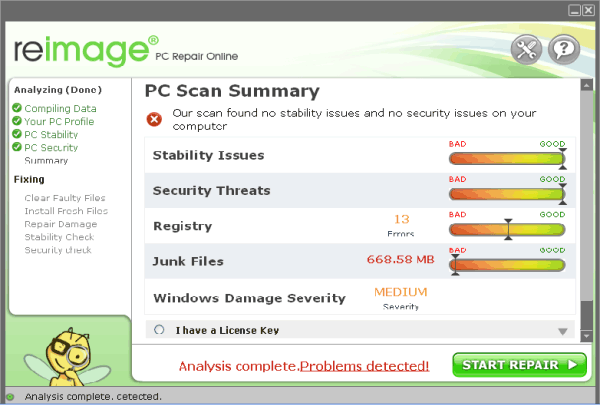
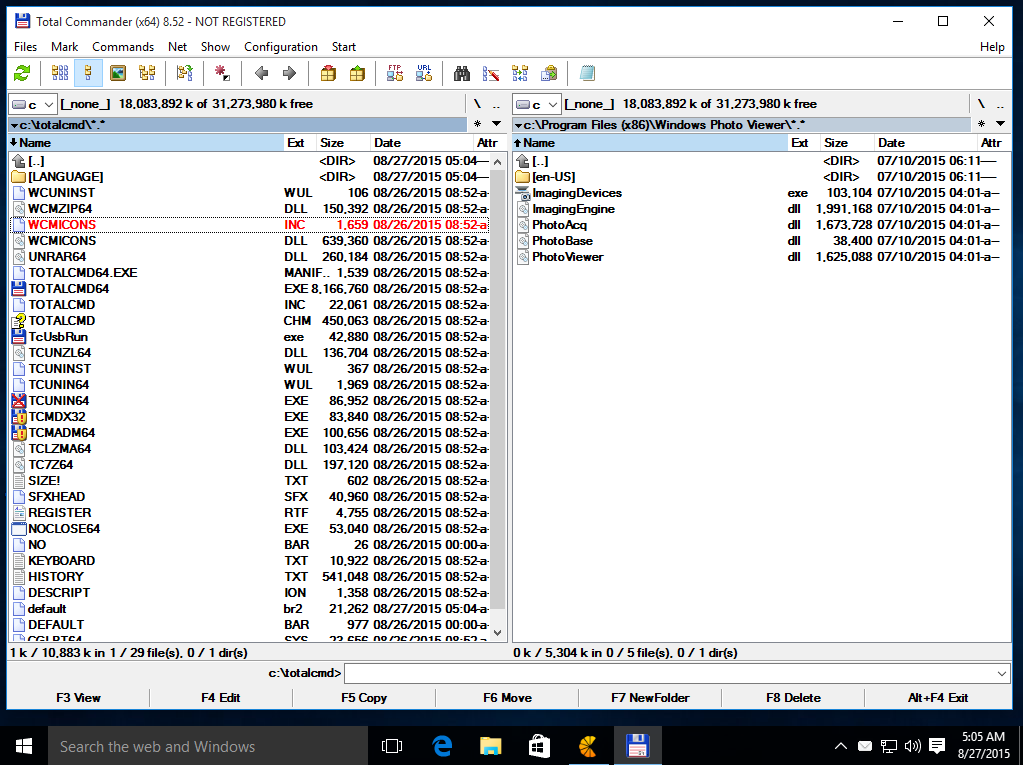
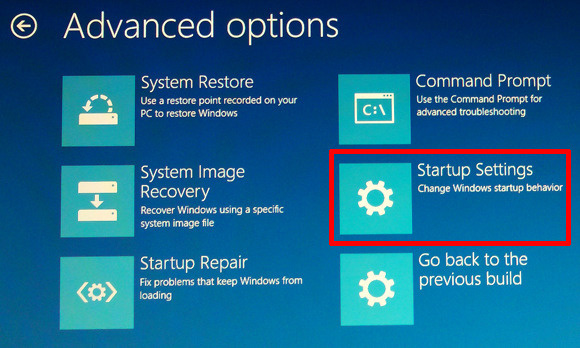
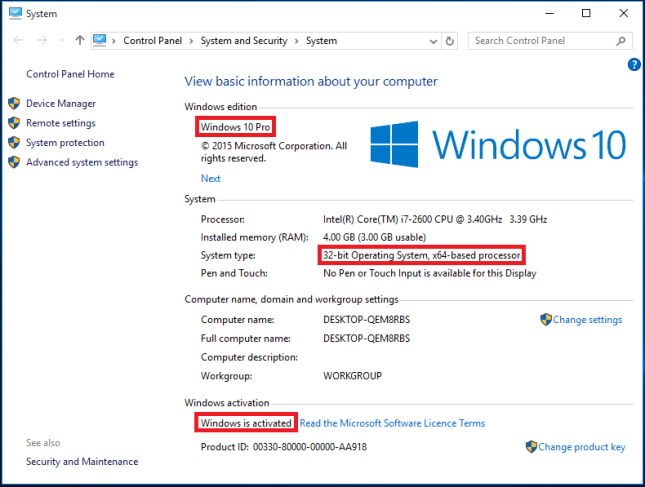


 etc.) and waiting some 30 minutes or so for the upgrade to complete.<br /> <br /> <img alt="windows-7-to-10-windows-setup-upgrade-this-pc-prompt" src="https://www.pc-freak.net/images/windows-7-to-10-windows-setup-upgrade-this-pc-prompt.png" style="width: 500px; height: 393px;" /></strong><br /> <br /> <strong>Then it was up to downloading some other updates on a few times and restarting the computer, each time the upgrades were made and all the computer was ready. I've installed Avira (AntiVirus) as I usually do on new PCs and downloaded a bunch of anti-malware (<em>MalwareBytes / Rfkill / Zemanta</em>) to make sure that the old upgraded WIndows was not already infected before the upgrade and I've found a bunch of malware, that got quickly cleared up.</strong><br /> <br /> Anyways I've tried also another tool called <a href="http://www.reimageplus.com"><strong>ReimagePlus - Online Computer Repair</strong> </a>in <strong>order to check whether there are no some broken WIndows system files after the upgrade </strong><br /> <br /> <img alt="Reimage_Repair-Windows-fix-windows-failing-services-and-broken-windows-installations-clear-up-malware" src="https://www.pc-freak.net/images/Reimage_Repair-Windows-fix-windows-failing-services-and-broken-windows-installations-clear-up-malware.png" style="width: 600px; height: 406px;" /><br /> (here I have to say I've done that besides <em>running in an Administrator command prompt</em> (<strong>cmd.exe</strong>) and running<br /> </p> <blockquote> <strong>sfc /scannow </strong> </blockquote> <p> <br /> <strong>command to check base system files integrity, which luckily showed no problems with the Win base system files.</strong><br /> <br /> <strong>ReimagePlus </strong>however showed some failed services and some failed programs that were previously installed from Windows 7 before the upgrade and even it showed indication for Trojan present on computer but since ReImagePlus is a payed software and I didn't have the money to spend on it, I just proceeded to clean up what was found manually.<br /> <br /> After that the computer ran fine, with the only strange thing that some data was from hard drive was red a bit too frequently, after a short call with a close friend (<strong>Nomen</strong>) - thx man, he suggested that the frequenty hdd usage might be related to <em><strong>Windows Search Indexing service database rebuilt</strong></em> and he adviced me to disable it which I did following <a href="https://www.howtogeek.com/howto/windows-vista/speed-up-or-disable-windows-search-indexing-in-vista/">this article How to speed up Windows by disabling Search Index Service.</a><br /> <br /> <br /> One issue worthy to mention <strong>stumbled upon after the upgrade was problems with Windows Explorer which was frequently crashing and "restarting the Desktop"</strong>, but once, I've enabled all <strong>upgrades from Microsoft and Applied them after some update failures and restarts</strong>, once all was up2date to all latest from Microsoft, Explorer started working normally. </p> <p> In the mean time while Windows Explorer was crashing in order to browse my file system I used the <a href="https://www.winnc.com/download/">good old Win Total Command or Norton Commander for Windows - WinNC (with its most cool bizzarre own File Explorer tool)</a>.<br /> <br /> <img alt="Windows-Total-commander-tool-running-on-MS-Windows-10" src="https://www.pc-freak.net/images/Windows-Total-commander-tool-running-on-MS-Windows-10.png" style="width: 500px; height: 374px;" /><br /> <br /> As I wanted to run a MalwareBytes scan and Antivirus under Windows Safe-Mode, I tried entering it by restarting the Computer and <strong>pressing F8 a number of times before the Windows boot screen but this didn't work </strong>as Safe-Mode boot was changed in Windows 10 to be callable in another way because of <strong>some extra Windows Boot speed up optimizations</strong>, in short<span style="font-size:16px;"><strong> the easiest way I found to enter Windows 10 Safe Mode was to Hit Start Button -> Choose Restart PC and keep pressed SHIFT button simultaneously</strong></span><br /> that calls a menu that gives you some restore options, along with safe mode options for those who want to read more on <a href="http://www.digitalcitizen.life/4-ways-boot-safe-mode-windows-10">How to Enter Safe mode (Command Prompt) on Windows 10 - please read this article.</a><br /> <br /> <br /> <br /> <img alt="Windows-10-enable-Safe-Mode-options-screen" src="https://www.pc-freak.net/images/Windows-10-enable-Safe-Mode-options-screen.jpg" style="width: 500px; height: 300px;" /> </p> <p> Once the upgrade was over and all below done unfortunately I've realized her previously installed <em>WIndows 7 is x86 (32 bit) version</em> and the <strong>Acer notebook 5736Z where it is being installed is actually X64 (64 bit), hence I've decided to upgrade my dear sis computer to a 64 Bit Windows 10 and researched online whether, there is some tool that is capable to upgrade WIndows 10 from 32 bit to Windows 10 64 bit just to find out the only option is to either use some program to creaty a backup of files on the PC or to manually copy files to external hard drive and reinstall with a Windows 10 64 bit bootable USB Flash or CD / DVD image, so I took my USB flash and used again Windows Media Creation Tool to burn Windows and re-install with the 64 bit iso.<br /> <br /> If you're wonder about why I choose to re-install finally<em> Win 10 32 bit with Win 64 bit</em>, because you might think performance difference might be not really so dramatic, then I have to say the Acer notebook is equipped with 4 Gigabytes of RAM Memory and Windows 10 32bit (Pro) could recognize a maximum of 3 Gigabytes (2.9 GB if I have to be precise) and 1 Gigabyte of memory stayes totally unusued with <em>Winblows 10 32 bit</em>.<br /> <br /> <em>Well that's all folks, the rest I did was to just boot from the USB drive just burned and re-install WIndows and copy my files from User profile / Downloads / Pictures / Music etc. to the same locations on the new installed Windows 10 professional 64 bit and enjoy the better performance.</em></strong> </p>)