Why run an Own Home or Dedicated Own server nowadays is a must in the Digital Age ?
Having own home based email server should be the target (most basic step) of any person that respects his Email privacy as most of the Public accessible Email accounts such as Yahoo Mail! and Gmail are collecting personal flavour info and flavour data.
Thus to mitigate the possible Personal Security problems of using any of the multiple Public Email services it is rather easy nowdays to configure quickly a own based home Email server, Hire Cheap VPS for Own Email Service or even hire a Dedicated server – the cheapeast dedis nowadays are starting from 40 / 50 EUROs per server.
To protect your Email privacy to maximum and keep your email data owned by you hence in this small article, I'll explain how to setup a Postfix based Simple own hosted Email server in about 2 hours of time, but before proceeding with the actual install instructions, I'll say a bit more on the downsides of using public mail gmail.com / yahoo.com / yandex.ru etc.
– The Downsides of using Public free hosted email address such as Google / Yahoo / Yandex / Mail.com etc.
If you happen to have @gmail.com account then you're more or less surveilled by automated scripts software that prepares your virtual dossier – those of us who lived in the Communism of USSR, knew that each of us had a good personal record kept in policy no matter of his function in society, now the situation is no different besides the fact that your Corporate owned data is often sold to National Governments could leak out of its owner and a lot of very personal data could end up in the hands of some malicious blackmailers or spammers, that could have a very complete records of your interest, age, profession, marrital status, position in society, music preference, daily habits, something definitely most people want to avoid.
– Why using Android Phone with Gmail is terrible for your privacy / myaccount.google.com and what Google knows about you
To get further idea about the great expand of Surveillance, if you're an Android Mobile Phone User like me I recommend you login with your Android Email account to https://myaccount.google.com and find out what Google knows about you or better said what from what it knew is willing to show you.
Android OS phones collect a lot of data connected to your Mail use if you stay logged in in Browser (because you forgot to logout and left the new tab opened) as well as track you about the overall Google Search Engine made searches or Youtube watched and preferred genre videos – hence know about overall activity on the Net. And even worse perhaps there is much more details that are automatically shared to Google as you're continuously logged in to Android Google Play …
To illustrate what I mean in terms of How much we're surveilled nowadays, in one of my Gmail accounts I've been almost stunned seeing that, some Google Data Analytics scripts based on the Android Synchronized pictures has created a full featured nice funny Music video of "my life", showing me pictures of my marriage ceremonly, places, where I visit such as some Monasteries, close friends and a tons of very private data that in normal circumstances, they should never know about.
Earlier I've blogged how to Install and Configure a Postfix server with Dovecot and MySQL with a configuration setup that worked on Debian 7 and prior Debian servers which used to be among the only setups that can keep mail accounts inside the database that worked on the net and for more professional Email server to be serving a small / midsized company multiple email boxes perhaps it is still a good one to follow, however as above suggested initial config is a bit overcomplicated (and maybe outdated) for Linux novice users / sysadmins and for own small home servers with only few Mail accounts it might be not needed at all.
I've decided to write how to setup much more quickly and easily Working Internet Mail server with MailBoxes directly owned by each of the UNIX created local accounts.
1. Install prerequired packages for Email setup and set hostname
Update Debian Linux distribution to the latest:
apt-get –yes update && apt-get –yes upgrade
apt-get install curl net-tools bash-completion wget lsof nano mailutils bsdmailx
In this article I assume you already have your own Linux server.
To make the hosts file ber read before any local running DNS server in case if you're running bind or any other local caching DNS server add following lines to /etc/host.conf
vim /etc/host.conf
order hosts,bind
multi on
If you already haven't configured the machine hostname on Linux OS install time, next step is to set the machine hostname to the Fully Qualified Domain Name (FQDN) that will be used by mail server.
hostnamectl set-hostname mail.your-mail-domain.com
If you don't plan to regularly change the IP address of Mail server It is a good idea to add the IP -> Domain relation to /etc/hosts doing so should not waste DNS cycles to resolve the hostname but every time the hostname will be locally taken from /etc/hosts.
echo "86.78.10.1 your-mail-domain.com mail.your-mail-domain.com" >> /etc/hosts
getent ahosts mail.your-mail-domain.com
86.78.10.1 STREAM mail.your-mail-domain.com
86.78.10.1 DGRAM
86.78.10.1 RAW
Also check whether mail.your-mail-domain.com is pingable
ping mail.your-mail-domain.com
You should get a properly delivered ping packets with no losses.
2. Install Postfix Mail Server Debian package
Debian Postfix package provides a MTA (Message Transfer Agent). MTA is a pr
apt-get install –yes postfix
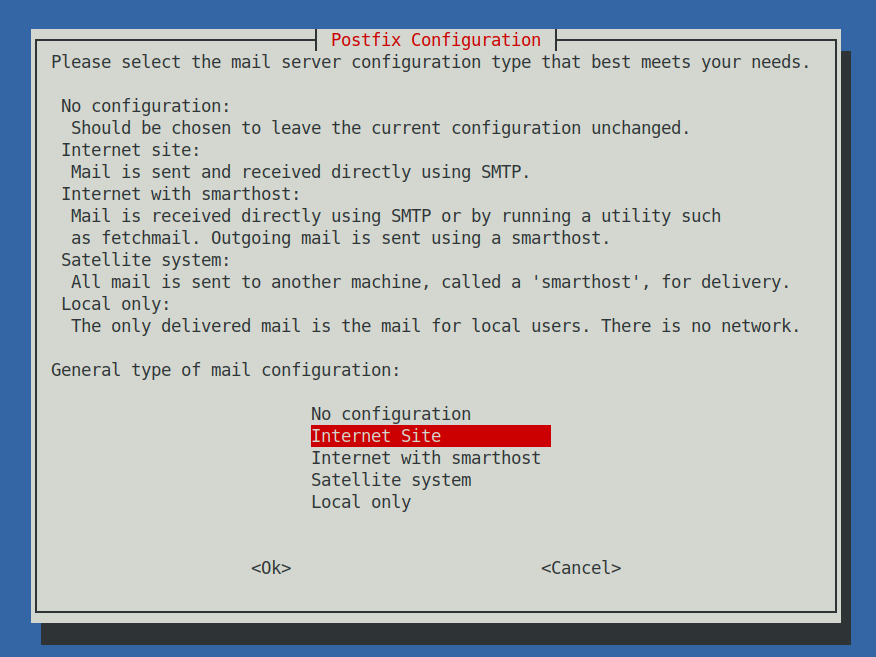
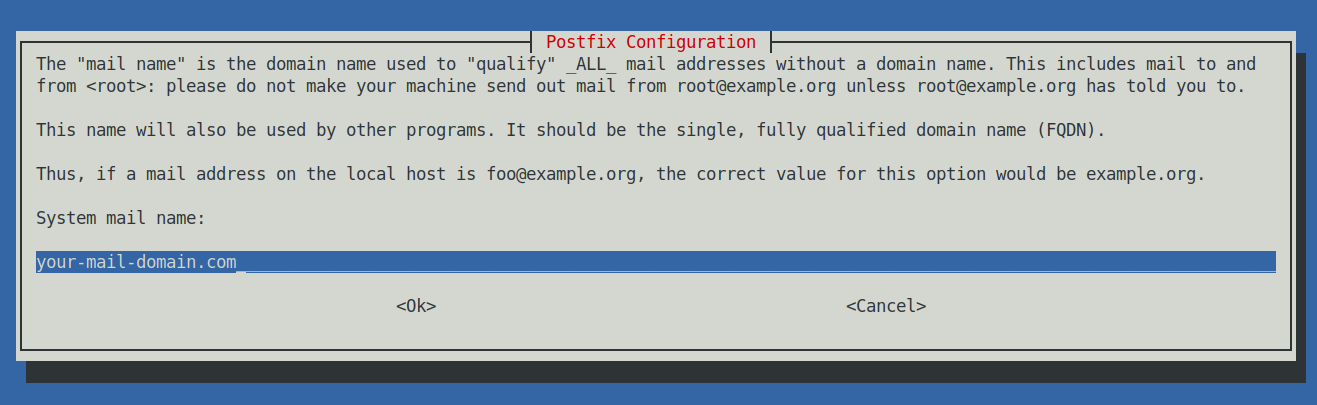
Next a ncurses interface will prompt you the usual Postfix type configuration where we have to choose Internet Site and type in the mail name your-mail-domain.com (note that here you have to type the domain without the mail. part) .
3. Setup Postfix Mail server configuration main.cf
Before starting make backup of main.cf
cp -rpf /etc/postfix/main.cf{,.backup}
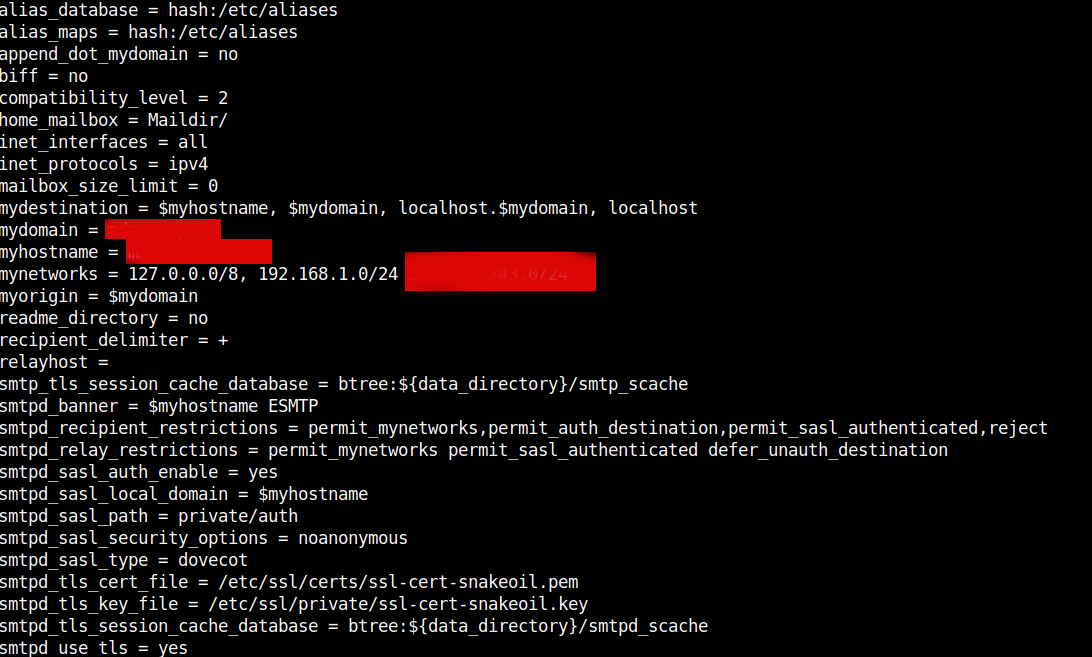
vim /etc/postfix/main.cf
# See /usr/share/postfix/main.cf.dist for a commented, more complete version
smtpd_banner = $myhostname ESMTP
biff = no
# appending .domain is the MUA's job.
append_dot_mydomain = no
readme_directory = no
# See http://www.postfix.org/COMPATIBILITY_README.html — default to 2 on
# fresh installs.
compatibility_level = 2
# TLS parameters
smtpd_tls_cert_file=/etc/ssl/certs/ssl-cert-snakeoil.pem
smtpd_tls_key_file=/etc/ssl/private/ssl-cert-snakeoil.key
smtpd_use_tls=yes
smtpd_tls_session_cache_database = btree:${data_directory}/smtpd_scache
smtp_tls_session_cache_database = btree:${data_directory}/smtp_scache
# See /usr/share/doc/postfix/TLS_README.gz in the postfix-doc package for
# information on enabling SSL in the smtp client.
smtpd_relay_restrictions = permit_mynetworks permit_sasl_authenticated defer_unauth_destination
myhostname = mail.your-mail-domain.com
mydomain = your-mail-domain.com
alias_maps = hash:/etc/aliases
alias_database = hash:/etc/aliases
#myorigin = /etc/mailname
myorigin = $mydomain
mydestination = $myhostname, $mydomain, localhost.$mydomain, localhost
relayhost =
mynetworks = 127.0.0.0/8, 192.168.1.0/24 86.78.10.0/24
mailbox_size_limit = 0
recipient_delimiter = +
inet_interfaces = all
#inet_protocols = all
inet_protocols = ipv4
home_mailbox = Maildir/
# SMTP-Auth settings
smtpd_sasl_type = dovecot
smtpd_sasl_path = private/auth
smtpd_sasl_auth_enable = yes
smtpd_sasl_security_options = noanonymous
smtpd_sasl_local_domain = $myhostname
smtpd_recipient_restrictions = permit_mynetworks,permit_auth_destination,permit_sasl_authenticated,reject
Replace the myhostname, mydomain and mynetworks variables to match your own configurations.
If for example your Mail Host IP is 86.78.10.1 then to add only this IP to mynetworks 86.78.10.1/32, if you have a range of IPs such as a 254 IP's range set the proper mask 86.78.10.1/24 etc.
Next you better test the configuration to make sure you haven't syntax errors with:
postconf -n
If no syntax errors found the command should dump main.cf postfix set variables.
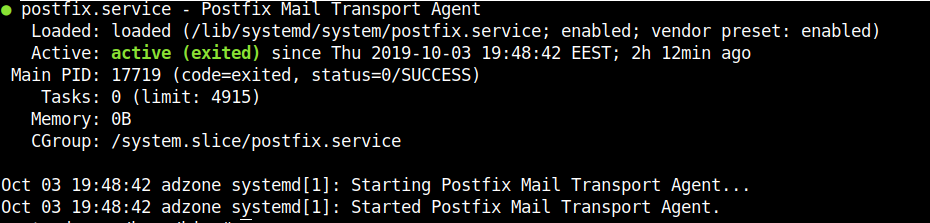
Once config is fine to load it and test the status of postfix run:
systemctl restart postfix
systemctl status postfix
Then lets check the listener and try out telnet connect.
netstat -tulpan|grep -i 25
tcp 0 0 0.0.0.0:25 0.0.0.0:* LISTEN 17715/master
telnet localhost 25
Trying 127.0.0.1…
Connected to localhost.
Escape character is '^]'.
220 mail.your-mail-domain.com ESMTP
4. Testing email sent is working on Postfix Mail Server
First lets test postfix is able to deliver to local email addresses by sending mail to mail root user mailbox
echo "This is a test mail body"| mail -s "Simple test mail" root
Everything should be fine and mail should be the last delivered to root MailBox to view it:
cat /root/Maildir/new/$(ls -1 /root/Maildir/new/|tail -1)
Return-Path: <root@localhost>
X-Original-To: root@localhost
Delivered-To: root@localhost
Received: by mx.adzone.pro (Postfix, from userid 0)
id 9C4FA7E1952; Thu, 3 Oct 2019 22:19:59 +0300 (EEST)
Subject: Simple test mail
To: <root@localhost>
X-Mailer: mail (GNU Mailutils 3.5)
Message-Id: <20191003191959.9C4FA7E1952@mail.your-mail-domain.com>
Date: Thu, 3 Oct 2019 22:19:59 +0300 (EEST)
From: root <root@localhost>
This is a test mail body
by default mail command will try to read email content from /var/mail/root file which will be empty file, because Postfix main.cf home_mailbox = Maildir/ emails served by MTA will be delivered to /$USER/Maildir/ seperated in 3 directories (cur – current, mail ends here once red, new – new incoming mail, tmp – temporary directory used by postfix delivery programs /usr/lib/postfix/sbin/master and qmgr.
# ls -al /$USER/Maildir
total 20
drwx—— 5 root root 4096 Sep 30 20:26 .
drwx—— 9 root root 4096 Oct 3 22:37 ..
drwx—— 2 root root 4096 Sep 30 20:26 cur
drwx—— 2 root root 4096 Oct 3 22:19 new
drwx—— 2 root root 4096 Oct 3 22:19 tmp
Hence to set for mail command to read its mails from /$USER/Maildir you need to add:
export MAIL=$HOME/Maildir
to end of ~/.bashrc red for user after very user login.
echo 'export MAIL=$HOME/Maildir' >> /root/.bashrc
or if you want to make the mail command to read from /$USER/Maildir system wide (e.g. for all users).
You can add a simple script mailenv.sh to /etc/profile.d/
echo 'export MAIL=$HOME/Maildir' ' >> /etc/profile.d/mailenv.sh
If mail is send successfully you should also get an empty mail queue:
# mailq
Mail queue is empty
To get further info on how email got delivered its delivery status:
tail -f /var/log/mail.log
Once we're sure everything is fine with mail delivery, next step is to enable the Server to be accessed via IMAP2 protocol in plain text or crypted connected via Dovecot.
5. Install and configure Dovecot IMAP daemon
Dovecot is server binded daemon, responsible to deliver messages to local recipients mailboxes in IMAP protocol. IMAP protocol runs by default on port 143 and port 993 (SSL) – used for secure communication between the client side and the server. IMAP (Internet Message Acess Protocol) is used by email clients to retrieve email messages from a mail server over a TCP/IP connection.
IMAP was designed with the goal of permitting complete management of an email box by multiple email clients, therefore clients generally leave messages on the server until the user explicitly deletes them.
The IMAP protocol also uses synchronization in order to assure that a copy of each message is saved on the server and allows users to create multiple directories on the server and move mails to this directories in order to sort the e-mails.
POP3 proto (listening on port 110) which is older in time, differs from IMAP as protocol won’t allow users to create multiple directories on the server to sort your mail. You only have the inbox folder to manage mail.
But enought talk, lets kick in and install dovecot.
apt install –yes dovecot-core dovecot-imapd
…
Once installed to make dovecot listen on 143 and 993 on all network interfaces edit /etc/dovecot/dovecot.conf find commented line #listen = *, :: and uncomment it
vim /etc/dovecot/dovecot.conf
#listen = *, ::
listen = *, ::
….
Next edit /etc/dovecot/conf.d/10-auth.conf to disable obligatory SSL / TSL authentication for connecting client programs
disable_plaintext_auth and auth_mechanisms vars should look like so
disable_plaintext_auth = no
auth_mechanisms = plain login
Then, change the default mail store format from Mbox to Maildir in /etc/dovecot/conf.d/10-mail.conf comment mail_location set directive and change it to mail_location = maildir:~/Maildir
vim /etc/dovecot/conf.d/10-mail.conf
…
## mail_location = mbox:~/mail:INBOX=/var/mail/%u
mail_location = maildir:~/Maildir
…
Finally edit /etc/dovecot/conf.d/10-master.conf
Search for smtp-auth block of code and change to look as following:
# Postfix smtp-auth
unix_listener /var/spool/postfix/private/auth {
mode = 0666
user = postfix
group = postfix
}
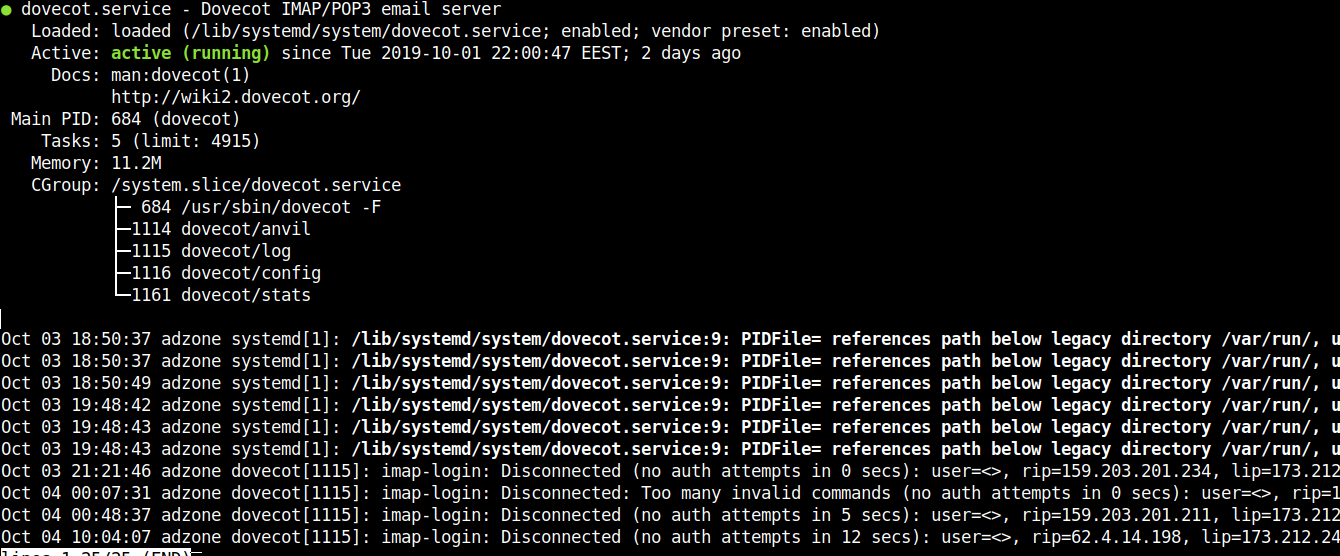
6. Restart dovecot and test if configuration works as expected
systemctl restart dovecot.service
systemctl status dovecot.service
netstat -tlpn
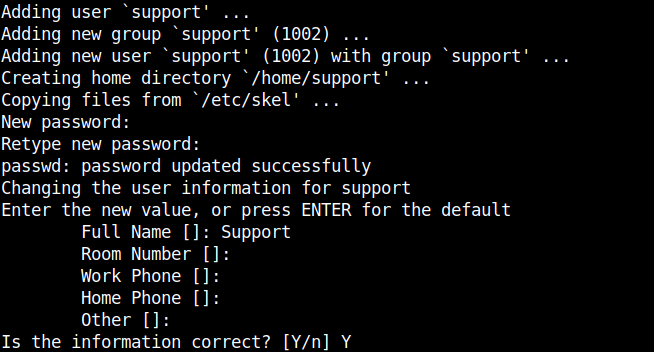
7. Create new local email user and test mail delivery and IMAP dovecot connectivity
Now as postfix and dovecot are running fine to have a functional email to test SMTP delivery, we need create a new working email address, that means a simple local UNIX account with adduser / useradd *nix commands as usual.
adduser support
telnet localhost 25
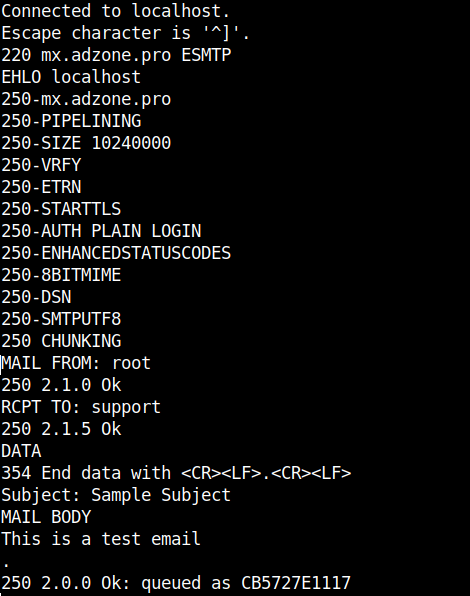
The commands sent after connection with Enters at the end of each line and delay of 1/2 secs are as so:
EHLO localhost
MAIL FROM: root
RCPT TO: support
DATA
Subject: Sample Subject
MAIL BODY
.
The last email in /home/support/Maildir/new/ should be the one we just sent.
cat /home/support/Maildir/new/$(ls -1 /home/support/Maildir/new/|tail -1)
Return-Path: <root@your-mail-domain.com>
X-Original-To: support
Delivered-To: support@your-mail-domain.com
Received: from localhost (localhost [127.0.0.1])
by mx.adzone.pro (Postfix) with ESMTP id CB5727E1117
for <support>; Fri, 4 Oct 2019 11:50:24 +0300 (EEST)
Subject: Sample Subject
Message-Id: <20191004085038.CB5727E1117@mail.your-mail-domain.com>
Date: Fri, 4 Oct 2019 11:50:24 +0300 (EEST)
From: root@your-mail-domain.com
MAIL BODY
This is a test email
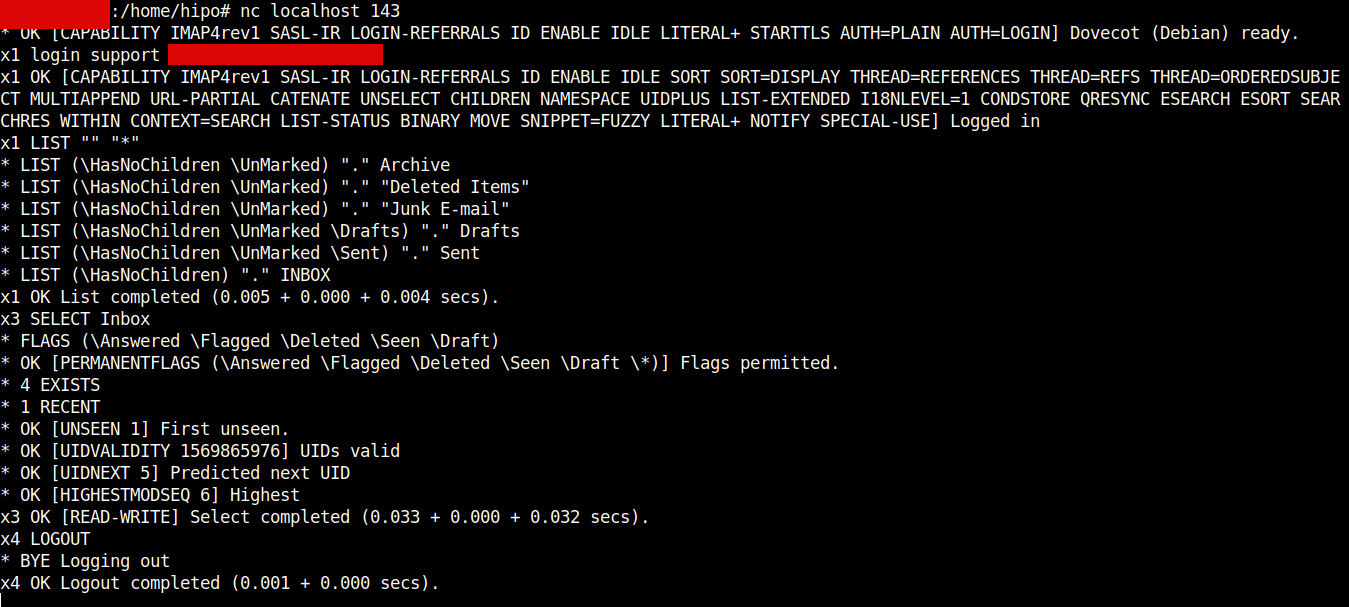
As you see mail delivered as expected, next step is to check we can properly login to IMAP server provided by dovecot.
Thunderbird / Outlook Express / Sylpheed and rest of IMAP protocol supporting clients could be emulated also with a simple netcat / telnet connection and few commands, below is how:
nc localhost 143
x1 LOGIN support user_password
x2 LIST "" "*"
x3 SELECT Inbox
x4 LOGOUT
8. Install and Configure RainLoop (PHP) WebMail
RainLoop is Simple, Modern and Fast Web-Based Email client, that supports IMAP over it can communicate to just tested Dovecot IMAP. The pros of RainLoop are the modest system requirements (no database backend required) and the mega simple installation and update.
RainLoop is written in PHP and uses Apache Webserver to serve content, as well has a dependency on few php modules, hence you have to install below .deb packs.
apt install –yes apache2 php7.0 libapache2-mod-php7.0 php7.0-curl php7.0-xml
Once above is installed and HTTP server is running on the backend the most simple way to install is to use the default Apache configured DocumentRoot directory which is /var/www/html to make the RainLoop a default opening Platform for the WebServer delete the default page /var/www/html/index.html, change directory to it and install via the PHP installer, e.g.
rm -f /var/www/html/index.html
cd /var/www/html
curl -sL https://repository.rainloop.net/installer.php | php
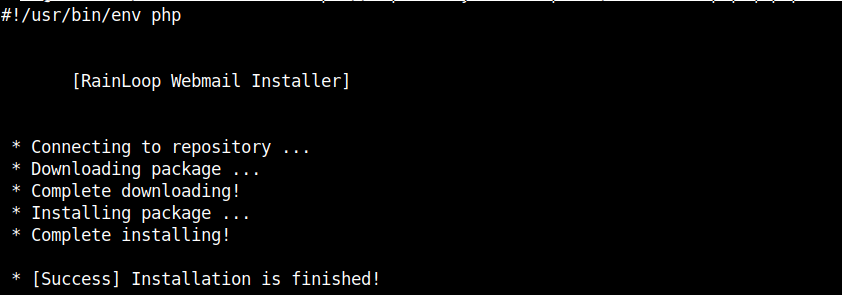
Once RainLoop Webmail Installer is completed to login to Admin use the Host or IP address URL in browser, where it is installed for example:
http://192.168.0.102/?admin
However it is much better to set the webmail to be living on a seperate domain VirtualHost URL address , i. e. (depending on the serving backend Webserver Apache / Nginx etc.) – you can use mail.your-mail-domain.com
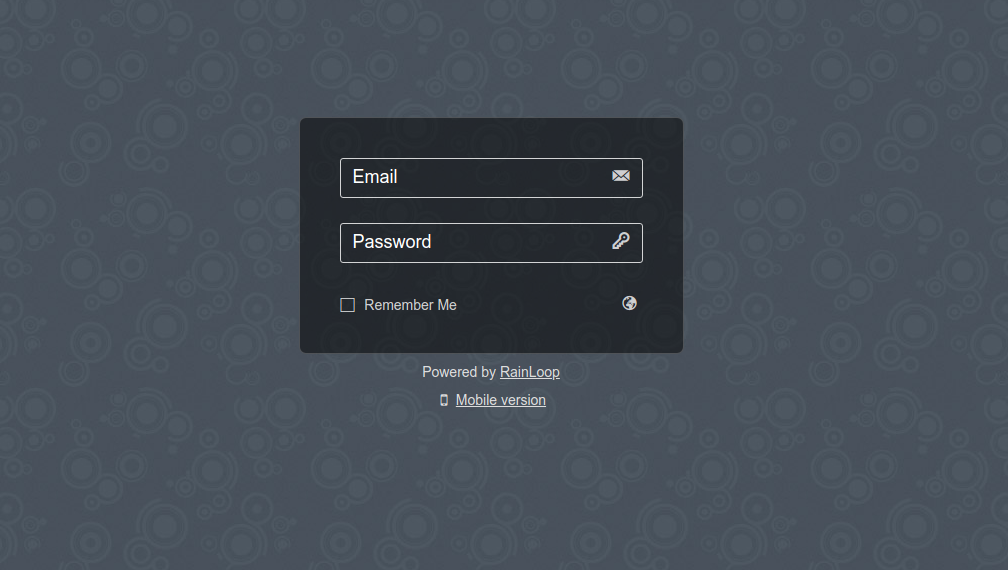
Default Rainloop user and pass to login is:
User: admin
Password: 12345
N.B. Please do not forget to change the default password to something more secure right after logging to prevent some malicious users to break in.
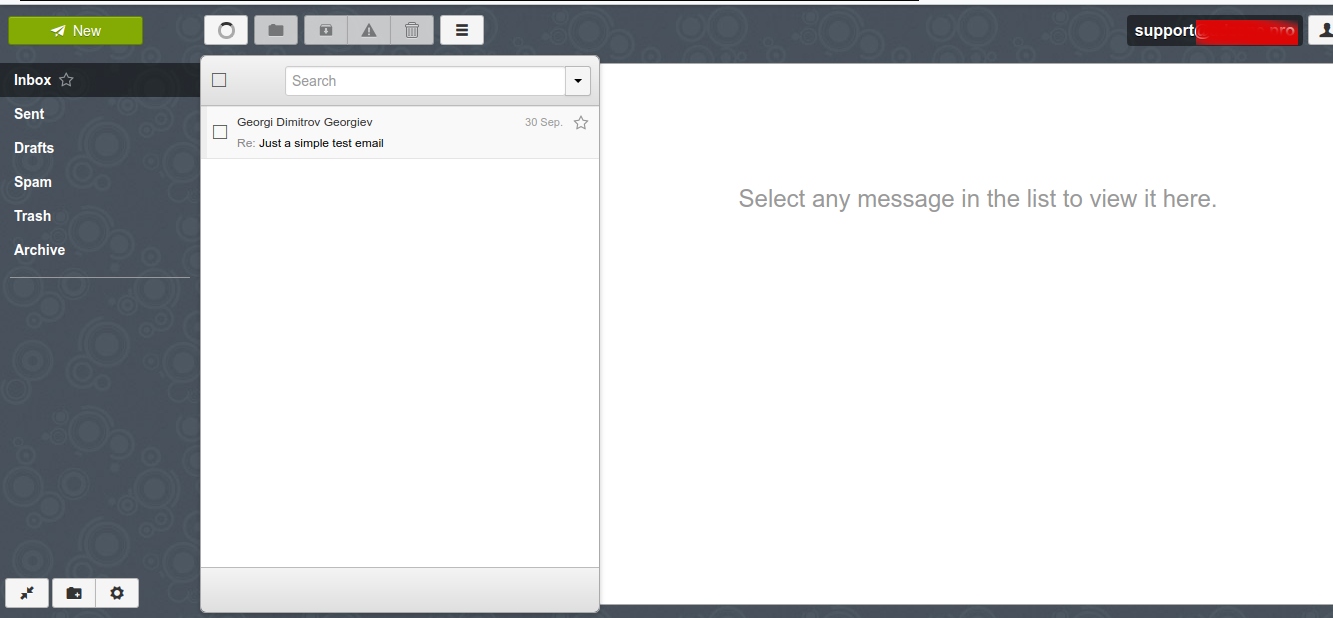
Here is also how Rainloop normal email Send / Receive interface looks like (simplistic and intuitive)
If you want to redirect all Email for a certain user lets say support to another local existing mail address lets say to marketing
echo "support: marketing" >> /etc/aliases
newaliases
The default alias binding in /etc/aliases is for postmaster to deliver all received mails to root mailbox, once added the new alias the newaliases command is used initializes ealias database.
Here is how /etc/aliases looks after above new alias is added
cat /etc/aliases
# See man 5 aliases for format
postmaster: root
support: marketing
What is left is to configure properly is the Domain name DNS records if you will be using an external VirtualHost subdomain that is to be done from your domain registrer (Godaddy, Domain.Com, NameCheap etc.).
We're done with our setup and you can now happily use your Webmail or favourite IMAP client to send / receive mails to recipients. Note that because mail accounts email is to be kept locally on the server as a plain text files it is crucial to secure at max SSH access to the server or even better disable /bin/sh login with usermod command for all used Email addresses.
Here is how to disable interactive SSH / SFTP login to the support local existing UNIX account.
usermod -s /bin/false support
To check the change you can use finger command (assuming you have it installed on the system if not install it with apt install finger)
finger support
Login: support Name: Support
Directory: /home/support Shell: /bin/false
Never logged in.
No mail.
No Plan.
That's all folks, our goal to have an independent (self-owned) Email server from scratch to better Email account privacy is fulfilled.
Now you can be at peace that your email correspondence with friends / relatives / customers will be at your hands only and you and only you will have a sorted view of your Mail stored passwords and personal data over the years.
Enjoy ! 🙂