To find out which programs are causing the most read/write overhead on a Linux server one can use iotop
Here is the description of iotop – simple top-like I/O monitor, taken from its manpage.
iotop does precisely the same as the classic linux top but for hard disk IN/OUT operations.
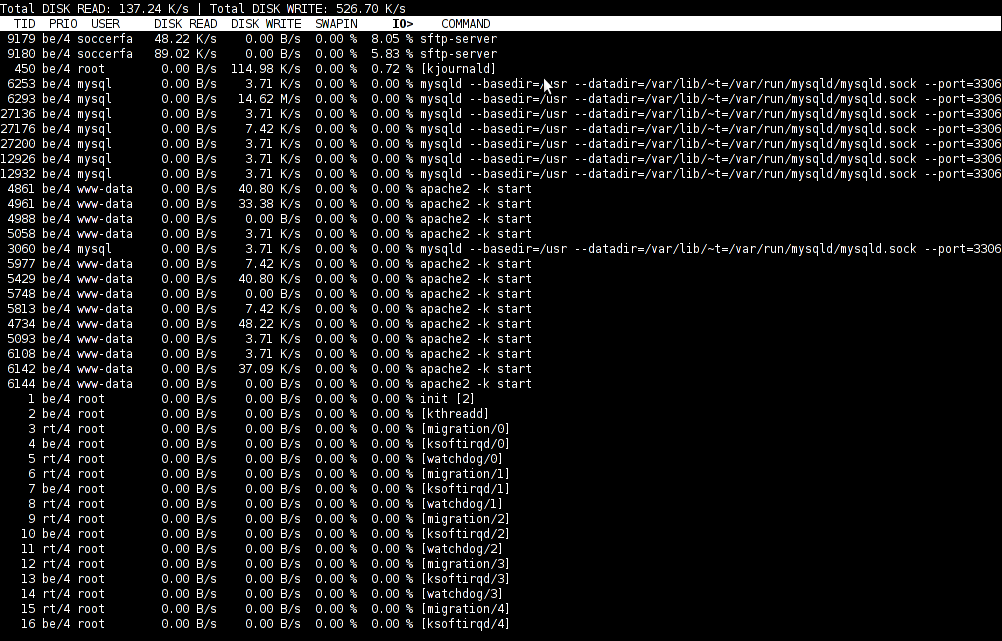
To check the overhead caused by some daemon on the system or some random processes launching iotop without any arguments is enough;
debian:~# iotop
The main overview of iostat statistics, are the:
Total DISK READ: xx.xx MB/s | Total DISK WRITE: xx.xx K/s
If launching iotop, shows a huge numbers and the server is facing performance drop downs, its a symptom for hdd i/o overheads.
iotop is available for Debian and Ubuntu as a standard package part of the distros repositories. On RHEL based Linuxes unfortunately, its not available as RPM.
While talking about keeping an eye on hard disk utilization and disk i/o’s as bottleneck and a possible pitfall to cause a server performance down, it’s worthy to mention about another really great tool, which I use on every single server I administrate. For all those unfamiliar I’m talking about dstat
dstat is a – versatile tool for generating system resource statistics as the description on top of the manual states. dstat is great for people who want to have iostat, vmstat and ifstat in one single program.
dstat is nowdays available on most Linux distributions ready to be installed from the respective distro package manager. I’ve used it and I can confirm tt is installable via a deb/rpm package on Fedora, CentOS, Debian and Ubuntu linuces.
Here is how the tool in action looks like:
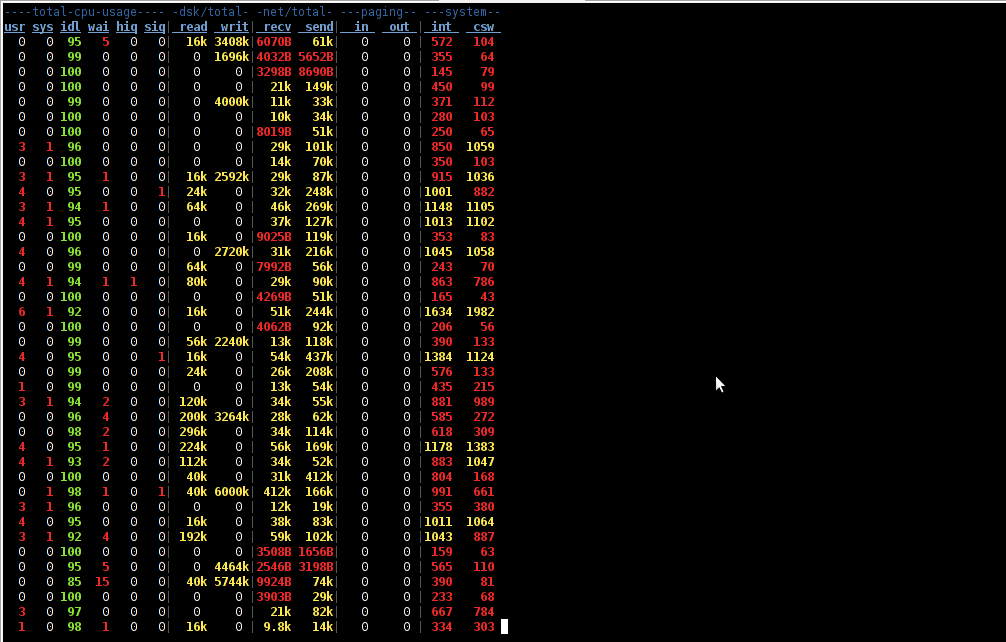
The most interesting things from all the dstat cmd output are read, writ and recv, send , they give a good general overview on hard drive performance and if tracked can reveal if the hdd disk/writes are a bottleneck to create server performance issues.
Another handy tool in tracking hdd i/o problems is iostat its a tool however more suitable for the hard core admins as the tool statistics output is not easily readable.
In case if you need to periodically grasp data about disks read/write operations you will definitely want to look at collectl i/o benchmarking tool .Unfortunately collect is not included as a packaget for most linux distributions except in Fedora. Besides its capabilities to report on servers disk usage, collect is also capable to show brief stats on cpu, network.
Collectl looks really promosing and even seems to be in active development the latest tool release is from May 2011. It even supports NVidia’s GPU monitoring 😉 In short what collectl does is very similar to sysstat which by the way also has some possibilities to track disk reads in time. collectl’s website praises the tool, much and says that in most machines the extra load the tool would add to a system to generate reports on cpu, disk and disk io is < 0.1%. I couldn’t find any data online on how much sysstat (sar) extra loads a system. It will be interesting if some of someone concluded some testing and can tell which of the two puts less load on a system.


More helpful Articles

Tags: action, bottleneck, CentOS, cmd, description, Disk, disk utilization, drive, drive performance, drop, eye, generating system, GNU, gnu linux, handy tool, interesting things, Linux, linux server, linux top, linuxes, manager, manual states, most linux distributions, overhead, package, performance drop, performance issues, pitfall, program, random processes, recv, repositories, resource statistics, server performance, sIf, system, system resource, tool, Ubuntu, versatile, versatile tool, vmstat


Mozilla/5.0 (Windows NT 6.0) AppleWebKit/535.2 (KHTML, like Gecko) Chrome/15.0.874.51 Safari/535.2
Glad you’re finding collectl useful – have you tried the collectl-utils yet? Adds plotting and cluster-wide ‘top’ functionality for anything collectl can collect. a few comments:
– collect is definitely in active development and current plans are to release a new version next week, the most noticeable addition being numa stats
-it is currently included in fedora and suse and is being added to the next release of debian. but you can also install the rpm on any system that support rpm, OR just go with the source tarball and run INSTALL.
– as for performance I can almost guarantee sar and systat are faster since they’re written in C and collectl is written in perl. My original plan was to write collectl in perl as a prototype but it’s so efficient that I don’t see any benefits in giving up the ease at which I can add additional capabilities to move to C or any other language
As I’ve said before sar and iostat (and many others) are fine tools but I find them limiting in a variety ways including inconsistencies in their data reporting with each other as well as completeness in what they report – I want a single tool so ALL data can be recorded within microseconds of each other so one can observe how the system as a whole is behaving, especially in response to a problem.
Another important thing is I’m on a mission to educate people to the harm in running sar at its default monitoring interval of 10 minutes. This is such a coarse measure as to be almost meaningless for diagnosing all but the most basic problems. Consider a 1 minute network spike on a moderately loaded network – you’ll never see it! Sar users: please lower your monitoring frequencies. A minute is far better than 10 but of course I’m a big advocate of collectl’s 10 second interval and there are a number of collectl users who choose even 5 or 1 second sampling rates. The more you collect the more you will see.
-mark
View CommentView CommentMozilla/5.0 (X11; U; Linux x86_64; en-us) AppleWebKit/531.2+ (KHTML, like Gecko) Version/5.0 Safari/531.2+ Debian/squeeze (2.30.6-1) Epiphany/2.30.6
Hi Mark,
I haven’t tried collectl-utils yet, I don’t see it as a package in my Debian it will be nice if it enters debian repos. I’ll have to take some time to install it from collectl’s site. I’m sick now and I’m not I don’t feel like testing anything. But really congrats, great job I liked your website a lot, also the concept behind collectl is great and I also like your writting style. Great that we have such a nice developers in the community.
I’ll hope to be seeing you around, I know some of posts are very trivial and probably won’t hold interest to you as my knowledge on Linux programming is not that profound as yours.
Again thanks for the info.
Wish a lot of success with collectl development!
Best!
View CommentView CommentGeorgi
Mozilla/5.0 (X11; Linux x86_64) AppleWebKit/536.5 (KHTML, like Gecko) Chrome/19.0.1084.56 Safari/536.5
The good news is it is now currently in the debian release process. The other good news, which may not be obvious, is it you just grab and untar the src.gz tarball, cd to the directory and type ./INSTALL, it will figure out it’s debian and do the right things. In fact, that’s the way the debian install package is built. 😉
View CommentView Comment-mark
Mozilla/5.0 (Windows; U; Windows NT 6.1; en-US; rv:1.9.2.3) Gecko/20100401 Firefox/3.6.3
good to know Mark, thx for info 🙂
View CommentView CommentMozilla/5.0 (Windows NT 6.0) AppleWebKit/535.2 (KHTML, like Gecko) Chrome/15.0.874.51 Safari/535.2
don’t get too hung up on having a kit that has been supplied as part of a distro – lots of great stuff is not part of any distro, like collectl-utils (and collectl before that). Just unpack the tarball into /tmp and run INSTALL. very simple script and if you’re nervous, just manually run the few copy commands it runs.
View CommentView Comment-mark