On Linux there is the hdparm tool for various hard disk benchmarking and extraction of hard disk operations info.
As the Linux manual states hdparm – get/set SATA/IDE device parameters
Most Linux users should already know it and might wonder if there is hdparm port or equivalent for FreeBSD, the aim of this short post is to shed some light on that.
The typical use of hdparm is like this:
linux:~# hdparm -t /dev/sda8
/dev/sda8:

Timing buffered disk reads: 76 MB in 3.03 seconds = 25.12 MB/sec

linux:~# hdparm -T /dev/sda8

/dev/sda8:

Timing cached reads: 1618 MB in 2.00 seconds = 809.49 MB/sec
The above output here is from my notebook Lenovo R61i.
If you're looking for alternative command to hdparm you should know in FreeBSD / OpenBSD / NetBSD, there is no exact hdparm equivalent command.
The somehow similar hdparm equivallent command for BSDs (FreeBSD etc.) is:
diskinfo
diskinfo is not so feature rich as linux's hdparm. It is just a simple command to show basic information for hard disk operations without no possibility to tune any hdd I/O and seek operations.
All diskinfo does is to show statistics for a hard drive seek times I/O overheads. The command takes only 3 arguments.
The most basic and classical use of the command is:
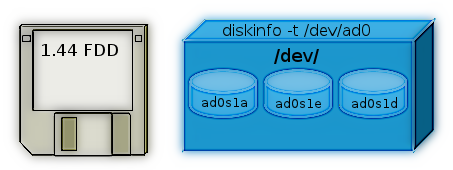
freebsd# diskinfo -t /dev/ad0s1a

/dev/ad0s1a

512 # sectorsize

20971520000 # mediasize in bytes (20G)

40960000 # mediasize in sectors

40634 # Cylinders according to firmware.

16 # Heads according to firmware.

63 # Sectors according to firmware.

ad:4JV48BXJs0s0 # Disk ident.
Seek times:

Full stroke: 250 iter in 3.272735 sec = 13.091 msec

Half stroke: 250 iter in 3.507849 sec = 14.031 msec

Quarter stroke: 500 iter in 9.705555 sec = 19.411 msec

Short forward: 400 iter in 2.605652 sec = 6.514 msec

Short backward: 400 iter in 4.333490 sec = 10.834 msec

Seq outer: 2048 iter in 1.150611 sec = 0.562 msec

Seq inner: 2048 iter in 0.215104 sec = 0.105 msec
Transfer rates:

outside: 102400 kbytes in 3.056943 sec = 33498 kbytes/sec

middle: 102400 kbytes in 2.696326 sec = 37978 kbytes/sec

inside: 102400 kbytes in 3.178711 sec = 32214 kbytes/sec
Another common use of diskinfo is to measure hdd I/O command overheads with -c argument:
freebsd# diskinfo -c /dev/ad0s1e
/dev/ad0s1e
512 # sectorsize
39112312320 # mediasize in bytes (36G)
76391235 # mediasize in sectors
75784 # Cylinders according to firmware.
16 # Heads according to firmware.
63 # Sectors according to firmware.
ad:4JV48BXJs0s4 # Disk ident.
I/O command overhead:

time to read 10MB block 1.828021 sec = 0.089 msec/sector

time to read 20480 sectors 4.435214 sec = 0.217 msec/sector

calculated command overhead = 0.127 msec/sector
Above diskinfo output is from my FreeBSD home router.
As you can see, the time to read 10MB block on my hard drive is 1.828021 (which is very high number),
this is a sign the hard disk experience too many read/writes and therefore needs to be shortly replaced with newer faster one.
diskinfo is part of the basis bsd install (bsd world). So it can be used without installing any bsd ports or binary packages.
For the purpose of stress testing hdd, or just some more detailed benchmarking on FreeBSD there are plenty of other tools as well.
Just to name a few:
- rawio – obsolete in FreeBSD 7.x version branch (not available in BSD 7.2 and higher)
- iozone, iozone21 – Tools to test the speed of sequential I/O to files
- bonnie++ – benchmark tool capable of performing number of simple fs tests
- bonnie – predecessor filesystem benchmark tool to bonnie++
- raidtest – test performance of storage devices
- mdtest – Software to test metadata performance on filsystems
- filebench – tool for micro-benchmarking storage subsystems
Linux hdparm allows also changing / setting various hdd ATA and SATA settings. Similarly, to set and change ATA / SATA settings on FreeBSD there is the:
- ataidle
tool.
As of time of writting ataidle is in port path /usr/ports/sysutils/ataidle/
To check it out install it as usual from the port location:
FreeBSD also has also the spindown port – a small program for handling automated spinning down ofSCSI harddrive
spindown is useful in setting values to SATA drives which has problems with properly controlling HDD power management.
To keep constant track on hard disk operations and preliminary warning in case of failing hard disks on FreeBSD there is also smartd service, just like in Linux.
smartd enables you to to control and monitor storage systems using the Self-Monitoring, Analysisand Reporting Technology System (S.M.A.R.T.) built into most modern ATA and SCSI hard disks.
smartd and smartctl are installable via the port /usr/ports/sysutils/smartmontools.
To install and use smartd, ataidle and spindown run:
freebsd# cd /usr/ports/sysutils/smartmontools

freebsd# make && make install clean

freebsd# cd /usr/ports/sysutils/ataidle/

freebsd# make && make install clean

freebsd# cd /usr/ports/sysutils/spindown/

freebsd# make && make install clean
Check each one's manual for more info.


