Posts Tagged ‘linux server’

Fix Out of inodes on Postfix Linux Mail Cluster. How to clean up filesystem running out of Inodes, Filesystem inodes on partition is 100% full

Wednesday, August 25th, 2021

Inode_Entry_inode-table-content

Recently we have faced a strange issue with with one of our Clustered Postfix Mail servers (the cluster is with 2 nodes that each has configured Postfix daemon mail servers (running on an OpenVZ virtualized environment).
A heartbeat that checks liveability of clusters and switches nodes in case of one of the two gets broken due to some reason), pretty much a standard SMTP cluster.

So far so good but since the cluster is a kind of abondoned and is pretty much legacy nowadays and used just for some Monitoring emails from different scripts and systems on servers, it was not really checked thoroughfully for years and logically out of sudden the alarming email content sent via the cluster stopped working.

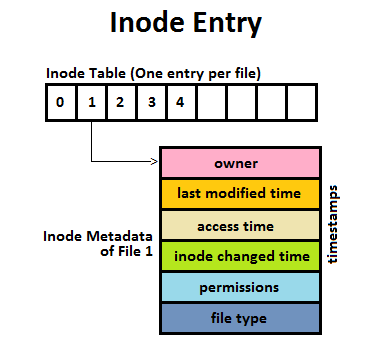
The normal sysadmin job here  was to analyze what is going on with the cluster and fix it ASAP. After some very basic analyzing we catched the problem is caused by a  "inodes full" (100% of available inodes were occupied) problem, e.g. file system run out of inodes on both machines perhaps due to a pengine heartbeat process  bug  leading to producing a high number of .bz2 pengine recovery archive files stored in /var/lib/pengine>

Below are the few steps taken to analyze and fix the problem.
 

1. Finding out about the the system run out of inodes problem


After logging on to system and not finding something immediately is wrong with inodes, all I can see from crm_mon is cluster was broken.
A plenty of emails were left inside the postfix mail queue visible with a standard command

[root@smtp1: ~ ]# postqueue -p

It took me a while to find ot the problem is with inodes because a simple df -h  was showing systems have enough space but still cluster quorum was not complete.
A bit of further investigation led me to a  simple df -i reporting the number of inodes on the local filesystems on both our SMTP1 and SMTP2 got all occupied.

[root@smtp1: ~ ]# df -i
Filesystem            Inodes   IUsed   IFree IUse% Mounted on
/dev/simfs            500000   500000  0   100% /
none                   65536      61   65475    1% /dev

As you can see the number of inodes on the Virual Machine are unfortunately depleted

Next step was to check directories occupying most inodes, as this is the place from where files could be temporary moved to a remote server filesystem or moved to another partition with space on a server locally attached drives.
Below command gives an ordered list with directories locally under the mail root filesystem / and its respective occupied number files / inodes,
the more files under a directory the more inodes are being occupied by the files on the filesystem.


run-out-if-inodes-what-is-inode-find-out-which-filesystem-or-directory-eating-up-all-your-system-inodes-linux_inode_diagram.gif
1.1 Getting which directory consumes most of the inodes on the systems


[root@smtp1: ~ ]# { find / -xdev -printf '%h\n' | sort | uniq -c | sort -k 1 -n; } 2>/dev/null
….
…..

…….
    586 /usr/lib64/python2.4
    664 /usr/lib64
    671 /usr/share/man/man8
    860 /usr/bin
   1006 /usr/share/man/man1
   1124 /usr/share/man/man3p
   1246 /var/lib/Pegasus/prev_repository_2009-03-10-1236698426.308128000.rpmsave/root#cimv2/classes
   1246 /var/lib/Pegasus/prev_repository_2009-05-18-1242636104.524113000.rpmsave/root#cimv2/classes
   1246 /var/lib/Pegasus/prev_repository_2009-11-06-1257494054.380244000.rpmsave/root#cimv2/classes
   1246 /var/lib/Pegasus/prev_repository_2010-08-04-1280907760.750543000.rpmsave/root#cimv2/classes
   1381 /var/lib/Pegasus/prev_repository_2010-11-15-1289811714.398469000.rpmsave/root#cimv2/classes
   1381 /var/lib/Pegasus/prev_repository_2012-03-19-1332151633.572875000.rpmsave/root#cimv2/classes
   1398 /var/lib/Pegasus/repository/root#cimv2/classes
   1696 /usr/share/man/man3
   400816 /var/lib/pengine

Note, the above command orders the files from bottom to top order and obviosuly the bottleneck directory that is over-eating Filesystem inodes with an exceeding amount of files is
/var/lib/pengine
 

2. Backup old multitude of files just in case of something goes wrong with the cluster after some files are wiped out


The next logical step of course is to check what is going on inside /var/lib/pengine just to find a very ,very large amount of pe-input-*NUMBER*.bz2 files were suddenly produced.


[root@smtp1: ~ ]# ls -1 pe-input*.bz2 | wc -l
 400816


The files are produced by the pengine process which is one of the processes that is controlling the heartbeat cluster state, presumably it is done by running process:

[root@smtp1: ~ ]# ps -ef|grep -i pengine
24        5649  5521  0 Aug10 ?        00:00:26 /usr/lib64/heartbeat/pengine


Hence in order to fix the issue, to prevent some inconsistencies in the cluster due to the file deletion,  copied the whole directory to another mounted parition (you can mount it remotely with sshfs for example) or use a local one if you have one:

[root@smtp1: ~ ]# cp -rpf /var/lib/pengine /mnt/attached_storage


and proceeded to clean up some old multitde of files that are older than 2 years of times (720 days):


3. Clean  up /var/lib/pengine files that are older than two years with short loop and find command


First I made a list with all the files to be removed in external text file and quickly reviewed it by lessing it like so

[root@smtp1: ~ ]#  cd /var/lib/pengine
[root@smtp1: ~ ]# find . -type f -mtime +720|grep -v pe-error.last | grep -v pe-input.last |grep -v pe-warn.last -fprint /home/myuser/pengine_older_than_720days.txt
[root@smtp1: ~ ]# less /home/myuser/pengine_older_than_720days.txt


Once reviewing commands I've used below command to delete the files you can run below command do delete all older than 2 years that are different from pe-error.last / pe-input.last / pre-warn.last which might be needed for proper cluster operation.

[root@smtp1: ~ ]#  for i in $(find . -type f -mtime +720 -exec echo '{}' \;|grep -v pe-error.last | grep -v pe-input.last |grep -v pe-warn.last); do echo $i; done


Another approach to the situation is to simply review all the files inside /var/lib/pengine and delete files based on year of creation, for example to delete all files in /var/lib/pengine from 2010, you can run something like:
 

[root@smtp1: ~ ]# for i in $(ls -al|grep -i ' 2010 ' | awk '{ print $9 }' |grep -v 'pe-warn.last'); do rm -f $i; done


4. Monitor real time inodes freeing

While doing the clerance of old unnecessery pengine heartbeat archives you can open another ssh console to the server and view how the inodes gets freed up with a command like:


# check if inodes is not being rapidly decreased

[root@csmtp1: ~ ]# watch 'df -i'


5. Restart basic Linux services producing pid files and logs etc. to make then workable (some services might not be notified the inodes on the Hard drive are freed up)

Because the hard drive on the system was full some services started to misbehaving and /var/log logging was impacted so I had to also restart them in our case this is the heartbeat itself
that  checks clusters nodes availability as well as the logging daemon service rsyslog


# restart rsyslog and heartbeat services
[root@csmtp1: ~ ]# /etc/init.d/heartbeat restart
[root@csmtp1: ~ ]# /etc/init.d/rsyslog restart

The systems had been a data integrity legacy service samhain so I had to restart this service as well to reforce the /var/log/samhain log file to again continusly start writting data to HDD.

# Restart samhain service init script 
[root@csmtp1: ~ ]# /etc/init.d/samhain restart


6. Check up enough inodes are freed up with df

[root@smtp1 log]# df -i
Filesystem Inodes IUsed IFree IUse% Mounted on
/dev/simfs 500000 410531 19469 91% /
none 65536 61 65475 1% /dev


I had to repeat the same process on the second Postfix cluster node smtp2, and after all the steps like below check the status of smtp2 node and the postfix queue, following same procedure made the second smtp2 cluster member as expected 🙂


7. Check the cluster node quorum is complete, e.g. postfix cluster is operating normally


# Test if email cluster is ok with pacemaker resource cluster manager – lt-crm_mon
 

[root@csmtp1: ~ ]# crm_mon -1
============
Last updated: Tue Aug 10 18:10:48 2021
Stack: Heartbeat
Current DC: smtp2.fqdn.com (bfb3d029-89a8-41f6-a9f0-52d377cacd83) – partition with quorum
Version: 1.0.12-unknown
2 Nodes configured, unknown expected votes
4 Resources configured.
============

Online: [ smtp2.fqdn.com smtp1.fqdn.com ]

failover-ip (ocf::heartbeat:IPaddr2): Started csmtp1.ikossvan.de
Clone Set: postfix_clone
Started: [ smtp2.fqdn.com smtp1fqdn.com ]
Clone Set: pingd_clone
Started: [ smtp2.fqdn.com smtp1.fqdn.com ]
Clone Set: mailto_clone
Started: [ smtp2.fqdn.com smtp1.fqdn.com ]


8.  Force resend a few hundred thousands of emails left in the email queue


After some inodes gets freed up due to the file deletion, i've reforced a couple of times the queued mail servers to be immediately resent to remote mail destinations with cmd:


# force emails in queue to be resend with postfix

[root@smtp1: ~ ]# sendmail -q


– It was useful to watch in real time how the queued emails are quickly decreased (queued mails are successfully sent to destination addresses) with:


# Monitor  the decereasing size of the email queue
[root@smtp1: ~ ]# watch 'postqueue -p|grep -i '@'|wc -l'

Fix Apache [error] [client xx.xxx.xxx.xx] PHP Warning: Unknown: Input variables exceeded 1000. To increase the limit change max_input_vars in php.ini. in Unknown on line 0

Wednesday, August 14th, 2013

I have a busy Linux server with 24 cores each running on ..4 Ghz. Server is configured to server  Apache and MySQL queries and a dozen of high traffic websites are hosted on it. Until just recently server worked fine and since about few days I started getting SMS notifications that server is inaccessible few times a day. To check what's wrong I checked in /var/log/apache2/error.log  and there I found  following error:

[error] [client 95.107.233.2] PHP Warning:  Unknown: Input variables exceeded 1000.

To increase the limit change max_input_vars in php.ini. in Unknown on line 0 referer: http://www.site-domain-name.com/predict/2013-08-10
 

Before I check Apache error.log, I had a guess that ServerLimit of 256 (spawned servers max) is reached so solution would be raise of ServerLimit to more than MaxClients setting defined in /etc/apache2/apache2.conf. After checking /var/log/apache2/error.log I've realized problem is because the many websites hosted on server exceed maximum defined variables possible to assign by libphp in php.ini. maximum possible defined variables before PHP stops servering is set through max_input_vars variable

As I'm running a Debian Squeeze Linux server, here is what is set as default for max_input_vars in /etc/php5/apache2/php.ini:

; How many GET/POST/COOKIE input variables may be accepted
; max_input_vars = 1000

So to fix it in php.ini just raised a bit setting to 1500, i.e.:

max_input_vars = 1500

Though I hit the error on Debian I assume same error occurs on Redhat RPM based (Fedora, CentOS, RHEL Linux) servers.
Hence I assume

max_input_vars = 1500

or higher should fix on those servers too. Looking forward to hear if same error is hit on RedHats.

Enjoy 🙂
 

Monitoring MySQL server queries and debunning performance (slow query) issues with native MySQL commands and with mtop, mytop

Thursday, May 10th, 2012

If you're a Linux server administrator running MySQL server, you need to troubleshoot performance and bottleneck issues with the SQL database every now and then. In this article, I will pinpoint few methods to debug basic issues with MySQL database servers.

1. Troubleshooting MySQL database queries with native SQL commands

a)One way to debug errors and get general statistics is by logging in with mysql cli and check the mysql server status:

# mysql -u root -p
mysql> SHOW STATUS;
+-----------------------------------+------------+
| Variable_name | Value |
+-----------------------------------+------------+
| Aborted_clients | 1132 |
| Aborted_connects | 58 |
| Binlog_cache_disk_use | 185 |
| Binlog_cache_use | 2542 |
| Bytes_received | 115 |
.....
.....
| Com_xa_start | 0 |
| Compression | OFF |
| Connections | 150000 |
| Created_tmp_disk_tables | 0 |
| Created_tmp_files | 221 |
| Created_tmp_tables | 1 |
| Delayed_errors | 0 |
| Delayed_insert_threads | 0 |
| Delayed_writes | 0 |
| Flush_commands | 1 |
.....
.....
| Handler_write | 132 |
| Innodb_page_size | 16384 |
| Innodb_pages_created | 6204 |
| Innodb_pages_read | 8859 |
| Innodb_pages_written | 21931 |
.....
.....
| Slave_running | OFF |
| Slow_launch_threads | 0 |
| Slow_queries | 0 |
| Sort_merge_passes | 0 |
| Sort_range | 0 |
| Sort_rows | 0 |
| Sort_scan | 0 |
| Table_locks_immediate | 4065218 |
| Table_locks_waited | 196 |
| Tc_log_max_pages_used | 0 |
| Tc_log_page_size | 0 |
| Tc_log_page_waits | 0 |
| Threads_cached | 51 |
| Threads_connected | 1 |
| Threads_created | 52 |
| Threads_running | 1 |
| Uptime | 334856 |
+-----------------------------------+------------+
225 rows in set (0.00 sec)

SHOW STATUS; command gives plenty of useful info, however it is not showing the exact list of queries currently processed by the SQL server. Therefore sometimes it is exactly a stucked (slow queries) execution, you need to debug in order to fix a lagging SQL. One way to track this slow queries is via enabling mysql slow-query.log. Anyways enabling the slow-query requires a MySQL server restart and some critical productive database servers are not so easy to restart and the SQL slow queries have to be tracked "on the fly" so to say.
Therefore, to check the exact (slow) queries processed by the SQL server (without restarting it), do
 

mysql> SHOW processlist;
+——+——+—————+——+———+——+————–+——————————————————————————————————+
| Id | User | Host | db | Command | Time | State | Info |
+——+——+—————+——+———+——+————–+——————————————————————————————————+
| 609 | root | localhost | blog | Sleep | 5 | | NULL |
| 1258 | root | localhost | NULL | Sleep | 85 | | NULL |
| 1308 | root | localhost | NULL | Query | 0 | NULL | show processlist |
| 1310 | blog | pcfreak:64033 | blog | Query | 0 | Sending data | SELECT comment_author, comment_author_url, comment_content, comment_post_ID, comment_ID, comment_aut |
+——+——+—————+——+———+——+————–+——————————————————————————————————+
4 rows in set (0.00 sec)
mysql>

SHOW processlist gives a good view on what is happening inside the SQL.

To get more complete information on SQL query threads use the full extra option:

mysql> SHOW full processlist;

This gives pretty full info on running threads, but unfortunately it is annoying to re-run the command again and again – constantly to press UP Arrow + Enter keys.

Hence it is useful to get the same command output, refresh periodically every few seconds. This is possible by running it through the watch command:

debian:~# watch "'show processlist' | mysql -u root -p'secret_password'"

watch will run SHOW processlist every 2 secs (this is default watch refresh time, for other timing use watch -n 1, watch -n 10 etc. etc.

The produced output will be similar to:

Every 2.0s: echo 'show processlist' | mysql -u root -p'secret_password' Thu May 10 17:24:19 2012

Id User Host db Command Time State Info
609 root localhost blog Sleep 3 NULL1258 root localhost NULL Sleep 649 NULL1542 blog pcfreak:64981 blog Query 0 Copying to tmp table \
SELECT p.ID, p.post_title, p.post_content,p.post_excerpt, p.pos
t_date, p.comment_count, count(t_r.o
1543 root localhost NULL Query 0 NULL show processlist

Though this "hack" is one of the possible ways to get some interactivity on what is happening inside SQL server databases and tables table. for administering hundred or thousand SQL servers running dozens of queries per second – monitor their behaviour few times aday using mytop or mtop is times easier.

Though, the names of the two tools are quite similar and I used to think both tools are one and the same, actually they're not but both are suitable for monitoring sql database execution in real time.

As a sys admin, I've used mytop and mtop, on almost each Linux server with MySQL server installed.
Both tools has helped me many times in debugging oddities with sql servers. Therefore my personal view is mytop and mtop should be along with the Linux sysadmin most useful command tools outfit, still I'm sure many administrators still haven't heard about this nice goodies.

1. Installing mytop on Debian, Ubuntu and other deb based GNU / Linux-es

mytop is available for easy install on Debian and across all debian / ubuntu and deb derivative distributions via apt.

Here is info obtained with apt-cache show

debian:~# apt-cache show mytop|grep -i description -A 3
Description: top like query monitor for MySQL
Mytop is a console-based tool for monitoring queries and the performance
of MySQL. It supports version 3.22.x, 3.23.x, 4.x and 5.x servers.
It's written in Perl and support connections using TCP/IP and UNIX sockets.

Installing the tool is done with the trivial:

debian:~# apt-get --yes install mytop
....

mtop used to be available for apt-get-ting in Debian Lenny and prior Debian releases but in Squeeze onwards, only mytop is included (probably due to some licensing incompitabilities with mtop??).

For those curious on how mtop / mytop works – both are perl scripts written to periodically connects to the SQL server and run commands similar to SHOW FULL PROCESSLIST;. Then, the output is parsed and displayed to the user.

Here how mytop running, looks like:

MyTOP showing queries running on Ubuntu 8.04 Linux - Debugging interactively top like MySQL

2. Installing mytop on RHEL and CentOS

By default in RHEL and CentOS and probably other RedHat based Linux-es, there is neither mtop nor mytop available in package repositories. Hence installing the tools on those is only available from 3rd parties. As of time of writting an rpm builds for RHEL and CentOS, as well as (universal rpm distros) src.rpm package is available on http://pkgs.repoforge.org/mytop/. For the sake of preservation – if in future those RPMs disappear, I made a mirror of mytop rpm's here

Mytop rpm builds depend on a package perl(Term::ReadKey), my attempt to install it on CentOS 5.6, returned following err:

[root@cenots ~]# rpm -ivh mytop-1.4-2.el5.rf.noarch.rpm
warning: mytop-1.4-2.el5.rf.noarch.rpm: Header V3 DSA signature: NOKEY, key ID 6b8d79e6
error: Failed dependencies:
perl(Term::ReadKey) is needed by mytop-1.4-2.el5.rf.noarch

The perl(Term::ReadKey package is not available in CentOS 5.6 and (probably other centos releases default repositories so I had to google perl(Term::ReadKey) I found it on http://rpm.pbone.net/ package repository, the exact url to the rpm dependency as of time of writting this post is:

ftp://ftp.pbone.net/mirror/yum.trixbox.org/centos/5/old/perl-Term-ReadKey-2.30-2.rf.i386.rpm

Quickest, way to install it is:

[root@centos ~]# rpm -ivh ftp://ftp.pbone.net/mirror/yum.trixbox.org/centos/5/old/perl-Term-ReadKey-2.30-2.rf.i386.rpmRetrieving ftp://ftp.pbone.net/mirror/yum.trixbox.org/centos/5/old/perl-Term-ReadKey-2.30-2.rf.i386.rpmPreparing... ########################################### [100%]
1:perl-Term-ReadKey ########################################### [100%]

This time mytop, install went fine:

[root@centos ~]# rpm -ivh mytop-1.4-2.el5.rf.noarch.rpm
warning: mytop-1.4-2.el5.rf.noarch.rpm: Header V3 DSA signature: NOKEY, key ID 6b8d79e6
Preparing... ########################################### [100%]
1:mytop ########################################### [100%]

To use it further, it is the usual syntax:

mytop -u username -p 'secret_password' -d database

CentOS Linux MyTOP MySQL query benchmark screenshot - vpopmail query

3. Installing mytop and mtop on FreeBSD and other BSDs

To debug the running SQL queries in a MySQL server running on FreeBSD, one could use both mytop and mtop – both are installable via ports:

a) To install mtop exec:

freebsd# cd /usr/ports/sysutils/mtop
freebsd# make install clean
....

b) To install mytop exec:

freebsd# cd /usr/ports/databases/mytop
freebsd# make install clean
....

I personally prefer to use mtop on FreeBSD, because once run it runs prompts the user to interactively type in the user/pass

freebsd# mtop

Then mtop prompts the user with "interactive" dialog screen to type in user and pass:

Mtop interactive type in username and password screenshot on FreeBSD 7.2

It is pretty annoying, same mtop like syntax don't show user/pass prompt:

freebsd# mytop
Cannot connect to MySQL server. Please check the:

* database you specified "test" (default is "test")
* username you specified "root" (default is "root")
* password you specified "" (default is "")
* hostname you specified "localhost" (default is "localhost")
* port you specified "3306" (default is 3306)
* socket you specified "" (default is "")
The options my be specified on the command-line or in a ~/.mytop
config file. See the manual (perldoc mytop) for details.
Here's the exact error from DBI. It might help you debug:
Unknown database 'test'

The correct syntax to run mytop instead is:

freebsd# mytop -u root -p 'secret_password' -d 'blog'

Or the longer more descriptive:

freebsd# mytop --user root --pass 'secret_password' --database 'blog'

By the way if you take a look at mytop's manual you will notice a tiny error in documentation, where the three options –user, –pass and –database are wrongly said to be used as -user, -pass, -database:

freebsd# mytop -user root -pass 'secret_password' -database 'blog'
Cannot connect to MySQL server. Please check the:

* database you specified "atabase" (default is "test")
* username you specified "ser" (default is "root")
* password you specified "ass" (default is "")
* hostname you specified "localhost" (default is "localhost")
* port you specified "3306" (default is 3306)
* socket you specified "" (default is "")a
...
Access denied for user 'ser'@'localhost' (using password: YES)

Actually it is interesting mytop, precededed historically mtop.
mtop was later written (probably based on mytop), to run on FreeBSD OS by a famous MySQL (IT) spec — Jeremy Zawodny .
Anyone who has to do frequent MySQL administration tasks, should already heard Zawodny's name.
For those who haven't, Jeremy used to be a head database administrators and developer in Yahoo! Inc. some few years ago.
His website contains plenty of interesting thoughts and writtings on MySQL server and database management
 

How to quickly check unread Gmail emails on GNU / Linux – one liner script

Monday, April 2nd, 2012

I've hit an interesting article explaining how to check unread gmail email messages in Linux terminal. The original article is here

Being able to read your latest gmail emails in terminal/console is great thing, especially for console geeks like me.
Here is the one liner script:

curl -u GMAIL-USERNAME@gmail.com:SECRET-PASSWORD \
--silent "https://mail.google.com/mail/feed/atom" | tr -d '\n' \
| awk -F '' '{for (i=2; i<=NF; i++) {print $i}}' \
| sed -n "s/

Linux Users Group M. – [7] discussions, [10] comments and [2] jobs on LinkedIn
Twitter – Lynn Serafinn (@LynnSerafinn) has sent you a direct message on Twitter!
Facebook – Sys, you have notifications pending
Twitter – Email Marketing (@optinlists) is now following you on Twitter!
Twitter – Lynn Serafinn (@LynnSerafinn) is now following you on Twitter!
NutshellMail – 32 New Messages for Sat 3/31 12:00 PM
Linux Users Group M. – [10] discussions, [5] comments and [8] jobs on LinkedIn
eBay – Deals up to 60% OFF + A Sweepstakes!
LinkedIn Today – Top news today: The Magic of Doing One Thing at a Time
NutshellMail – 29 New Messages for Fri 3/30 12:00 PM
Linux Users Group M. – [16] discussions, [8] comments and [8] jobs on LinkedIn
Ervan Faizal Rizki . – Join my network on LinkedIn
Twitter – LEXO (@LEXOmx) retweeted one of your Tweets!
NutshellMail – 24 New Messages for Thu 3/29 12:00 PM
Facebook – Your Weekly Facebook Page Update
Linux Users Group M. – [11] discussions, [9] comments and [16] jobs on LinkedIn

As you see this one liner uses curl to fetch the information from mail.google.com's atom feed and then uses awk and sed to parse the returned content and make it suitable for display.

If you want to use the script every now and then on a Linux server or your Linux desktop you can download the above code in a script file -quick_gmail_new_mail_check.sh here

Here is a screenshot of script's returned output:

Quick Gmail New Mail Check bash script screenshot

A good use of a modified version of the script is in conjunction with a 15 minutes cron job to launch for new gmail mails and launch your favourite desktop mail client.
This method is useful if you don't want a constant hanging Thunderbird or Evolution, pop3 / imap client on your system to just take up memory or dangle down the window list.
I've done a little modification to the script to simply, launch a predefined email reader program, if gmail atom feed returns new unread mails are available, check or download my check_gmail_unread_mail.sh here
Bear in mind, on occasions of errors with incorrect username or password, the script will not return any errors. The script is missing a properer error handling.Therefore, before you use the script make sure:

gmail_username='YOUR-USERNAME';
gmail_password='YOUR-PASSWORD';

are 100% correct.

To launch the script on 15 minutes cronjob, put it somewhere and place a cron in (non-root) user:

# crontab -u root -e
...
*/15 * * * * /path/to/check_gmail_unread_mail.sh

Once you read your new emails in lets say Thunderbird, close it and on the next delivered unread gmail mails, your mail client will pop up by itself again. Once the mail client is closed the script execution will be terminated.
Consised that if you get too frequently gmail emails, using the script might be annoying as every 15 minutes your mail client will be re-opened.

If you use any of the shell scripts, make sure there are well secured (make it owned only by you). The gmail username and pass are in plain text, so someone can steal your password, very easily. For a one user Linux desktops systems as my case, security is not such a big concern, putting my user only readable script permissions (e.g. chmod 0700)is enough.

How to find out all programs bandwidth use with (nethogs) top like utility on Linux

Friday, September 30th, 2011

Just run across across a super nice top like, program for system administrators, its called nethogs and is definitely entering my “l337” admin outfit next to tools like iftop, nettop, ettercap, darkstat htop, iotop etc.

nethogs is ultra easy to use, to get immediately in console statistics about running processes UPLOAD and DOWNLOAD bandwidth consumption just run it:

linux:~# nethogs

Nethogs screenshot on Linux Server with Nginx
Nethogs running on Debian GNU/Linux serving static web content with Nginx

If you need to check what program is using what amount of network bandwidth, you will definitely love this tool. Having information of bandwidth consumption is also viewable partially with iftop, however iftop is unable to track the bandwidth consumption to each process using the network thus it seems nethogs is unique at what it does.

Nethogs supports IPv4 and IPv6 as well as supports network traffic over ppp. The tool is available via package repositories for Debian GNU/Lenny 5 and Debian Squeeze 6.

To install Nethogs on CentOS and Fedora distributions, you will have to install it from source. On CentOS 5.7, latest nethogs which as of time of writting this article is 0.8.0 compiles and installs fine with make && make install commands.

In the manner of thoughts of network bandwidth monitoring, another very handy tool to add extra understanding on what kind of traffic is crossing over a Linux server is jnettop
jnettop shows which hosts/ports is taking up the most network traffic.
It is available for install via apt in Debian 5/6).

Here is a screenshot on jnettop in action:

Jnettop check network traffic in console

To install jnettop on latest Fedoras / CentOS / Slackware Linux it has to be download and compiled from source via jnettop’s official wiki page
I’ve tested jnettop install from source on CentOS release 5.7 and it seems to compile just fine using the usual compile commands:

[root@prizebg jnettop-0.13.0]# ./configure
...
[root@prizebg jnettop-0.13.0]# make
...
[root@prizebg jnettop-0.13.0]# make install

If you need to have an idea on the network traffic passing by your Linux server distringuished by tcp/udp/icmp network protocols and services like ssh / ftp / apache, then you will definitely want to take a look at nettop (if of course not familiar with it yet).
Nettop is not provided as a deb package in Debian and Ubuntu, where it is included as rpm for CentOS and presumably Fedora?
Here is a screenshot on nettop network utility in action:

Nettop server traffic division by protocol screenshot
FreeBSD users should be happy to find out that jnettop and nettop are part of the ports tree and the two can be installed straight, however nethogs would not work on FreeBSD, I searched for a utility capable of what Nethogs can, but couldn’t find such.
It seems the only way on FreeBSD to track bandwidth back and from originating process is using a combination of iftop and sockstat utilities. Probably there are other tools which people use to track network traffic to the processes running on a hos and do general network monitoringt, if anyone knows some good tools, please share with me.

How to find out which processes are causing a hard disk I/O overhead in GNU/Linux

Wednesday, September 28th, 2011

iotop monitor hard disk io bottlenecks linux
To find out which programs are causing the most read/write overhead on a Linux server one can use iotop

Here is the description of iotop – simple top-like I/O monitor, taken from its manpage.

iotop does precisely the same as the classic linux top but for hard disk IN/OUT operations.

To check the overhead caused by some daemon on the system or some random processes launching iotop without any arguments is enough;

debian:~# iotop

The main overview of iostat statistics, are the:

Total DISK READ: xx.xx MB/s | Total DISK WRITE: xx.xx K/s
If launching iotop, shows a huge numbers and the server is facing performance drop downs, its a symptom for hdd i/o overheads.
iotop is available for Debian and Ubuntu as a standard package part of the distros repositories. On RHEL based Linuxes unfortunately, its not available as RPM.

While talking about keeping an eye on hard disk utilization and disk i/o’s as bottleneck and a possible pitfall to cause a server performance down, it’s worthy to mention about another really great tool, which I use on every single server I administrate. For all those unfamiliar I’m talking about dstat

dstat is a – versatile tool for generating system resource statistics as the description on top of the manual states. dstat is great for people who want to have iostat, vmstat and ifstat in one single program.
dstat is nowdays available on most Linux distributions ready to be installed from the respective distro package manager. I’ve used it and I can confirm tt is installable via a deb/rpm package on Fedora, CentOS, Debian and Ubuntu linuces.

Here is how the tool in action looks like:

dstat Linux hdd load stats screenshot

The most interesting things from all the dstat cmd output are read, writ and recv, send , they give a good general overview on hard drive performance and if tracked can reveal if the hdd disk/writes are a bottleneck to create server performance issues.
Another handy tool in tracking hdd i/o problems is iostat its a tool however more suitable for the hard core admins as the tool statistics output is not easily readable.

In case if you need to periodically grasp data about disks read/write operations you will definitely want to look at collectl i/o benchmarking tool .Unfortunately collect is not included as a packaget for most linux distributions except in Fedora. Besides its capabilities to report on servers disk usage, collect is also capable to show brief stats on cpu, network.

Collectl looks really promosing and even seems to be in active development the latest tool release is from May 2011. It even supports NVidia’s GPU monitoring 😉 In short what collectl does is very similar to sysstat which by the way also has some possibilities to track disk reads in time.  collectl’s website praises the tool, much and says that in most machines the extra load the tool would add to a system to generate reports on cpu, disk and disk io is < 0.1%.  I couldn’t find any data online on how much sysstat (sar) extra loads a system. It will be interesting if some of someone concluded some testing and can tell which of the two puts less load on a system.

How to make GRE tunnel iptables port redirect on Linux

Saturday, August 20th, 2011

I’ve recently had to build a Linux server with some other servers behind the router with NAT.
One of the hosts behind the Linux router was running a Window GRE encrypted tunnel service. Which had to be accessed with the Internet ip address of the server.
In order < б>to make the GRE tunnel accessible, a bit more than just adding a normal POSTROUTING DNAT rule and iptables FORWARD is necessery.

As far as I’ve read online, there is quite of a confusion on the topic of how to properly configure the GRE tunnel accessibility on Linux , thus in this very quick tiny tutorial I’ll explain how I did it.

1. Load the ip_nat_pptp and ip_conntrack_pptp kernel module

linux-router:~# modprobe ip_nat_pptp
linux-router:~# modprobe ip_conntrack_pptp

These two modules are an absolutely necessery to be loaded before the remote GRE tunnel is able to be properly accessed, I’ve seen many people complaining online that they can’t make the GRE tunnel to work and I suppose in many of the cases the reason not to be succeed is omitting to load this two kernel modules.

2. Make the ip_nat_pptp and ip_nat_pptp modules to load on system boot time

linux-router:~# echo 'ip_nat_pptp' >> /etc/modules
linux-router:~# echo 'ip_conntrack_pptp' >> /etc/modules

3. Insert necessery iptables PREROUTING rules to make the GRE tunnel traffic flow

linux-router:~# /sbin/iptables -A PREROUTING -d 111.222.223.224/32 -p tcp -m tcp --dport 1723 -j DNAT --to-destination 192.168.1.3:1723
linux-router:~# /sbin/iptables -A PREROUTING -p gre -j DNAT --to-destination 192.168.1.3

In the above example rules its necessery to substitute the 111.222.223.224 ip address withe the external internet (real IP) address of the router.

Also the IP address of 192.168.1.3 is the internal IP address of the host where the GRE host tunnel is located.

Next it’s necessery to;

4. Add iptables rule to forward tcp/ip traffic to the GRE tunnel

linux-router:~# /sbin/iptables -A FORWARD -p gre -j ACCEPT

Finally it’s necessery to make the above iptable rules to be permanent by saving the current firewall with iptables-save or add them inside the script which loads the iptables firewall host rules.
Another possible way is to add them from /etc/rc.local , though this kind of way is not recommended as rules would add only after succesful bootup after all the rest of init scripts and stuff in /etc/rc.local is loaded without errors.

Afterwards access to the GRE tunnel to the local IP 192.168.1.3 using the port 1723 and host IP 111.222.223.224 is possible.
Hope this is helpful. Cheers 😉

How to auto restart CentOS Linux server with software watchdog (softdog) to reduce server downtime

Wednesday, August 10th, 2011

How to auto restart centos with software watchdog daemon to mitigate server downtimes, watchdog linux artistic logo

I’m in charge of dozen of Linux servers these days and therefore am required to restart many of the servers with a support ticket (because many of the Data Centers where the servers are co-located does not have a web interface or IPKVM connected to the server for that purpose). Therefore the server restart requests in case of crash sometimes gets processed in few hours or in best case in at least half an hour.

I’m aware of the existence of Hardware Watchdog devices, which are capable to detect if a server is hanged and auto-restart it, however the servers I administrate does not have Hardware support for Watchdog timer.

Thanksfully there is a free software project called Watchdog which is easily configured and mitigates the terrible downtimes caused every now and then by a server crash and respective delays by tech support in Data Centers.

I’ve recently blogged on the topic of Debian Linux auto-restart in case of kernel panic , however now i had to conifgure watchdog on some dozen of CentOS Linux servers.

It appeared installation & configuration of Watchdog on CentOS is a piece of cake and comes to simply following few easy steps, which I’ll explain quickly in this post:

1. Install with yum watchdog to CentOS

[root@centos:/etc/init.d ]# yum install watchdog
...

2. Add to configuration a log file to log watchdog activities and location of the watchdog device

The quickest way to add this two is to use echo to append it in /etc/watchdog.conf:

[root@centos:/etc/init.d ]# echo 'file = /var/log/messages' >> /etc/watchdog.conf
echo 'watchdog-device = /dev/watchdog' >> /etc/watchdog.conf

3. Load the softdog kernel module to initialize the software watchdog via /dev/watchdog

[root@centos:/etc/init.d ]# /sbin/modprobe softdog

Initialization of softdog should be indicated by a line in dmesg kernel log like the one above:

[root@centos:/etc/init.d ]# dmesg |grep -i watchdog
Software Watchdog Timer: 0.07 initialized. soft_noboot=0 soft_margin=60 sec (nowayout= 0)

4. Include the softdog kernel module to load on CentOS boot up

This is necessery, because otherwise after reboot the softdog would not be auto initialized and without it being initialized, the watchdog daemon service could not function as it does automatically auto reboots the server if the /dev/watchdog disappears.

It’s better that the softdog module is not loaded via /etc/rc.local but the default CentOS methodology to load module from /etc/rc.module is used:

[root@centos:/etc/init.d ]# echo modprobe softdog >> /etc/rc.modules
[root@centos:/etc/init.d ]# chmod +x /etc/rc.modules

5. Start the watchdog daemon service

The succesful intialization of softdog in step 4, should have provided the system with /dev/watchdog, before proceeding with starting up the watchdog daemon it’s wise to first check if /dev/watchdog is existent on the system. Here is how:

[root@centos:/etc/init.d ]# ls -al /dev/watchdogcrw------- 1 root root 10, 130 Aug 10 14:03 /dev/watchdog

Being sure, that /dev/watchdog is there, I’ll start the watchdog service.

[root@centos:/etc/init.d ]# service watchdog restart
...

Very important note to make here is that you should never ever configure watchdog service to run on boot time with chkconfig. In other words the status from chkconfig for watchdog boot on all levels should be off like so:

[root@centos:/etc/init.d ]# chkconfig --list |grep -i watchdog
watchdog 0:off 1:off 2:off 3:off 4:off 5:off 6:off

Enabling the watchdog from the chkconfig will cause watchdog to automatically restart the system as it will probably start the watchdog daemon before the softdog module is initialized. As watchdog will be unable to read the /dev/watchdog it will though the system has hanged even though the system might be in a boot process. Therefore it will end up in an endless loops of reboots which can only be fixed in a linux single user mode!!! Once again BEWARE, never ever activate watchdog via chkconfig!

Next step to be absolutely sure that watchdog device is running it can be checked with normal ps command:

[root@centos:/etc/init.d ]# ps aux|grep -i watchdog
root@hosting1-fr [~]# ps axu|grep -i watch|grep -v greproot 18692 0.0 0.0 1816 1812 ? SNLs 14:03 0:00 /usr/sbin/watchdog
root 25225 0.0 0.0 0 0 ? ZN 17:25 0:00 [watchdog] <defunct>

You have probably noticed the defunct state of watchdog, consider that as absolutely normal, above output indicates that now watchdog is properly running on the host and waiting to auto reboot in case of sudden /dev/watchdog disappearance.

As a last step before, after being sure its initialized properly, it’s necessery to add watchdog to run on boot time via /etc/rc.local post init script, like so:

[root@centos:/etc/init.d ]# echo 'echo /sbin/service watchdog start' >> /etc/rc.local

Now enjoy, watchdog is up and running and will automatically restart the CentOS host 😉

How to test if imap and pop mail server service is working with Telnet cmd

Monday, August 8th, 2011

test-if-imap-pop3-is-working-with-telnet-command-logo-imap
I’ve recently built new mail qmail server with vpopmail to serve pop3 connectins and courierimap and courierimaps to take care for IMAP IMAPS.

I further used telnet to test if the Linux server pop3 service on (110) and imap on (143) worked fine, straight after the completed qmail install.
Here is how to test mail server with vpopmail listening for connections on pop3 port :

debian:~# telnet mail.mymailserver.com 110
Trying 111.222.333.444...
Connected to mail.mymailserver.com.
Escape character is '^]'.
+OK <2813.1312745988@mymailserver.com>
USER hipo@mymailserver.com
+OK
PASS here_goes_my_secret_pass
+OK
LIST
1 309783
2 64053
3 2119
4 64357
5 317893
RETR 1
My first mail content retrieved with RETR commandgoes here ....
quit
+OK
Connection closed by foreign host.

You see I have 5 messages in my mailbox, as you can see I used RETR command to check the content of my mail, this is handy as I can read my mails straight with telnet (if the mail is in plain text), of course it’s a bit more complicated if I have to read encrypted or html mail, though still its easy to write a tiny parser and pipe the content produced by telnet command to lynx or some other text based browser.

Now another sys admin handy tip is the use of telnet to check my mail servers IMAP servers is correctly operating.
Here is how:

debian:~# telnet mail.mymailserver.com 143
Trying 111.222.333.444...
Connected to localhost.
Escape character is '^]'.
* OK [CAPABILITY IMAP4rev1 UIDPLUS CHILDREN NAMESPACE THREAD=ORDEREDSUBJECT THREAD=REFERENCES SORT QUOTA IDLE ACL ACL2=UNION STARTTLS] Courier-IMAP ready. Copyright 1998-2010 Double Precision, Inc. See COPYING for distribution information.
01 LOGIN hipo@mymailserver.com here_goes_my_secret_pass
A OK LOGIN Ok.
02 LIST "" *
* LIST (Unmarked HasNoChildren) "." "INBOX"
02 OK LIST completed
03 SELECT INBOX
* FLAGS (Draft Answered Flagged Deleted Seen Recent)
* OK [PERMANENTFLAGS (* Draft Answered Flagged Deleted Seen)] Limited
* 5 EXISTS
* 5 RECENT
* OK [UIDVALIDITY 1312746907] Ok
* OK [MYRIGHTS "acdilrsw"] ACL
03 OK [READ-WRITE] Ok
04 STATUS INBOX (MESSAGES)
* STATUS "INBOX" (MESSAGES 5)
04 OK STATUS Completed.
05 FETCH 1 ALL
...
06 FETCH 1 BODY
...
07 FETCH 1 ENVELOPE
...
As you can see according to standard to send commands to IMAP server from console after a telnet connection you will have to always include a command line number like 01, 02, 03 .. etc.

Using such a line numbering is not obligitory and also letters like A, B, C could be use still line numbering with numbers is generally a good idea since it’s easier for reading on the screen.

Now line 02 shows you available mailboxes, line 03 SELECT INBOX selects the imap Inbox to be further operated with, 04 STATUS INBOX cmd displays status about current mailboxes in folder.
FETCH 1 ALL instructs the imap server to get list of all IMAP message headers. Next command in line 05 FETCH 1 BODY will display the message body of the first message in list.
The 07 FETCH 1 ENVELOPE will display the mail headers for the 1 message.

Few other IMAP commands which might be helpfun on connection are:

08 FETCH 1 FULL
09 FETCH * FULL

First one would fetch complete content of a message numbered one from the imap server and the second one 09 FETCH * FULL will get all the mail content for all messages located on the remote IMAP server.

The STATUS command aforementioned earlier could take the following list of arguments:

MESSAGES, UNSEEN, RECENT UIDNEXT UIDVALIDITY

These commands are a gold mine for me as a sysadmin as it helps quickly solve problems, hope they would help to somebody out there as well 😉
This way is a way shorter than bothering each time to check, if some customer e-mail account is improperly configured by creating setting up a new account in Thunderbird.