Posts Tagged ‘work efficiency’

Create SVN (Subversion) web statistics on Debian Lenny Linux with mpy-svn-stats and svnstats.sh

Monday, July 5th, 2010

I’ve recently desired to have a visualized statistics on how many commits, imports, people who commit into subversion’s repositories,graphs showing up the most active comitters, commits into the all subversion repositories grouped by month, week etc.
This kind of valuable information can give you insight, on a projects code life cycle. It can also help you to find out who takes most active participation into a certain project code development etc. and therefore could play a vital role in finding out about the work efficiency within your IT company or IT department.

There are plenty of softwares that can generate you some shiny statistics on how often and by whom are commits into your repositories as well as general statistics concerning your repositories accessibility.

Some of the projects suggested by most Linux users online, who had to resolve the same task e.g. (find some decent software to generate them good statistics on the svn use.) are:

1. statsvn

Here is a description on what statsvn is directly taken from its website:

StatSVN retrieves information from a Subversion repository and generates various tables and charts describing the project development, e.g.

StatSVN looks really promising, however what I find personally repulsive about it is that it depends on a Sun Java virtual machine
I have a bad taste for third party software that depends on java and therefore the software uses an XML dump generated from svn log –xml -v path/to/repos > svn-logfile.xml after which it’s necessary to pass the generated svn-logfile.xml file to statsvn, for instance:

statsvn [options] svn-logfile.xml path/to/repos

though a debian of statsvn is available and packaged for Debian in /usr/share/doc/statsvn/README.Debian we read:

Notes to Debian users:

* the jtreemap-based report has been disabled as jtreemap is currently
not packaged for Debian, and Debian cannot ship the applet without
its sources (not included in statsvn’s sources).

— Vincent Fourmond <fourmond@debian.org>, Tue, 4 Mar 2008 21:14:14 +0100

What I understood from statsvn documentation is that jtreemap is absolutely necessary in order to have a running statsvn, regardless if you have or you don’t have a java vm installed.

To take a general idea on what kind of Repo Roadmap does svnstat generates with jtreemap check out the following link

Since jtreemap is not available prepackaged for Debian I decided not to use svnstats though it looked quite superb.

Some further research on the kind of softwares available online able to generate me some statistics from cvs or subversion source repositories led me to,

2. svnplot

svnplot stroke me with it’s perfect looking many graphics generated on the Lines of Code commited, contribution of different authors to the repository, File count, avarage commit file sizes, common activity, author commit activity etc. etc.

I think tt’s worthy to check out some example statistics about a sample repository statistics generated by svnplot to get a better idea what to expect if you choose to install it on your server.

Even though svnplot looked also promising It wasn’t actually my choice because I think it’s not really mature enough as a software, the second reason which hold me back from installing it on my debian server was that I find it too much as a work in progress still.

Since neither svnstast nor svnplot didn’t well match my expectation and lacked a debian package I finally choose:

3. mpy svn stats as a solution to generate and graph information about svn usage

There are few reasons I finally took svn-mpy-stats to be the solution of choice.

1. It is available as a package in Debian Linux and easily installable via apt-get
2. It is written in Python and therefore doesn’t require a java virtual machine or some extra cosmetics to make it work3. It’s really simple and straight forward to configure and already tested and reported that it works well in Debian GNU/Linux

So here is the few simple steps I took to install mpy-svn-stats on Debian Lenny (in Debian Sid / Squeeze I suppose the procedure would be analogous.

– Install mpy-svn-stats via apt-get or aptitude

debian-server:~# apt-get install mpy-svn-stats

Run it for your svn repository with a command like:

debian-server:~# mkdir /var/www/svnstats
/usr/bin/mpy-svn-stats -o /var/www/svnstats/ file:///var/svn-repos/repository_name

In the above command substitute /var/www/svnstats/ and /var/svn-repos/repository_name with a directory of choice where you like to generate the html statistics for the svn usage as well as the full path and name of your repository.

Of course it’s a good idea to make mpy-svn-stats run periodically with for instance crontab or at or any other unix task cheduler available for your Linux system.

So far so good. You have probably already noticed that it’s rather inconvenient because you have to execute mpy-svn-stats command to each of your svn repositories individually.
This is absolute madness if your company is creating new svn source repository projects often, like let’s say everyday, because you will have to generate statistics for each of the repositories either manually or add new repositories manually to a script which will be later invoked by a crontab rule.

To get around this constrain, I’ve come up with a tiny shell script svnstats.sh which takes care for everything on it’s own.

It automatically will loop in your main subversion repositories directory through all the sub-repositories and generate individual html statistics in a separate automatically created directory by the script.

So to make your life easier and automate the process of generating stats with mpy-svn-stats consider downloading svnstats.sh and installing it as a separate rule like so:

debian-server:~# crontab -u root -e

Include therein the following:

# generate svn statistics everyday in 05:20 a.m.20 5 * * * /usr/sbin/svnstats.sh >/dev/null >>&1

Now everyday at 05:20 your mpy-svn-stats will generate a nice graphs and statistics for your subversion repository usage in /var/www/svstats, if you consider generating the data into a different location consider editting the head of mpy-svn-stats svnstats.sh script and change according to your likings.

Now let’s create an Alias in Apache to enable the (mpy-svn-stats generated by svnstats.sh) to be visualized via web:

– Edit VirtualHost configuration file of choice and put there, something like:

Alias /svnstats/ /var/www/svnstats/

Lastly it might be a good idea to use htaccess to protect your url with a password, afterwards you can enjoy your mpy svn statistics.
How to tune MySQL Server to increase MySQL performance using mysqltuner.pl and Tuning-primer.sh

Tuesday, August 9th, 2011

MySQL Easy performance tuning with mysqltuner.pl and Tuning-primer.sh scripts

Improving MySQL performance is crucial for improving a website responce times, reduce server load and improve overall work efficiency of a mysql database server.

I’ve seen however many Linux System administrators who does belittle or completely miss the significance of tuning a newly installed MySQL server installation.
The reason behind that is probably caused by fact that many people think MySQL config variables, would not significantly improve performance and does not pay back for optimization efforts. Moreover there are a bunch of system admins who has to take care for numerous services so they don’t have time to get good knowledge to optimize MySQL servers.
Thus many admins and webmasters nowdays, think optimizations depend mostly on the side of the website programmers.
It’s also sometimes falsely believed that optimizing a MySQL server could reduce the overall server stability.

With the boom of Internet website building and internet marketing, many webmasters emerged and almost anybody with almost no knowledge on GNU/Linux or minimal or no knowledge on PHP can start his Online store, open a blog or create a website powered by some CMS like joomla.
Thus nowdays many servers even doesn’t have a hired system administrators but are managed by people whose knowledge on *Nix is almost next to zero, this is another reason why dozens of MySQL installations online are a default ones and are not taking a good advantage of the server hardware.

The incrase of website visitors leads people servers expectations for hardware also to grow, thus many companies simply buy a new hardware instead of taking the few time to investigate on how current server hardware can be utilized better.
In that manner of thought I though it will be a good idea to write this small article on Tuning mysql servers with two scripts Tuning-primer.sh and mysqltuner.pl.
The scripts are ultra easy to use and does not require only a minimal knowledge on MySQL, Linux or (*BSD *nix if sql is running on BSD).
Tuning-primer.sh and mysqltuner.pl are therefore suitable for a quick MySQL server optimizations to even people who are no computer experts.

I use this two scripts for MySQL server optimizations on almost every new configured GNU/Linux with a MySQL backend.
Use of the script comes to simply download with wget, lynx, curl or some other web client and execute it on the server host which is already running the MySQL server.

Here is an example of how simple it is to run the scripts to Optimize MySQL:

debian:~# perl mysqltuner.pl
>> MySQLTuner 1.2.0 - Major Hayden >major@mhtx.net<
>> Bug reports, feature requests, and downloads at http://mysqltuner.com/
>> Run with '--help' for additional options and output filtering

——– General Statistics ————————————————–
[–] Skipped version check for MySQLTuner script
[OK] Currently running supported MySQL version 5.1.49-3
[OK] Operating on 64-bit architecture

——– Storage Engine Statistics ——————————————-
[–] Status: +Archive -BDB -Federated +InnoDB -ISAM -NDBCluster
[–] Data in MyISAM tables: 6G (Tables: 952)
[!!] InnoDB is enabled but isn’t being used
[!!] Total fragmented tables: 12

——– Security Recommendations ——————————————-
[OK] All database users have passwords assigned

——– Performance Metrics ————————————————-
[–] Up for: 1d 2h 3m 35s (68M q [732.193 qps], 610K conn, TX: 49B, RX: 11B)
[–] Reads / Writes: 76% / 24%
[–] Total buffers: 512.0M global + 2.8M per thread (2000 max threads)
[OK] Maximum possible memory usage: 6.0G (25% of installed RAM)
[OK] Slow queries: 0% (3K/68M)
[OK] Highest usage of available connections: 7% (159/2000)
[OK] Key buffer size / total MyISAM indexes: 230.0M/1.7G
[OK] Key buffer hit rate: 97.8% (11B cached / 257M reads)
[OK] Query cache efficiency: 76.6% (46M cached / 61M selects)
[!!] Query cache prunes per day: 1822075
[OK] Sorts requiring temporary tables: 0% (1K temp sorts / 2M sorts)
[!!] Joins performed without indexes: 63635
[OK] Temporary tables created on disk: 1% (26K on disk / 2M total)
[OK] Thread cache hit rate: 99% (159 created / 610K connections)
[!!] Table cache hit rate: 4% (1K open / 43K opened)
[OK] Open file limit used: 17% (2K/16K)
[OK] Table locks acquired immediately: 99% (36M immediate / 36M locks)

——– Recommendations —————————————————–
General recommendations:
Add skip-innodb to MySQL configuration to disable InnoDB
Run OPTIMIZE TABLE to defragment tables for better performance
Enable the slow query log to troubleshoot bad queries
Increasing the query_cache size over 128M may reduce performance
Adjust your join queries to always utilize indexes
Increase table_cache gradually to avoid file descriptor limits
Variables to adjust:
query_cache_size (> 256M) [see warning above] join_buffer_size (> 256.0K, or always use indexes with joins) table_cache (> 7200)

You see there are plenty of things, the script reports, for the unexperienced most of the information can be happily skipped without need to know the cryptic output, the section of importance here is Recommendations for some clarity, I’ve made this section to show up bold.

The most imporant things from the Recommendations script output is actually the lines who give suggestions for incrase of certain variables for MySQL.In this example case this are the last three variables:
query_cache_size,
join_buffer_size and
table_cache

All of these variables are tuned from /etc/mysql/my.cnf (on Debian) and derivatives distros and from /etc/my.cnf on RHEL, CentOS, Fedora and the other RPM based Linux distributions.

On some custom server installs my.cnf is also located in /usr/local/mysql/etc/ or some other a bit more unstandard location 😉

Anyways now having the Recommendation from the script, it’s necessery to edit my.cnf and try to double the values for the suggested variables.

First, I check if all the suggested variables are existent in my config with grep , if they’re not then I’ll simply add the variable with doubled size of the suggested values.
P.S: One note here is sometimes some values which are configured, are the default value for the MySQL server and does not have a record in my.cnf

debian:~# grep -E 'query_cache_size|join_buffer_size|table_cache' /etc/mysql/my.cnf table_cache = 7200
query_cache_size = 256M
join_buffer_size = 262144

All of my variables are in the config so, now edit my.cnf and set values to:
table_cache = 14400
query_cache_size = 512M
join_buffer_size = 524288

I always, however preserve the old variable’s value, because sometimes raising the value might create problem and the MySql server might be unable to restart properly.
Thus before going with adding the new values make sure the old ones are commented with # , e.g.:
#table_cache = 7200
#query_cache_size = 256M
#join_buffer_size = 262144

I would recommend vim as editor of choice while editing my.cnf as vim completely rox 😉 If you’re not acquainted to vim use nano or mcedit or your editor of choice 😉 :

debian:~# vim /etc/mysql/my.cnf
...

Assuming that the changes are made, it’s time to restart MySQL to make sure the new values are read by the SQL server.

debian:~# /etc/init.d/mysql restart
* Stopping MySQL database server mysqld [ OK ]
* Starting MySQL database server mysqld [ OK ]
Checking for tables which need an upgrade, are corrupt or were not closed cleanly.

If mysql server fails, however to restart, make sure immediately you reverse back the changed variables to the commented values and restart once again via mysql init script to make server load.

Afterwards start adding the values one by one until find out which one is causing the mysqld to fail.

Now the second script (Tuning-primer.sh) is also really nice for MySQL performance optimizations are necessery. However it’s less portable (as it’s written in bash scripting language).
Consider running this script among different GNU/Linux distributious (especially the newer ones) might produce errors.
Tuning-primer.sh requires some minor code changes to be able to run on FreeBSD, NetBSD and OpenBSD *nices.

The way Tuning-primer.sh works is precisely like mysqltuner.pl , one runs it it gives some info about current running MySQL server and based on certain factors gives suggestions on how increasing or decresing certain my.cnf variables could reduce sql query bottlenecks, solve table locking issues as well as generally improve INSERT, UPDATE query times.

Here is an example output from tuning-primer.sh run on another server:

server:~# wget https://www.pc-freak.net/files/Tuning-primer.sh
...
server:~# sh Tuning-primer.sh
-- MYSQL PERFORMANCE TUNING PRIMER --
- By: Matthew Montgomery -

MySQL Version 5.0.51a-24+lenny5 x86_64

Uptime = 8 days 10 hrs 19 min 8 sec
Avg. qps = 179
Total Questions = 130851322
Threads Connected = 1

Server has been running for over 48hrs.
It should be safe to follow these recommendations

To find out more information on how each of these
runtime variables effects performance visit:
http://dev.mysql.com/doc/refman/5.0/en/server-system-variables.html

SLOW QUERIES
Current long_query_time = 1 sec.
You have 16498 out of 130851322 that take longer than 1 sec. to complete
The slow query log is NOT enabled.
Your long_query_time seems to be fine

MAX CONNECTIONS
Current max_connections = 2000
Current threads_connected = 1
Historic max_used_connections = 85
The number of used connections is 4% of the configured maximum.
Your max_connections variable seems to be fine.

WORKER THREADS
Current thread_cache_size = 128
Current threads_cached = 84
Current threads_per_sec = 0
Historic threads_per_sec = 0
Your thread_cache_size is fine

MEMORY USAGE
Tuning-primer.sh: line 994: let: expression expected
Max Memory Ever Allocated : 741 M
Configured Max Memory Limit : 5049 M
Total System Memory : 23640 M

KEY BUFFER
Current MyISAM index space = 1646 M
Current key_buffer_size = 476 M
Key cache miss rate is 1 / 56
Key buffer fill ratio = 90.00 %
You could increase key_buffer_size
It is safe to raise this up to 1/4 of total system memory;
assuming this is a dedicated database server.

QUERY CACHE
Query cache is enabled
Current query_cache_size = 64 M
Current query_cache_used = 38 M
Current Query cache fill ratio = 59.90 %

SORT OPERATIONS
Current sort_buffer_size = 2 M
Current record/read_rnd_buffer_size = 256.00 K
Sort buffer seems to be fine

JOINS
Current join_buffer_size = 128.00 K
You have had 111560 queries where a join could not use an index properly
You have had 91 joins without keys that check for key usage after each row
You should enable “log-queries-not-using-indexes”
Then look for non indexed joins in the slow query log.
If you are unable to optimize your queries you may want to increase your
join_buffer_size to accommodate larger joins in one pass.

TABLE CACHE
Current table_cache value = 3600 tables
You have a total of 798 tables
You have 1904 open tables.
The table_cache value seems to be fine

TEMP TABLES
Current tmp_table_size = 128 M
1% of tmp tables created were disk based
Created disk tmp tables ratio seems fine

TABLE SCANS
Current read_buffer_size = 128.00 K
Current table scan ratio = 797 : 1
read_buffer_size seems to be fine

TABLE LOCKING
Current Lock Wait ratio = 1 : 1782
You may benefit from selective use of InnoDB.

As seen from script output, there are certain variables which might be increased a bit for better SQL performance, one such variable as suggested is key_buffer_size(You could increase key_buffer_size)

Now the steps to make the tunings to my.cnf are precisely the same as with mysqltuner.pl, e.g.:
1. Preserve old config variables which will be changed by commenting them
2. Double value of current variables in my.cnf suggested by script
3. Restart Mysql server via /etc/init.d/mysql restart cmd.
4. If mysql runs fine monitor mysql performance with mtop or mytop for at least 15 mins / half an hour.

if all is fine run once again the tuning scripts to see if there are no further improvement suggestions, if there are more follow the 4 steps described procedure once again.

It’s also a good idea that these scripts are periodically re-run on the server like once per few months as changes in SQL queries amounts and types will require changes in MySQL operational variables.
The authors of these nice scripts has done great job and have saved us a tons of nerves time, downtimes and money spend on meaningless hardware. So big thanks for the awesome scripts guys 😉
Finally after hopefully succesful deployment of changes, enjoy the incresed SQL server performance 😉

How to make screenshot in /dev/tty console on GNU / Linux – Taking picture JPEG / PNG snapshot of text console in systems without graphical environment

Monday, April 30th, 2012

I'm used to making picture screenshots in GNOME desktop environment. As I've said in my prior posts, I'm starting to return to my old habits of using console ttys for regular daily jobs in order to increase my work efficiency. In that manner of thoughts sometimes I need to take a screenshot of what I'm seeing in my physical (TTY consoles) to be able to later reuse this. I did some experimenting and this is how this article got born.

In this post, I will shortly explain how a picture of a command running in console or terminal in GNU / Linux can be made

Before proceeding to the core of the article, I will say few words on ttys as I believe they might be helpful someone.
The abbreviation of tty comes after TeleTYpewritter phrase and is dating back somewhere near the 1960s. The TTY was invented to help people with impaired eyesight or hearing to use a telephone like typing interface.

In Unix / Linux / BSD ttys are the physical consoles, where one logs in (typing in his user/password). There are physical ttys and virtual vtys in today *nixes. Today ttys, are used everywhere in a modern Unixes or Unix like operating system with or without graphical environments.
Various Linux distributions have different number of physical consoles (TTYs) (terminals connected to standard output) and this depends mostly on the distro major contributors, developers or surrounding OS community philosophy.
Most modern Linux distributions have at least 5 to 7 physical ttys. Some Linux distributions like Debian for instance as of time of writting this, had 7 active by default physical consoles.
Adding 3 more ttys in Debian / Ubuntu Linux is done by adding the following lines in /etc/inittab:
 

7:23:respawn:/sbin/getty 38400 tty7
8:23:respawn:/sbin/getty 38400 tty8
9:23:respawn:/sbin/getty 38400 tty9

On some Linux distributions like Fedora version 9 and newer ones, new ttys can no longer be added via /etc/inittab,as the RedHat guys changed it for some weird reason, but I guess this is too broad issue to discuss ….

In graphical environments ttys are called methaphorically "virtual". For instance in gnome-terminal or while connecting to a remote SSH server, a common tty naming would be /dev/pts/8 etc.

tty command in Linux and BSDs can be used to learn which tty, one is operating in.

Here is output from my tty command, issued on 3rd TTY (ALT+F3) on my notebook:
 

noah:~# tty
/dev/tty3

A tty cmd output from mlterm GUI terminal is like so:
 

hipo@noah:~$ tty/dev/pts/9

Now as mentioned few basic things on ttys I will proceed further to explain how I managed to:

a) Take screenshot of a plain text tty screen into .txt file format
b) take a (picture) JPG / PNG screenshot of my Linux TTY consoles content

1. Take screenshot of plain text tty screen into a plain (ASCII) .txt file:

To take a screenshot of tty1, tty2 and tty3 text consoles in a txt plain text format, cat + a standard UNIX redirect is all necessery:
 

noah:~# cat /dev/vcs1 > /home/hipo/tty1_text_screenshot.txt
noah:~# cat /dev/vcs2 > /home/hipo/tty2_text_screenshot.txt
noah:~# cat /dev/vcs3 > /home/hipo/tty3_text_screenshot.txt

This will dump the text content of the console into the respective files, if however you try to dump an ncurses library like text interactive interfaces you will end up with a bunch of unreadable mess.
In order to read the produced text 'shots' onwards less command can be used …
 

noah:~# less /home/hipo/tty1_text_screenshot.txt
noah:~# less /home/hipo/tty2_text_screenshot.txt
noah:~# less /home/hipo/tty3_text_screenshot.txt

2. Take picture JPG / PNG snapshot of Linux TTY console content

To take a screenshot of my notebook tty consoles I had to first install a "third party program" snapscreenshot . There is no deb / rpm package available as of time of writting this post for the 4 major desktop linux distributions Ubuntu, Debian, Fedora and Slackware.
Hence to install snapscreenshot,I had to manually download the latest program tar ball source and compile e.g.:
 

noah:~# cd /usr/local/src
noah:/usr/local/src# wget -q http://bisqwit.iki.fi/src/arch/snapscreenshot-1.0.14.3.tar.bz2
noah:/usr/local/src# tar -jxvvvf snapscreenshot-1.0.14.3.tar.bz2

noah:/usr/local/src# cd snapscreenshot-1.0.14.3
noah:/usr/local/src/snapscreenshot-1.0.14# ./configure && make && make install
Configuring…
Fine. Done. make.
make: Nothing to be done for `all'.
if [ ! "/usr/local/bin" = "" ]; then mkdir –parents /usr/local/bin 2>/dev/null; mkdir /usr/local/bin 2>/dev/null; \
for s in snapscreenshot ""; do if [ ! "$s" = "" ]; then \
install -c -s -o bin -g bin -m 755 "$s" /usr/local/bin/"$s";fi;\
done; \
fi; \
if [ ! "/usr/local/man" = "" ]; then mkdir –parents /usr/local/man 2>/dev/null; mkdir /usr/local/man 2>/dev/null; \
for s in snapscreenshot.1 ""; do if [ ! "$s" = "" ]; then \
install -m 644 "$s" /usr/local/man/man"`echo "$s"|sed 's/.*\.//'`"/"$s";fi;\
done; \
fi

By default snapscreenshot command is made to take screenshot in a tga image format, this format is readable by most picture viewing programs available today, however it is not too common and not so standartized for the web as the JPEG and PNG.
Therefore to make the text console tty snapshot taken in PNG or JPEG one needs to use ImageMagick's convert tool. The convert example is also shown in snapscreenshot manual page Example section.

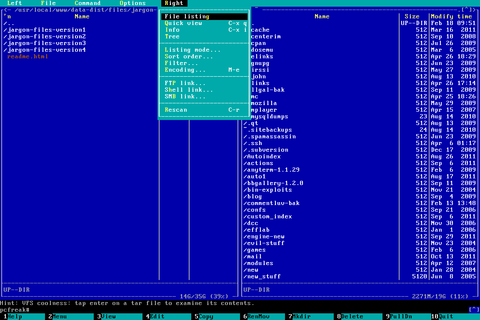
To take a .png image format screenshot of lets say Midnight Commander interactive console file manager running in console tty1, I used the command:
 

noah:/home/hipo# snapscreenshot -c1 -x1 > ~/console-screenshot.tga && convert ~/console-screenshot.tga console-screenshot.png

Linux text console tty mc screenshot with snapscreenshot terminal / console snapshotting program

Note that you need to have read/write permissions to the /dev/vcs* otherwise the snapscreenshot will be unable to read the tty and produce an error:
 

hipo@noah:~/Desktop$ snapscreenshot -c2 -x1 > snap.tga && convert snap.tga snap.pngGeometry will be: 1x2Reading font…/dev/console: Permission denied

To take simultaneous picture screenshot of everything contained in all text consoles, ranging from tty1 to tty5, issue:
 

noah:/home/hipo# snapscreenshot -c5 -x1 > ~/console-screenshot.tga && convert ~/console-screenshot.tga console-screenshot.png

Here is a resized 480×320 pixels version of the original screenshot the command produces:

All text Consoles tty1 to tty5 merged screenshot png image with snapscreenshot taken on Debian GNU / Linux

Storing a picture shot of the text (console) screen in JPEG (JPG) format is done analogously just the convert command output extension has to be changed to jpeg i.e.:
 

noah:/home/hipo# snapscreenshot -c5 -x1 > ~/console-screenshot.tga && convert ~/console-screenshot.tga console-screenshot.jpeg

I've also written a tiny wrapper shell script, to facilitate myself picture picture taking as I didn't like to type each time I want to take a screenshot of a tty the above long line.

Here is the wrapper script I wrote:
 

#!/bin/sh
### Config
# .tga produced file name
output_f_name='console-screenshot.tga';
# gets current date
cur_date=$(date +%d_%m_%Y|sed -e 's/^ *//');
# png output f name
png_f_name="console-screenshot-$cur_date.png";
### END Config
snapscreenshot -c$arg1 -x1 > $output_f_name && convert $output_f_name $png_f_name;
echo "Output png screenshot from tty1 console produced in";
echo "$PWD/$png_f_name";
/bin/rm -f $output_f_name;

You can also download my console-screenshot.sh snapscreenshot wrapper script here

The script is quite simplistic to use, it takes just one argument which is the number of the tty you would like to screenshot.
To use my script download it in /usr/local/bin and set it executable flag:
 

noah:~# cd /usr/local/bin
noah:/usr/local/bin# wget -q https://www.pc-freak.net/~bshscr/console-screenshot.sh
noah:/usr/local/bin# chmod +x console-screenshot.sh

Onwards to use the script to snapshot console terminal (tty1) type:
 

noan:~# console-screenshot.sh

I've made also mirror of latest version of snapscreenshot-1.0.14.3.tar.bz2 here just in case this nice little program disappears from the net in future times.