Posts Tagged ‘Open’

How to Install and Use Kibana for Log Visualization

Wednesday, February 18th, 2026

/images/kibana-logo how to install it on linux
I saw Kibana in my professional career and I find it a very interesting tool for sysadmins, so I thought it might be helpful to someone out there to write a small article on how to install and use to to visualize data inside some elasticsearch software.

Kibana is an open-source data visualization and exploration tool used to analyze large volumes of data, especially logs. It is part of the ELK Stack (Elasticsearch, Logstash, Kibana), and is commonly used for centralized log management, security monitoring, and observability.

Kibana is often used in the so-called ELK pipeline for log file collection, analysis and visualization:

  • Elasticsearch is for searching, analyzing, and storing your data
  • Logstash (and Beats) is for collecting and transforming data, from any source, in any format
  • Kibana is a portal for visualizing the data and to navigate within the elastic stack
     

In this article, you'll learn how to:

  • Install Kibana
  • Connect it to Elasticsearch
  • Visualize log data
  • Use its basic features

Prerequisites

Before installing Kibana, make sure you have the following:

  • A Linux server running (Ubuntu / Debian / CentOS / RHEL)
  • Elasticsearch installed and running
  • Root or sudo access

Install Kibana

I. On Debian/Ubuntu
 

  1. Import the Elastic GPG key:

# wget -qO – https://artifacts.elastic.co/GPG-KEY-elasticsearch | sudo apt-key add –

  1. Add the repository:

# echo "deb https://artifacts.elastic.co/packages/8.x/apt stable main" | sudo tee -a /etc/apt/sources.list.d/elastic-8.x.list

  1. Update and install:


# apt update

# apt install kibana

II. On RHEL/CentOS Linux

  1. Create repo file:

# tee /etc/yum.repos.d/elastic.repo <<EOF

[elastic-8.x]

name=Elastic repository for 8.x packages

baseurl=https://artifacts.elastic.co/packages/8.x/yum

gpgcheck=1

gpgkey=https://artifacts.elastic.co/GPG-KEY-elasticsearch

enabled=1

autorefresh=1

type=rpm-md

EOF

  1. Install Kibana:

# yum install kibana

2. Configure Kibana

The configuration file is located at:

/etc/kibana/kibana.yml

Edit the file:

# vim /etc/kibana/kibana.yml

Update or add the following:
 

# Server settings
server.port: 5601
server.host: "0.0.0.0"

# Elasticsearch connection
elasticsearch.hosts: [“http://localhost:9200”]

# Logging
logging.level: info

# Security (only if Elasticsearch security is enabled)
# elasticsearch.username: "kibana_system"
# elasticsearch.password: "your_password_here"

Optional: Set basic auth or SSL settings if needed.


3. Start and Enable Kibana

# systemctl enable kibana

# systemctl start kibana

Check status:

# systemctl status kibana


4. Access Kibana Web Interface

Open your browser and go to:

http://<your-server-ip>:5601

You’ll be welcomed with the Kibana dashboard.

5. Import and Visualize Logs

Option A: Use Filebeat to Send Logs

Install Filebeat on the server with logs and configure it to send data to Elasticsearch. Kibana will then be able to visualize it.

# apt install filebeat

# filebeat modules enable system

# filebeat setup

# systemctl start filebeat

Option B: Ingest Logs via Logstash or Elasticsearch API

If you already have data in Elasticsearch, Kibana will automatically detect indices.
 

6. Create Index Pattern

  1. In Kibana, go to Stack Management -> Index Patterns
  2. Click Create Index Pattern
  3. Enter the name (e.g., filebeat-*)
  4. Select the timestamp field (usually @timestamp)
  5. Save

Now Kibana knows how to query and visualize your data.

7. Create Visualizations and Dashboards

  1. Go to Visualize -> Create visualization
  2. Choose a type (bar, pie, line, etc.)
  3. Select an index pattern
  4. Configure metrics and buckets

You can then save visualizations and add them to dashboards.

8. Secure Kibana

  • Configure TLS/SSL for Kibana / ElasticSearch (such as Logstash)
  • Use additional Elastic Security features like RBAC (Role Based Access Control, SSO (Single Sign On)
  • Secure Kibana with a reverse proxy (e.g., Nginx + Basic Auth or Apache / Haproxy infront)

Example Nginx config simple snippet:

location / {

  proxy_pass http://localhost:5601;

  auth_basic "Restricted";

  auth_basic_user_file /etc/nginx/.htpasswd;

}


What is Kibana used for and what it can do for you?

Use Case

Description

Log Monitoring

Visualize system and application logs in real time

Security Analytics

Detect anomalies, failed logins, suspicious activity

DevOps Dashboards

Track uptime, error rates, and system performance

SIEM

Use Elastic Security for threat detection


Once Kibana is installed on a server, you typically use it to visualize and explore data stored in Elasticsearch. Here’s a practical guide with sample usage scenarios:

Access Kibana

After installation, Kibana usually runs on port 5601 by default.

http://<your-server-ip>:5601

  • Open this URL in a browser.
  • You should see the Kibana dashboard.

Connect to Elasticsearch

Kibana automatically connects to your Elasticsearch instance if installed locally.
You can verify the connection:

GET /_cluster/health

  • Go to Dev ToolsConsole in Kibana.
  • Run the above query to check cluster status.

Visualize Data

Kibana allows multiple types of visualizations:

  • Bar/line chart: trends over time.
  • Pie chart: distribution of values.
  • Data table: top IP addresses or most visited URLs.
  • Maps: geolocation of IP addresses.

Create Dashboards

  • Combine multiple visualizations in a Dashboard.
  • Useful for monitoring logs, metrics, or application performance.
  • Example: Create a dashboard with:


    • Requests per URL (bar chart)
    • Requests over time (line chart)
    • Top client IPs (data table)
    • Errors by type (pie chart)

 Search & Query Logs

  • Use Discover to search logs interactively.
  • Example KQL query:

status:500 AND url:"/login"

This finds all failed login requests.

Set Alerts (Optional)

  • Kibana’s Alerts and Actions can trigger notifications (email, Slack, etc.) when certain thresholds are crossed.
  • Example: alert if error responses exceed 100 in 5 minutes.

Once Kibana is installed on a server, you typically use it to visualize and explore data stored in Elasticsearch. Here’s a practical guide with sample usage scenarios:

Access Kibana

After installation, Kibana usually runs on port 5601 by default.

http://<your-server-ip>:5601

  • Open this URL in a browser.
  • You should see the Kibana dashboard.

Connect to Elasticsearch

Kibana automatically connects to your Elasticsearch instance if installed locally.
You can verify the connection:

GET /_cluster/health

  • Go to Dev ToolsConsole in Kibana.
  • Run the above query to check cluster status.

Visualize Data

Kibana allows multiple types of visualizations:

  • Bar/line chart: trends over time.
  • Pie chart: distribution of values.
  • Data table: top IP addresses or most visited URLs.
  • Maps: geolocation of IP addresses.

Create Dashboards

  • Combine multiple visualizations in a Dashboard.
  • Useful for monitoring logs, metrics, or application performance.
  • Example: Create a dashboard with:
     

    • Requests per URL (bar chart)
    • Requests over time (line chart)
    • Top client IPs (data table)
    • Errors by type (pie chart)

 Search & Query Logs

  • Use Discover to search logs interactively.
  • Example KQL query:

status:500 AND url:"/login"

This finds all failed login requests.

Set Alerts (Optional)

  • Kibana’s Alerts and Actions can trigger notifications (email, Slack, etc.) when certain thresholds are crossed.
  • Example: alert if error responses exceed 100 in 5 minutes.

Once Kibana is installed on a server, you typically use it to visualize and explore data stored in Elasticsearch. Here’s a practical guide with sample usage scenarios:

Access Kibana

After installation, Kibana usually runs on port 5601 by default.

http://your-server-ip:5601

  • Open this URL in a browser.
  • You should see the Kibana dashboard.

Connect to Elasticsearch

Kibana automatically connects to your Elasticsearch instance if installed locally.
You can verify the connection:

GET /_cluster/health

  • Go to Dev ToolsConsole in Kibana.
  • Run the above query to check cluster status.

Visualize Data

Kibana allows multiple types of visualizations:

  • Bar/line chart: trends over time.
  • Pie chart: distribution of values.
  • Data table: top IP addresses or most visited URLs.
  • Maps: geolocation of IP addresses.

Create Dashboards

  • Combine multiple visualizations in a Dashboard.
  • Useful for monitoring logs, metrics, or application performance.
  • Example: Create a dashboard with:

    • Requests per URL (bar chart)
    • Requests over time (line chart)
    • Top client IPs (data table)
    • Errors by type (pie chart)

 Search & Query Logs

  • Use Discover to search logs interactively.
  • Example KQL query:

status:500 AND url:"/login"

This finds all failed login requests.

Set Alerts (Optional)

  • Kibana’s Alerts and Actions can trigger notifications (email, Slack, etc.) when certain thresholds are crossed.
  • Example: alert if error responses exceed 100 in 5 minutes.

kibana-sample-dashboard-screenshot

Sample Kibana dashboard
 

kibana-geo-kibana-web-traffic-by-location

Kibana with connected servers to find out Geo Location
 

Summary closing words (what we did)

Step

Action

 1

Install Kibana from Elastic repo

2

Configure to connect to Elasticsearch

3

Start and enable the service

4

Access it via http://<ip>:5601

5

Ingest log data

6

Define index pattern

7

Create dashboards and visualizations

The idea of this article was just to introduce you to the existence of Elasticsearch / kibana and filebeat and logstack and not to give you a fully fine tuned install guide. The usual way to deploy Kibana on multiple servers of course is using a dockerized container version of it. There is plenty to learned on how to use kibana to do a monitoring of your machines. But most simple use is to directly access the locally visible kibana on a server and check the status of processes on the host instead of logging via SSH. Kibana can do pretty much


Some further useful Reading Resources


Generate and Use WiFi passwords via QR code on Linux

Monday, November 17th, 2025

If you’re running a WiFi network for a guest house / AirBNB, a small hotel or an office / home network and you’re tired of telling / dictating guests your long, complicated Wi-Fi password every time they visit, there’s a simple and secure way to share the WiFi name and password by putting the info in a WiFi authentication QR code. With a simple scan from their phone via a QR reader (which iPhones and all modern smartphones have), they can join your network instantly with zero typing.

In short — Why use a QR Code for Wi-Fi?

  • Convenience for guests: No more reading or spelling out your SSID and password.
  • Better security practice: Keep a strong password while still making access easy.
  • Works on most devices: Android and iOS both support Wi-Fi QR codes.

The Wi-Fi QR Code Standard Format

Smartphones understand Wi-Fi QR codes using this format:

WIFI:S:;T:;P:;;

  • S: your Wi-Fi network name (SSID)
  • T: encryption type (WPA, WEP, or nopass)
  • P: your Wi-Fi password
  • Everything ends with ;;

If your SSID or password contains special characters such as ; or \, they must be escaped using a backslash \.

Example:

SSID = WifiNetworkName
Password = @ss;word45123P4?#$!
Type = WPA

The final string becomes:

WIFI:S:WifiNetworkName;T:WPA;P:@ss\;word45123P4?#$!;;

How to Generate the QR Code Locally on Linux

You can generate the QR code locally using qrencode instead of uploading credentials online.

  1. Install qrencode (Debian/Ubuntu):

    # apt update # apt install qrencode

  2. Generate the QR code:

    # qrencode -o wifi-qr.png 'WIFI:S:WifiNetwork;T:WPA;P:P@ss\;word!;;'

    Example with colors and SVG output:

    # qrencode -t svg –foreground=FFFFFF –background=000000 \ -o qr-code.svg –inline –rle -s 10 \ "WIFI:S:MyWiFI;T:WPA;P:<Secret_Pass>;;"

    Use -s to increase size, e.g. -s 10.

  3. Print or share the generated wifi-qr.png.

Alternative: GUI / Desktop Approach

On GNOME-based systems (Ubuntu, Fedora), install the WiFi QR Code GNOME extension.

  • Open quick settings → Wi-Fi → “Show QR Code”
  • Right-click to copy or save for printing

Advanced: Using wifi-qr Tool

The wifi-qr tool provides CLI and GUI Wi-Fi QR generation.

# terminal interface to generate QR
# wifi-qr -t

wifi-qr screenshot

This command prints your current Wi-Fi SSID, encryption type, and password in clear text.

Security Tips

  • Limit where you display the QR
  • Rotate the password when needed
  • Use a guest network instead of your main one
  • Prefer WPA2/WPA3
  • Store QR images safely

How Guests Use the QR Code

  1. Open the phone camera (iOS/Android)
  2. Point it at the QR
  3. Tap “Join” when the Wi-Fi prompt appears

Final Thoughts

Generating a Wi-Fi QR code blends security with usability. Whether using qrencode, a GUI extension, or a website, guests connect instantly with a quick scan – no typing required.

How to Install and Troubleshoot Grafana Server on Linux: Complete Step-by-Step Tutorial

Saturday, October 25th, 2025

install-grafana-on-linux-logo

If you’ve ever set up monitoring for your servers or applications, you’ve probably heard about Grafana.
It’s the de facto open-source visualization and dashboard tool for time-series data — capable of turning raw metrics into beautiful and insightful charts.

In this article, I’ll walk you through how to install Grafana on Linux, configure it properly, and deal with common problems that many sysadmins hit along the way.
This guide is written with real-world experience, blending tips from the official documentation and years of self-hosting tinkering.

1. Prerequisites

You’ll need:

  • A Linux machine — Ubuntu 22.04 LTS, Debian 11+, or CentOS 8 / Rocky Linux 9.
  • A superuser or user with sudo privileges.
  • At least 512 MB of RAM and 1 CPU core (Grafana is lightweight).
  • Internet access to fetch the repository and packages.

Optionally:

  • A domain name (for example: grafana.yourdomain.com)
  • Nginx/Apache if you want to enable HTTPS later.

2. Update Your System

Before any installation, ensure your system packages are up to date:

# Debian/Ubuntu
# apt update && sudo apt upgrade -y

# or

# dnf update -y # CentOS/RHEL/Rocky

3. Install Grafana (from the Official Repository)

Grafana provides an official APT and YUM repository. Always use it to get security and feature updates.

For Debian / Ubuntu:
 

# apt install -y software-properties-common apt-transport-https wget
# wget -q -O - https://packages.grafana.com/gpg.key | sudo apt-key add -
# echo "deb https://packages.grafana.com/oss/deb stable main" | \
# tee /etc/apt/sources.list.d/grafana.list
# apt update
# apt install grafana -y 


For CentOS / Rocky / RHEL:

# tee /etc/yum.repos.d/grafana.repo <<EOF
[grafana]
name=Grafana OSS
baseurl=https://packages.grafana.com/oss/rpm
repo_gpgcheck=1
enabled=1
gpgcheck=1
gpgkey=https://packages.grafana.com/gpg.key
EOF
# dnf install grafana -y


4. Start and Enable the Service

Once installation completes, start and enable Grafana to run on boot:
 

# systemctl daemon-reload
# systemctl enable grafana-server
# systemctl start grafana-server

Check status:

# systemctl status grafana-server


You should see Active: running.

5. Access the Grafana Web Interface

Grafana listens on port 3000 by default.

Open your browser and visit:

http://<your_server_ip>:3000

Login with the default credentials:

Username: admin
Password: admin

You’ll be asked to change the password — do it immediately for security.

6. Configure Grafana Basics

Configuration file location:

/etc/grafana/grafana.ini

Common settings to edit:

  • Port:

http_port = 8080

  • Root URL (for reverse proxy):

root_url = https://grafana.yourdomain.com/

  • Database: (change from SQLite to MySQL/PostgreSQL if desired)
[database]
type = mysql
host = 127.0.0.1:3306
name = grafana
user = grafana
password = supersecret_password582?255!#

Restart Grafana after making changes:

# systemctl restart grafana-server


7. Optional – Secure Grafana with HTTPS and Reverse Proxy

If Grafana is public-facing, always use HTTPS.

Install Nginx and Certbot:

# apt install nginx certbot python3-certbot-nginx -y
# certbot --nginx -d grafana.yourdomain.com

This automatically sets up SSL certificates and redirects traffic from HTTP → HTTPS.

8. Add a Data Source

Once logged in:

  1. Go to Connections → Data Sources → Add data source

  2. Choose Prometheus, InfluxDB, Loki, or your preferred backend

  3. Enter the connection URL (e.g., http://localhost:9090)

  4. Click “Save & Test”

If successful, you can start creating dashboards!

9. Troubleshooting Common Grafana Installation Issues

Even the smoothest installs sometimes go wrong.
Here are real-world fixes for typical problems sysadmins face:

Problem

Likely Cause

Fix

Service won’t start

Misconfigured grafana.ini or port in use

Run # journalctl -u grafana-server -xe to see logs. Correct syntax, change port, restart.

Port 3000 already in use

Another app (maybe NodeJS app or Jenkins)

sudo lsof -i :3000 → stop or reassign the conflicting service.

Blank login page / dashboard not loading

Browser cache or reverse proxy misconfig

Clear cache, check Nginx proxy settings (proxy_pass should point to http://localhost:3000).

APT key errors (Ubuntu 22.04+)

apt-key deprecated

Use signed-by=/usr/share/keyrings/grafana.gpg method as Grafana docs suggest.

“Bad Gateway” via proxy

Missing header forwarding

In Nginx config, ensure:

proxy_set_header Host $host;
proxy_set_header X-Real-IP $remote_addr;
proxy_set_header X-Forwarded-For $proxy_add_x_forwarded_for;
proxy_set_header X-Forwarded-Proto $scheme;


“` |
| **Can’t access Grafana from LAN**

Most common reason Firewall blocking port

# ufw allow 3000/tcp


 (or adjust firewalld). 


10. Maintenance and Backup Tips
 

– Backup your dashboard database frequently: 
– SQLite: `/var/lib/grafana/grafana.db`
– MySQL/PostgreSQL: use your normal DB backup methods

– Watch logs regularly, e.g.: 

# journalctl -u grafana-server -f

  • Upgrade grafana safely:

# apt update && apt install grafana -y

(Always back up before upgrading!)

Conclusion

Grafana is a powerful, elegant way to visualize your system metrics, application logs, and alerts.
Installing it on Linux is straightforward — but knowing where it can fail and how to fix it is what separates a beginner from a seasoned sysadmin.

By following this guide, you not only get Grafana up and running, but also understand the moving parts behind the scenes — a perfect fit for any DIY server admin or DevOps engineer who loves keeping full control.

How to Install and use FreeIPA forcentralized SSO authention on Linux computer domain

Wednesday, October 1st, 2025

freeipa-gnu-linux-free-sso-solution-logo

FreeIPA is a popular open-source identity management solution that centralizes user, host, and service authentication for Linux environments. It combines LDAP, Kerberos, DNS, and certificate management into a single platform, making it easier to manage large Linux deployments securely.

In this article, we’ll cover how to install FreeIPA on a Linux server, perform initial configuration, and start using it for basic user management.

Prerequisites

  • A clean Linux server (CentOS, RHEL, Fedora, or similar)
  • Root or sudo access
  • A fully qualified domain name (FQDN) for your server (e.g., ipa.example.com)
  • Proper DNS setup (recommended but can be configured during installation)
     

1. Update system to the latest

Start by updating your system to ensure all packages are current.
 

# dnf update -y


2. Install FreeIPA Server Packages

Install the FreeIPA server and its dependencies:

# dnf install -y ipa-server ipa-server-dns

  • ipa-server-dns is optional but recommended if you want FreeIPA to manage DNS for your domain.

3. Configure FreeIPA server

Run the FreeIPA installation script to configure the server. Replace ipa.example.com with your actual server hostname.

sudo ipa-server-install

You will be prompted for:

  • Realm name: Usually uppercase of your domain, e.g., EXAMPLE.COM
  • Directory Manager password: LDAP admin password
  • IPA admin password: FreeIPA admin user password
  • DNS configuration: Enable if you want FreeIPA to manage DNS

Sample configuration flow:

Realm name: EXAMPLE.COM

DNS domain name: example.com

Server host name: ipa.example.com

Directory Manager password: [choose a strong password]

IPA admin password: [choose a strong password]

Do you want to configure integrated DNS (BIND)? [yes/no]: yes

The installer will set up Kerberos, LDAP, the CA, DNS (if chosen), and the Web UI.

4. Start and Enable FreeIPA Services

The installer usually starts services automatically, but you can verify with:

# systemctl status ipa

Enable the service to start on boot:
 

# systemctl enable ipa


5. Access FreeIPA Web Interface

Open your browser and navigate to:

https://ipa.example.com/ipa/ui/

Log in using the admin username and the password you set during installation.

6. Add Users and Groups

You can manage users and groups either via the Web UI or the CLI.

Using the CLI:

Add a new user:

# ipa user-add johndoe –first=John –last=Doe –email=johndoe@example.com

Set a password for the new user:

# ipa passwd johndoe


Add a new group:

# ipa group-add developers –desc="Development Team"


Add user to the group:

# ipa group-add-member developers –users=johndoe


7. Join Client Machines to the FreeIPA Domain
 

On a client machine, install the client packages:

# dnf install -y ipa-client

Run the client setup:

# ipa-client-install –mkhomedir

Follow the prompts to join the client to the FreeIPA domain.

8. Test Authentication
 

Try logging into the client machine with the FreeIPA user you created:
 

# ssh username@client-machine-host.com

You should be able to authenticate using the FreeIPA credentials.
 

Conclusion


You now have a basic FreeIPA server up and running, managing users and authentication across your Linux network. FreeIPA simplifies identity management by providing a centralized, secure, and integrated solution. From here, you can explore advanced features like role-based access control, host-based access control, and certificate management.


Here's a practical example of how FreeIPA can be used in a real-world Linux environment.

Scenario: Centralized Authentication in a DevOps Environment
 

Tech Problem

Lets say you are managing a growing team of DevOps engineers and developers across multiple Linux servers (e.g., for CI/CD, staging, and production). Manually creating and maintaining user accounts, SSH keys, and sudo permissions on each server is:

  • Time-consuming
  • Error-prone
  • A security risk (inconsistent policies, orphaned accounts)

Solution: Use FreeIPA to Centralize Identity & Access Management

By deploying FreeIPA, you can:

  • Create user accounts once and manage them centrally
  • Enforce SSO across servers using Kerberos
  • Automatically apply sudo rules, group permissions, and access control policies
  • Easily revoke access for offboarded employees
  • Use host-based access control (HBAC) to control who can log in to what
     

Solution Walkthrough
 

1. Set up FreeIPA server

  • Installed on: ipa.internal.example.com
  • Domain: internal.example.com
  • Realm: INTERNAL.EXAMPLE.COM


2. Add User Accounts

Let's add two users: alice (developer) and bob (DevOps).
 

# ipa user-add alice –first=Alice –last=Smith –email=alice@internal.example.com

# ipa user-add bob –first=Bob –last=Jones –email=bob@internal.example.com

# ipa passwd alice

# ipa passwd bob


3. Create Groups and Roles necessery

Create functional groups for managing permissions.
 

# ipa group-add developers –desc="Developers Team"

# ipa group-add devops –desc="DevOps Team"

# ipa group-add-member developers –users=alice

# ipa group-add-member devops –users=bob

4. Configure Sudo Rules

Let’s allow DevOps team members to use sudo on all servers:
 

# ipa sudorule-add devops-sudo –cmdcat=all

# ipa sudorule-add-user devops-sudo –groups=devops

# ipa sudorule-add-host devops-sudo –hostgroups=all

5. Control Access with HBAC Rules

Let’s say:

  • Developers can access dev and staging servers
  • DevOps can access all servers

# Create host groups
 

# ipa hostgroup-add dev-servers –desc="Development Servers"

# ipa hostgroup-add staging-servers –desc="Staging Servers"


# Add hosts to groups
 

# ipa hostgroup-add-member dev-servers –hosts=dev1.internal.example.com

# ipa hostgroup-add-member staging-servers –hosts=staging1.internal.example.com


# HBAC rule for developers

# ipa hbacrule-add allow-developers

# ipa hbacrule-add-user allow-developers –groups=developers

# ipa hbacrule-add-host allow-developers –hostgroups=dev-servers

# ipa hbacrule-add-host allow-developers –hostgroups=staging-servers

# ipa hbacrule-add-service allow-developers –hbacsvcs=sshd


# HBAC rule for DevOps (all access)

# ipa hbacrule-add allow-devops

# ipa hbacrule-add-user allow-devops –groups=devops

# ipa hbacrule-add-host allow-devops –hostgroups=all

# ipa hbacrule-add-service allow-devops –hbacsvcs=sshd


6. Join Client Servers to FreeIPA

On each Linux server (e.g., dev1, staging1, prod1), run:


# ipa-client-install –mkhomedir –server=ipa.internal.example.com –domain=internal.example.com


Now, user alice can log in to dev1 and staging1, but not prod1. bob can log in to all servers and use sudo.

7. What Happens When Alice Leaves the Company?

Just disable the user in FreeIPA:

# ipa user-disable alice

This immediately revokes her access across all servers — no need to touch individual machines.

Benefits in This Example

Feature

Outcome

Centralized user management

No need to manually create accounts on every server

Group-based sudo

DevOps has privileged access, others don’t

Access control

Developers only access dev/staging, not prod

Kerberos SSO

Secure, passwordless SSH with ticketing

Auditing

Central logs of who accessed what and when

Quick offboarding

Instant account disablement from a single location

Summary

FreeIPA is not just a replacement for LDAP — it's a full-blown identity and access management solution tailored for Linux systems. In this practical example, it brings enterprise-grade access control, authentication, and user management to a DevOps workflow with minimal friction.

Unlocking the Power of lnav: Logfile Navigator – ncurses text based tool guide to mutiple Logs on multiple servers easy analysis on Linux

Saturday, September 13th, 2025

lnav-syslog-screenshot-linux-virtual-machine

If you've ever found yourself buried under a mountain of log files, tailing multiple outputs, or grepping through endless lines trying to spot an error, it's time to meet your new best friend: lnav, the Logfile Navigator.

Lightweight, terminal-based, and surprisingly powerful, lnav is one of the most underrated tools for developers, sysadmins, and anyone who regularly digs into logs. It turns your chaotic logs into something that’s not only readable—but genuinely useful.

What is lnav and why use it ?

lnav (Logfile Navigator) is a command-line tool for viewing and analyzing log files. It goes beyond tail, less, or grep by:

  • Automatically detecting and merging log formats.
  • Highlighting timestamps, log levels, and errors.
  • Providing SQL-like queries over your logs.
  • Offering interactive navigation with a UI inside the terminal.

And yes, all of that without needing to set up a database or a server.

1. Installing lnav on Linux

Installation is straightforward. On most systems, you can install it via package managers:

On Ubuntu/Debian:

# apt install lnav

On Fedora:

# dnf install lnav

On Arch Linux:

# pacman -S lnav

Or build from source via GitHub if you want the latest version.

2. Use lnav Instead of Tail / Grep why?

Traditional tools are powerful, but they require manual work to chain together functionality. lnav gives you:

  • Automatic multi-log parsing: Drop multiple logs in, and it merges them chronologically.
  • Syntax highlighting: Errors and warnings stand out.
  • SQL querying: Run queries like SELECT * FROM syslog_log WHERE log_level = 'error';
  • Filtering and searching: Use intuitive filters and bookmarks to highlight specific entries.

3. Basic tool Usage is simple

Let’s say you want to inspect a system log:

# lnav /var/log/syslog

You'll immediately get:

  • Color-coded output (timestamps, levels, messages).
  • Scrollable view (arrow keys, PgUp, PgDn).
  • Real-time updates (like tail -f).
  • Search with /, filter with :filter-in, and even SQL queries.

Lets say you need to analyze Apache webserver logs recursively including the logs already rotated and gunzipped with *.gz extension on CentOS / Fedora / RHEL, you can do it with:

# lnav -r /var/log/httpd

You can parse the log file and get additional information about requests as well as you can print overall summary of log file.

Choose the line you want to parse. The selected line is always the one at the top of the window. Then press 'p' and you should see the following result:

https://pc-freak.net/images/lnav-get-extra-information-about-apache-query-with-P-press-key-screenshot-linux

Now, if you want to see a summary view of the logs by date and time, simply press 'i'.

lnav-linux-apache-log-review-summary-of-errors-warnings-normal-screenshot

To quit a screen you have chosen press 'q'.

4. LNAV helpful options and hotkeys

Once you've opened a log file/s for analyze you can use few hotkeys that will allow us to move through the output of lnav and the available views more easily:

e or E to jump to the next / previous error message.
w or W to jump to the next / previous warning message.
b or Backspace to move to the previous page.
Space to move to the next page.
g or G to move to the top / bottom of the current view.

To take a closer look at the way lnav operates, use -d option, the debug information is to be spit inside a .txt file:

# lnav /var/log/httpd -d lnav.txt

In this example, the debug information that is generated when lnav starts will be written to a file named lnav.txt inside the current working directory.

5. Real-World Use Cases

a. Troubleshooting application or system process Crashes

Open all relevant logs in one go:

# lnav /var/log/*.log

Errors are highlighted, and you can jump between them with n / N kbd keys.

b. Combining Multiple Logs

Working with an app that logs to different files and you need to combine:

# lnav /var/log/nginx/access.log /var/log/nginx/error.log


Or lets say you want to combine Apache Webserver with Haproxy log and get log summaries or filter out stuff:

lnav /var/log/apache2/access.log /var/log/haproxy.log


Now you will get a single, chronological timeline of events.


If you want to Search for a concrete occurance of Error / Warning or IP address inside a bunch of loaded combined logs you can do it with the same command like in simple vim by pressing / (slash) from kbd and type out what you want to filter out to get shown.

c. Analyze SQL Queries Logs

Yes, you can actually do this by passing it query in its command prompt :

:.schema
:SELECT log_time, log_level, log_message FROM syslog_log WHERE log_level = 'error';

You get a table of filtered logs, sortable by columns.
 

6. lnav more usage command tips

  • :help — Opens the help menu.
  • :filter-in <string> — Show only lines matching <string>.
  • :filter-out <string> — Hide lines matching <string>.
  • :export-to <filename> — Export current view to a file.
  • :tag <tagname> — Tag lines for later reference.
  • q — Quit (but why would you want to?).


7. Using lnav as a pager for systemd-journald

journalctl | lnav
# journalctl -f | lnav
# journalctl -u ssh.service | lnav

https://pc-freak.net/images/lnav_sshservice-log-view-screenshot-linux
 

8. Use lnav to review remote ssh logs

Newer versions after 0.10 supports ssh protocol as well and theoretically should work:

# lnav user@server-name-here:/var/log/file.log


To read all logs inside /var/log

# lnav root@server-name-here:/var/log/
# lnav root@server-name-here:/var/log/*.err

9. Using lnav to view docker container logs

# docker logs 811ab84aa95l | lnav
# docker logs -f application | lnav

The latest version of lnav supports even the following  simplified docker:// URL syntax:

# lnav docker://{container_id_or_name}/dir_path/to/log/file
# lnav docker://{container_id_or_name}/var/dir_path/log
# lnav docker://application/var/log/
# lnav docker://applcation/var/log/nginx/nginx.app.log

10. Monitoring compilation and command output useful for developers
 

Compilation from archived tar balls with ./configure && make etc. generate lot of outputs and logs while working. 
Here is where the tool can come handy. 
For example, here is how to watch the output of make command when compiling something:

# lnav -e './configure && make'

 11. Learning lnav tool through online ssh service availability via lnav.org

f you're lazy to install it and want to test it anyways:
 

# Start The Basic Tutorial:
ssh -o PubkeyAuthentication=no -o PreferredAuthentications=password tutorial1@demo.lnav.org


# Playground:
ssh -o PubkeyAuthentication=no -o PreferredAuthentications=password playground@demo.lnav.org


Closure

While tools like Kibana, Grafana, and ELK stacks are powerful, they can be overkill for many use cases—especially when you're SSHed into a box and just need to get answers fast. That’s where lnav shines as it is fast, lightweight, visual and can be used offline.

If you’re a developer, sysadmin, SRE (Site Reliability Engineer), or just someone who cares about logs, give lnav a spin. It might just become among your favorite sysadm tools on Linux and safe you pretty much of time if you have to do log reading and analyzing on daily basis (for example if you're admining 20+ or more Linux servers.


Flush DNS on Mac OS X ,Windows and Linux from command line

Wednesday, January 8th, 2025

MAC OSX DNS Configuration | DNSFLEX


MAC OS X flush DNS cache


Open macOS /Mac OS X terminal application and type the following command under OS X version 10.5 and above:

# dscacheutil -flushcache

Mac OS X Tiger (v10.4) user, enter:

# lookupd -flushcache

macOS 11 Big Sur or 12 Monterey user, try:

# sudo dscacheutil -flushcache; sudo killall -HUP mDNSResponder


macOS 10.11 El Capitan, 10.12 Sierra, 10.13 High Sierra, 10.14 Mojave, or 10.15 Catalina user try:

# sudo killall -HUP mDNSResponder


On Mac OS X version 10.6 and onwards to dump DNS cached records
 

$ dscacheutil -cachedump -entries

Display your DNS cached records on Windows
 
Implement Windows Server DNS - Training | Microsoft Learn

  DNS cached records are stored to offload the DNS from querying it all the time in order to resolve the questionable site domain IP.

To view most recent cached DNS records on Windows use cmd:
 

c:\Windows\> ipconfig /displaydns


Windows IP Configuration

    array805.prod.do.dsp.mp.microsoft.com
    —————————————-
    Record Name . . . . . : array805.prod.do.dsp.mp.microsoft.com
    Record Type . . . . . : 1
    Time To Live  . . . . : 1894
    Data Length . . . . . : 4
    Section . . . . . . . : Answer
    A (Host) Record . . . : 52.143.124.236


    telemetry-incoming.r53-2.services.mozilla.com
    —————————————-
    Record Name . . . . . : telemetry-incoming.r53-2.services.mozilla.com
    Record Type . . . . . : 1
    Time To Live  . . . . : 444
    Data Length . . . . . : 4
    Section . . . . . . . : Answer
    A (Host) Record . . . : 34.120.208.123


    tunnel.googlezip.net
    —————————————-
    Record Name . . . . . : tunnel.googlezip.net
    Record Type . . . . . : 1
    Time To Live  . . . . : 36756
    Data Length . . . . . : 4

Use up/down scroll array to see the cached record you need to view in the DNS cache.
 

Flush DNS Cache on Windows OS


Open the terminal (Start > Run > type cmd and press the [Enter] key) and type the following command to flush DNS on Win XP/2000/7/10 etc:

# ipconfig /flushdns


How to Flush DNS local cache queries on Linux

How to Flush DNS Cache on Linux | Linux How to Flush DNS Guide


If you’re using a Linux distro such as Ubuntu, here’s how to flush the DNS cache:

Open the terminal by pressing Ctrl + Alt + T or searching for “Terminal” in the Activities menu.
Run the following command:
If you are running Ubuntu 20.04 LTS Linux or older Linux distro using systemd-resolve, use: sudo systemd-resolve –flush-caches.
If you are running Ubuntu 22.04 LTS or newer, use: sudo resolvectl flush-caches.
Enter your administrator password when prompted, and the DNS cache will be flushed.

To check the change in the DNS record is real, you can check the DNS cache statistics:

# resolvectl statistics

On older Linux distributions where /etc/resolv.conf nameserver directives are used to set the DNS for the server, to flush the cache
only options is to either flush the server used cache or change the nameserver inside the file.


Check the DNS cache records on older Linux distros (requires NSCD daemon)

Assuming the nscd daemon is UP and running (if not you have to install it) to check the cached local DNS records on Linux do

# service nscd status 


Reviewing Your DNS Cache on modern Linux distros

The systemd-resolved daemon reacts to USR1 by writing its cache to the system logs. We can then use the journalctl command to filter out the DNS entries.

We'll use the killall command with USR1 To send the signal to the systemd-resolved daemon. Note that although we're using the killall command, the systemd-resolved daemon continues to run. This isn't a termination signal that we're sending.

$ sudo killall -USR1 systemd-resolved

Now we'll use the journalctl command with the -u (filter by systemd unit) option to extract the log entries that have been generated by systemd-resolved . We'll redirect that output into a text files called "dns.txt."

$ sudo journalctl -u systemd-resolved > dns.txt

Then check the DNS records

$ less dns.txt


Then find the cached mappings between domain names and IP addresses in.

How to Flush the dnsmasq Cache on Linux

The dnsmasq application provides a DNS cache and a DHCP server.

dnsmasq is popular among with users who want to run their own DNS server, especially on non-systemd installations.

Flushing the dnsmasq DNS cache is easy. We need to send the SIGHUP signal, which tells the dnsmasq daemon to effectively reinitialize. Doing so clears its DNS cache. To send the signal we use the killall command with the -HUP flag, and the name of the application.

$ sudo killall -HUP dnsmasq

Monitor service log is continously growing with Zabbix on Windows with batch userparameter script and trigger Alert if log is unchanged

Thursday, March 17th, 2022

monitor-if-log-file-is-growing-with-zabbix-zabbix-userparameter-script-howto

Recently we had an inteteresting Monitoring work task to achieve. We have an Application that is constantly simulating encrypted connections traffic to a remote side machine and sending specific data on TCP/IP ports.
Communiucation between App Server A -> App Server B should be continous and if all is working as expected App Server A messages output are logged in the Application log file on the machine which by the way Runs
Windows Server 2020.

Sometimes due to Network issues this constant reconnections from the Application S. A to the remote checked machine TCP/IP ports gets interrupted due to LAN issues or a burned Network Switch equipment, misconfiguration on the network due to some Network admin making stoopid stuff etc..

Thus it was important to Monitor somehow whether the log is growing or not and feed the output of whether Application log file is growing or it stuck to a Central Zabbix Server. 
To be able to better understand the task, lets divide the desired outcome in few parts on required:

1. Find The latest file inside a folder C:\Path-to-Service\Monitoring\Log\
2. Open the and check it is current logged records and log the time
3. Re-open file in a short while and check whether in few seconds new records are written
4. Report the status out to Zabbix
5. Make Zabbix Item / Trigger / Action in case if monitored file is not growing

In below article I'll briefly explain how Monitoring a Log on a Machine for growing was implemented using a pure good old WIN .BAT (.batch) script and Zabbix Userparameter key


1. Enable userparameter script for Local Zabbix-Agent on the Windows 10 Server Host


Edit Zabbix config file usually on Windows Zabbix installs file is named:

zabbix_agentd.win ]


Uncomment the following lines to enable userparameter support for zabbix-agentd:


# Include=c:\zabbix\zabbix_agentd.userparams.conf

Include=c:\zabbix\zabbix_agentd.conf.d\

# Include=c:\zabbix\zabbix_agentd.conf.d\*.conf


2. Create folders for userparameter script and for the userparameter.conf

Before creating userparameter you can to create the folder and grant permissions

Folder name under C:\Zabbix -> zabbix_agentd.conf.d

If you don't want to use Windows Explorer) but do it via cmd line:

C:\Users\LOGUser> mkdir \Zabbix\zabbix_agentd.conf\
C:\User\LOGUser> mkdir \Zabbix\zabbix_scripts\


3. Create Userparameter with some name file ( Userparameter-Monitor-Grow.conf )

In the directory C:\Zabbix\zabbix_agentd.conf.d you should create a config file like:
Userparameter-Monitor-Grow.conf and in it you should have a standard userparameter key and script so file content is:

UserParameter=service.check,C:\Zabbix\zabbix_scripts\GROW_LOG_MONITOR-USERPARAMETER.BAT


4. Create the Batch script that will read the latest file in the service log folder and will periodically check and report to zabbix that file is changing

notepad C:\Zabbix\zabbix_scripts\GROW_LOG_MONITOR-USERPARAMETER.BAT

REM "SCRIPT MONITOR IF FILE IS GROWING OR NOT"
@echo off

set work_dir=C:\Path-to-Service\Monitoring\Log\

set client=client Name

set YYYYMMDD=%DATE:~10,4%%DATE:~4,2%%DATE:~7,2%

set name=csv%YYYYMMDD%.csv

set mytime=%TIME:~0,8%

for %%I in (..) do set CurrDirName=%%~nxI


setlocal EnableDelayedExpansion

set "line1=findstr /R /N "^^" %work_dir%\output.csv | find /C ":""


for /f %%a in ('!line1!') do set number1=%%a

set "line2=findstr /R /N "^^" %work_dir%\%name% | find /C ":""


for /f %%a in ('!line2!') do set number2=%%a


IF  %number1% == %number2% (

echo %YYYYMMDD% %mytime% MAJOR the log is not incrementing for %client%

echo %YYYYMMDD% %mytime% MAJOR the log is not incrementing for %client% >> monitor-grow_err.log

) ELSE (

echo %YYYYMMDD% %mytime% NORMAL the log is incrementing for %client%

SETLOCAL DisableDelayedExpansion

del %work_dir%\output.csv

FOR /F "usebackq delims=" %%a in (`"findstr /n ^^ %work_dir%\%name%"`) do (

    set "var=%%a"

    SETLOCAL EnableDelayedExpansion

    set "var=!var:*:=!"

    echo(!var! >> %work_dir%\output.csv

    ENDLOCAL

)

)


To download GROW_LOG_MONITOR-USERPARAMETER.BAT click here.
The script needs to have configured the path to directory containing multiple logs produced by the Monitored Application.
As prior said it will, list the latest created file based on DATE timestamp in the folder will output a simple messages:

If the log file is being fed with data the script will output to output.csv messages continuously, either:

%%mytime%% NORMAL the log is incrementing for %%client%%

Or if the Monitored application log is not writting anything for a period it will start writting messages

%%mytime%%mytime MAJOR the log is not incrementing for %client%

The messages will also be sent in Zabbix.

Before saving the script make sure you modify the Full Path location to the Monitored file for growing, i.e.:

set work_dir=C:\Path-to-Service\Monitoring\Log\


5. Create The Zabbix Item

Set whatever service.check name you would like and a check interval to fetch the info from the userparameter (if you're dealing with very large log files produced by Monitored log of application, then 10 minutes might be too frequent, in most cases 10 minutes should be fine)
monitor-if-log-grows-windows-zabbix-item-service-check-screenshot
 

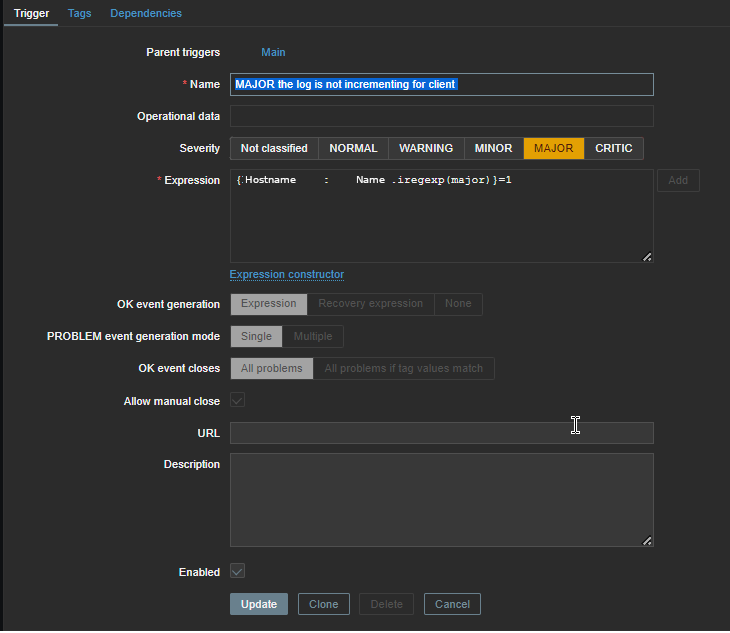
6. Create Zabbix Trigger


You will need a Trigger something similar to below:

Now considering that zabbix server receives correctly data from the client and the monitored log is growing you should in Zabbix:

%%mytime%% NORMAL the log is incrementing for %%client%%


7. Lastly create an Action to send Email Alert if log is not growing

How to filter dhcp traffic between two networks running separate DHCP servers to prevent IP assignment issues and MAC duplicate addresses

Tuesday, February 8th, 2022

how-to-filter-dhcp-traffic-2-networks-running-2-separate-dhcpd-servers-to-prevent-ip-assignment-conflicts-linux
Tracking the Problem of MAC duplicates on Linux routers
 

If you have two networks that see each other and they're not separated in VLANs but see each other sharing a common netmask lets say 255.255.254.0 or 255.255.252.0, it might happend that there are 2 dhcp servers for example (isc-dhcp-server running on 192.168.1.1 and dhcpd running on 192.168.0.1 can broadcast their services to both LANs 192.168.1.0.1/24 (netmask 255.255.255.0) and Local Net LAN 192.168.1.1/24. The result out of this is that some devices might pick up their IP address via DHCP from the wrong dhcp server.

Normally if you have a fully controlled little or middle class home or office network (10 – 15 electronic devices nodes) connecting to the LAN in a mixed moth some are connected via one of the Networks via connected Wifi to 192.168.1.0/22 others are LANned and using static IP adddresses and traffic is routed among two ISPs and each network can see the other network, there is always a possibility of things to go wrong. This is what happened to me so this is how this post was born.

The best practice from my experience so far is to define each and every computer / phone / laptop host joining the network and hence later easily monitor what is going on the network with something like iptraf-ng / nethogs  / iperf – described in prior  how to check internet spepeed from console and in check server internet connectivity speed with speedtest-cliiftop / nload or for more complex stuff wireshark or even a simple tcpdump. No matter the tools network monitoring is only part on solving network issues. A very must have thing in a controlled network infrastructure is defining every machine part of it to easily monitor later with the monitoring tools. Defining each and every host on the Hybrid computer networks makes administering the network much easier task and  tracking irregularities on time is much more likely. 

Since I have such a hybrid network here hosting a couple of XEN virtual machines with Linux, Windows 7 and Windows 10, together with Mac OS X laptops as well as MacBook Air notebooks, I have followed this route and tried to define each and every host based on its MAC address to pick it up from the correct DHCP1 server  192.168.1.1 (that is distributing IPs for Internet Provider 1 (ISP 1), that is mostly few computers attached UTP LAN cables via LiteWave LS105G Gigabit Switch as well from DHCP2 – used only to assigns IPs to servers and a a single Wi-Fi Access point configured to route incoming clients via 192.168.0.1 Linux NAT gateway server.

To filter out the unwanted IPs from the DHCPD not to propagate I've so far used a little trick to  Deny DHCP MAC Address for unwanted clients and not send IP offer for them.

To give you more understanding,  I have to clear it up I don't want to have automatic IP assignments from DHCP2 / LAN2 to DHCP1 / LAN1 because (i don't want machines on DHCP1 to end up with IP like 192.168.0.50 or DHCP2 (to have 192.168.1.80), as such a wrong IP delegation could potentially lead to MAC duplicates IP conflicts. MAC Duplicate IP wrong assignments for those older or who have been part of administrating large ISP network infrastructures  makes the network communication unstable for no apparent reason and nodes partially unreachable at times or full time …

However it seems in the 21-st century which is the century of strangeness / computer madness in the 2022, technology advanced so much that it has massively started to break up some good old well known sysadmin standards well documented in the RFCs I know of my youth, such as that every electronic equipment manufactured Vendor should have a Vendor Assigned Hardware MAC Address binded to it that will never change (after all that was the idea of MAC addresses wasn't it !). 
Many mobile devices nowadays however, in the developers attempts to make more sophisticated software and Increase Anonimity on the Net and Security, use a technique called  MAC Address randomization (mostly used by hackers / script kiddies of the early days of computers) for their Wi-Fi Net Adapter OS / driver controlled interfaces for the sake of increased security (the so called Private WiFi Addresses). If a sysadmin 10-15 years ago has seen that he might probably resign his profession and turn to farming or agriculture plant growing, but in the age of digitalization and "cloud computing", this break up of common developed network standards starts to become the 'new normal' standard.

I did not suspected there might be a MAC address oddities, since I spare very little time on administering the the network. This was so till recently when I accidently checked the arp table with:

Hypervisor:~# arp -an
192.168.1.99     5c:89:b5:f2:e8:d8      (Unknown)
192.168.1.99    00:15:3e:d3:8f:76       (Unknown)

..


and consequently did a network MAC Address ARP Scan with arp-scan (if you never used this little nifty hacker tool I warmly recommend it !!!)
If you don't have it installed it is available in debian based linuces from default repos to install

Hypervisor:~# apt-get install –yes arp-scan


It is also available on CentOS / Fedora / Redhat and other RPM distros via:

Hypervisor:~# yum install -y arp-scan


Hypervisor:~# arp-scan –interface=eth1 192.168.1.0/24

192.168.1.19    00:16:3e:0f:48:05       Xensource, Inc.
192.168.1.22    00:16:3e:04:11:1c       Xensource, Inc.
192.168.1.31    00:15:3e:bb:45:45       Xensource, Inc.
192.168.1.38    00:15:3e:59:96:8e       Xensource, Inc.
192.168.1.34    00:15:3e:d3:8f:77       Xensource, Inc.
192.168.1.60    8c:89:b5:f2:e8:d8       Micro-Star INT'L CO., LTD
192.168.1.99     5c:89:b5:f2:e8:d8      (Unknown)
192.168.1.99    00:15:3e:d3:8f:76       (Unknown)

192.168.x.91     02:a0:xx:xx:d6:64        (Unknown)
192.168.x.91     02:a0:xx:xx:d6:64        (Unknown)  (DUP: 2)

N.B. !. I found it helpful to check all available interfaces on my Linux NAT router host.

As you see the scan revealed, a whole bunch of MAC address mess duplicated MAC hanging around, destroying my network topology every now and then 
So far so good, the MAC duplicates and strangely hanging around MAC addresses issue, was solved relatively easily with enabling below set of systctl kernel variables.
 

1. Fixing Linux ARP common well known Problems through disabling arp_announce / arp_ignore / send_redirects kernel variables disablement


Linux answers ARP requests on wrong and unassociated interfaces per default. This leads to the following two problems:

ARP requests for the loopback alias address are answered on the HW interfaces (even if NOARP on lo0:1 is set). Since loopback aliases are required for DSR (Direct Server Return) setups this problem is very common (but easy to fix fortunately).

If the machine is connected twice to the same switch (e.g. with eth0 and eth1) eth2 may answer ARP requests for the address on eth1 and vice versa in a race condition manner (confusing almost everything).

This can be prevented by specific arp kernel settings. Take a look here for additional information about the nature of the problem (and other solutions): ARP flux.

To fix that generally (and reboot safe) we  include the following lines into


Hypervisor:~# cp -rpf /etc/sysctl.conf /etc/sysctl.conf_bak_07-feb-2022
Hypervisor:~# cat >> /etc/sysctl.conf

# LVS tuning
net.ipv4.conf.lo.arp_ignore=1
net.ipv4.conf.lo.arp_announce=2
net.ipv4.conf.all.arp_ignore=1
net.ipv4.conf.all.arp_announce=2

net.ipv4.conf.all.send_redirects=0
net.ipv4.conf.eth0.send_redirects=0
net.ipv4.conf.eth1.send_redirects=0
net.ipv4.conf.default.send_redirects=0

Press CTRL + D simultaneusly to Write out up-pasted vars.


To read more on Load Balancer using direct routing and on LVS and the arp problem here


2. Digging further the IP conflict / dulicate MAC Problems

Even after this arp tunings (because I do have my Hypervisor 2 LAN interfaces connected to 1 switch) did not resolved the issues and still my Wireless Connected devices via network 192.168.1.1/24 (ISP2) were randomly assigned the wrong range IPs 192.168.0.XXX/24 as well as the wrong gateway 192.168.0.1 (ISP1).
After thinking thoroughfully for hours and checking the network status with various tools and thanks to the fact that my wife has a MacBook Air that was always complaining that the IP it tried to assign from the DHCP was already taken, i"ve realized, something is wrong with DHCP assignment.
Since she owns a IPhone 10 with iOS and this two devices are from the same vendor e.g. Apple Inc. And Apple's products have been having strange DHCP assignment issues from my experience for quite some time, I've thought initially problems are caused by software on Apple's devices.
I turned to be partially right after expecting the logs of DHCP server on the Linux host (ISP1) finding that the phone of my wife takes IP in 192.168.0.XXX, insetad of IP from 192.168.1.1 (which has is a combined Nokia Router with 2.4Ghz and 5Ghz Wi-Fi and LAN router provided by ISP2 in that case Vivacom). That was really puzzling since for me it was completely logical thta the iDevices must check for DHCP address directly on the Network of the router to whom, they're connecting. Guess my suprise when I realized that instead of that the iDevices does listen to the network on a wide network range scan for any DHCPs reachable baesd on the advertised (i assume via broadcast) address traffic and try to connect and take the IP to the IP of the DHCP which responds faster !!!! Of course the Vivacom Chineese produced Nokia router responded DHCP requests and advertised much slower, than my Linux NAT gateway on ISP1 and because of that the Iphone and iOS and even freshest versions of Android devices do take the IP from the DHCP that responds faster, even if that router is not on a C class network (that's invasive isn't it??). What was even more puzzling was the automatic MAC Randomization of Wifi devices trying to connect to my ISP1 configured DHCPD and this of course trespassed any static MAC addresses filtering, I already had established there.

Anyways there was also a good think out of tthat intermixed exercise 🙂 While playing around with the Gigabit network router of vivacom I found a cozy feature SCHEDULEDING TURNING OFF and ON the WIFI ACCESS POINT  – a very useful feature to adopt, to stop wasting extra energy and lower a bit of radiation is to set a swtich off WIFI AP from 12:30 – 06:30 which are the common sleeping hours or something like that.
 

3. What is MAC Randomization and where and how it is configured across different main operating systems as of year 2022?

Depending on the operating system of your device, MAC randomization will be available either by default on most modern mobile OSes or with possibility to have it switched on:

  • Android Q: Enabled by default 
  • Android P: Available as a developer option, disabled by default
  • iOS 14: Available as a user option, disabled by default
  • Windows 10: Available as an option in two ways – random for all networks or random for a specific network

Lately I don't have much time to play around with mobile devices, and I do not my own a luxury mobile phone so, the fact this ne Androids have this MAC randomization was unknown to me just until I ended a small mess, based on my poor configured networks due to my tight time constrains nowadays.

Finding out about the new security feature of MAC Randomization, on all Android based phones (my mother's Nokia smartphone and my dad's phone, disabled the feature ASAP:


4. Disable MAC Wi-Fi Ethernet device Randomization on Android

MAC Randomization creates a random MAC address when joining a Wi-Fi network for the first time or after “forgetting” and rejoining a Wi-Fi network. It Generates a new random MAC address after 24 hours of last connection.

Disabling MAC Randomization on your devices. It is done on a per SSID basis so you can turn off the randomization, but allow it to function for hotspots outside of your home.

  1. Open the Settings app
  2. Select Network and Internet
  3. Select WiFi
  4. Connect to your home wireless network
  5. Tap the gear icon next to the current WiFi connection
  6. Select Advanced
  7. Select Privacy
  8. Select "Use device MAC"
     

5. Disabling MAC Randomization on MAC iOS, iPhone, iPad, iPod

To Disable MAC Randomization on iOS Devices:

Open the Settings on your iPhone, iPad, or iPod, then tap Wi-Fi or WLAN


  1. Tap the information button next to your network
  2. Turn off Private Address
  3. Re-join the network


Of course next I've collected their phone Wi-Fi adapters and made sure the included dhcp MAC deny rules in /etc/dhcp/dhcpd.conf are at place.

The effect of the MAC Randomization for my Network was terrible constant and strange issues with my routings and networks, which I always thought are caused by the openxen hypervisor Virtualization VM bugs etc.

That continued for some months now, and the weird thing was the issues always started when I tried to update my Operating system to the latest packetset, do a reboot to load up the new piece of software / libraries etc. and plus it happened very occasionally and their was no obvious reason for it.


6. How to completely filter dhcp traffic between two network router hosts
IP 192.168.0.1 / 192.168.1.1 to stop 2 or more configured DHCP servers
on separate networks see each other

To prevent IP mess at DHCP2 server side (which btw is ISC DHCP server, taking care for IP assignment only for the Servers on the network running on Debian 11 Linux), further on I had to filter out any DHCP UDP traffic with iptables completely.
To prevent incorrect route assignments assuming that you have 2 networks and 2 routers that are configurred to do Network Address Translation (NAT)-ing Router 1: 192.168.0.1, Router 2: 192.168.1.1.

You have to filter out UDP Protocol data on Port 67 and 68 from the respective source and destination addresses.

In firewall rules configuration files on your Linux you need to have some rules as:

# filter outgoing dhcp traffic from 192.168.1.1 to 192.168.0.1
-A INPUT -p udp -m udp –dport 67:68 -s 192.168.1.1 -d 192.168.0.1 -j DROP
-A OUTPUT -p udp -m udp –dport 67:68 -s 192.168.1.1 -d 192.168.0.1 -j DROP
-A FORWARD -p udp -m udp –dport 67:68 -s 192.168.1.1 -d 192.168.0.1 -j DROP

-A INPUT -p udp -m udp –dport 67:68 -s 192.168.0.1 -d 192.168.1.1 -j DROP
-A OUTPUT -p udp -m udp –dport 67:68 -s 192.168.0.1 -d 192.168.1.1 -j DROP
-A FORWARD -p udp -m udp –dport 67:68 -s 192.168.0.1 -d 192.168.1.1 -j DROP

-A INPUT -p udp -m udp –sport 67:68 -s 192.168.1.1 -d 192.168.0.1 -j DROP
-A OUTPUT -p udp -m udp –sport 67:68 -s 192.168.1.1 -d 192.168.0.1 -j DROP
-A FORWARD -p udp -m udp –sport 67:68 -s 192.168.1.1 -d 192.168.0.1 -j DROP


You can download also filter_dhcp_traffic.sh with above rules from here


Applying this rules, any traffic of DHCP between 2 routers is prohibited and devices from Net: 192.168.1.1-255 will no longer wrongly get assinged IP addresses from Network range: 192.168.0.1-255 as it happened to me.


7. Filter out DHCP traffic based on MAC completely on Linux with arptables

If even after disabling MAC randomization on all devices on the network, and you know physically all the connecting devices on the Network, if you still see some weird MAC addresses, originating from a wrongly configured ISP traffic router host or whatever, then it is time to just filter them out with arptables.

## drop traffic prevent mac duplicates due to vivacom and bergon placed in same network – 255.255.255.252
dchp1-server:~# arptables -A INPUT –source-mac 70:e2:83:12:44:11 -j DROP


To list arptables configured on Linux host

dchp1-server:~# arptables –list -n


If you want to be paranoid sysadmin you can implement a MAC address protection with arptables by only allowing a single set of MAC Addr / IPs and dropping the rest.

dchp1-server:~# arptables -A INPUT –source-mac 70:e2:84:13:45:11 -j ACCEPT
dchp1-server:~# arptables -A INPUT  –source-mac 70:e2:84:13:45:12 -j ACCEPT


dchp1-server:~# arptables -L –line-numbers
Chain INPUT (policy ACCEPT)
1 -j DROP –src-mac 70:e2:84:13:45:11
2 -j DROP –src-mac 70:e2:84:13:45:12

Once MACs you like are accepted you can set the INPUT chain policy to DROP as so:

dchp1-server:~# arptables -P INPUT DROP


If you later need to temporary, clean up the rules inside arptables on any filtered hosts flush all rules inside INPUT chain, like that
 

dchp1-server:~#  arptables -t INPUT -F

A quick and easy way to install Social Network on Linux/BSD System with Elgg

Monday, March 14th, 2011

elgg-blue-logo
I'm experimenting this days with Elgg – An Open Source Free Software GPLed Social Network which enables users to quickly create Communities.

Elgg is really easy to install and all it requires is a Linux/BSD or Windows system with PHP, MySQL and Apache installed.

Elgg is provided with dozens of nice plugins which for a short time enables individual to create fully operational Social Network like facebook.

Many people nowdays use facebook without realizing how bad facebook is how it breaks their privacy.
Facebook is actually a spy network, it stores data and pictures, likings and user behaviour of million of users around the world.
This needs to be stopped somehow, maybe if people start using the free software networks like elgg to build a mini-community which has profound interests in a certain spheres of work, life and amusement.
The evil empire of facebook will slowly start to loose it's position and the small projects networks based on Elgg and the other Free Software Social Networks which are currently available will start to rise up.
I'm currently really a novice into Elgg but I'm more convinced that the guys who develop it and contribute to it in terms of handy plugins have done really a great job.

It's ultra easy even for non professional middle level user to setup himself an Elgg install.
The installation procedure is not much harder than a simple wordpress blog or joomla based website install.
The installation of elgg takes no more than 10 to 20 minutes, the plugin installation and setup time further could take few days but in the end you have a full featured Social Network! This is really amazing.
The installation of new plugins in elgg is also fool proof / easy all you have to do to equip a newly installed elgg with plugins is to go to it's root directory and look for the mod directory. The new plugins which needs to be installed, could be directly downloaded and saved via links, elinks, lynx or even wget to the elgg installation directory.

Most of the elgg plugins comes in a form of zip files so after being installed simply executing:

server:/home/elgg/mysocialnetwork/mod# unzip walltowall.zip
....

The above cmd will for example unzip the WallToWall elgg plugin and the plugin will be further ready to be enabled via the administrator user set upped during your elgg installation.

The configurations of elgg are being accomplished via:

Administration -> Tool Administration

I should I'm still experimenting with Elgg social, until this very moment I've installed the following elgg plugins:

aaudio
akismet
artfolio
blog
bookmarks
buddytalk
captcha
categories
chat
crontrigger
custom_index
custom_profile_fields
default_widgets
diagnostics
elgg-ebuddy
embed
embedvideo
emoticons
externalpages
family
fbconnect
file
file_tree
flyers
forum
friend_request
friends
garbagecollector
groups
htmlawed
invitations
invitefriends
izap_videos
kaltura_video
lastfm
likes
logbrowser
logrotate
lucygames
members
messageboard
messages
milockergames_frameme
noscript_message
notifications
pages
polls
profile
reportedcontent
resume
river_comments
riverdashboard
riverfaces
search
siteaccess
tagcloud
theme_simpleneutral
thewire
tidypics
tidypicsExt
tinymce
twitter
twitterservice
user_contact_list
uservalidationbyemail
walltowall
weather
wp1
zaudio

One very handy feature I truly enjoy about Elgg is that it gives every user an own blog which or in other words when somebody registers in Elgg, he automatically gets a personal blog! How cool this is Yeash 😉
The Elgg photo upload plugin is also another interesting story. The photo plugin is a way better from my first impressions than facebook's buggy upload client.
Elgg also uses heavily jquery for it's various operations and the user experience feels very interactive.

Of course as with all free software things are not perfect some of the elgg plugins or (mods) as they are called are not working.
For example I couldn't make by so far the weather plugin which is supposed to report the weather.

Maybe some tweakening of the not working plugins will easily make them working. What is really important is that the Elgg basis system looks and seems to work really good and enpowers the user with a social network alternatives to the ugly facebook.

In order to experiment with Elgg and I've established a small social network targetting at University College and School Students called MockATeacher – mockateacher.com>/i>. The idea behind is to help students in their report writting by providing them with a place where they can meet other students and share files.

Some other aspects I've planned for MockATeacher is to build a small community of people who would like to share about idiot teachers, teacher stupid sayings as well as to mock the idiotic type of education that we and our children are up to in this age.
Just to close up, if you're looking for some time to spend in experimenting in an enjoyable way you definitely need to install elgg and play with it 😉