Posts Tagged ‘and’

How to split large files in Windows via split command line and File Archive GUI tool easily

Tuesday, October 22nd, 2024

Moving around a very large files especially Virtualbox Virtual Machines or other VM formats between Windows host and OneDrive might be a problem due to either Azure Cloud configured limitations, or other reasons that your company Domain Administrator has configured, thus if you have to migrate your old Hardware Laptop PC Windows 10 to a newer faster better Harware / Better Performance Notebook Computer with Windows 11 and you still want to keep and move your old large files in this short and trivial article, will explain how.

The topic is easily and most of novice sysadmins should have already be faced to bump into something like this but anyways i found useful to mention about Git for Windows, as it is really useful too thus wrote this small article.

The moved huge files, in my case an experimental Virtual Machines Images which I needed to somehow migrate on the new Freshly installed Windows laptop, the Large files were 40 / 80 etc. Gigabytes or whatever large amount of files from your PC to the Cloud Onedrive and of course the most straight forward thing i tried was to simply add the file for inclusion into the Onedrive storage (via OneDrive tool setup interface), however this file, failed due to OneDrive Cloud file format security limitations or Antivirus solutions configured to filter out the large file copying or even a prohibition to be able to include any kind of Virtual Machines ISOs straight into the cloud.

With this big files comes the question:

How to copy the Virtual Machines from your Old Hardware Laptop to the Cloud (without being able to use an external SSD Hard Drive or a USB SSD Flash drive, due to Domain policy configured for your windows to be unable to copy to externally connected Drive but only to read from such.) ?
 

Here are few sample approaches to do it both from command line (useful if you have to repeat the process or script it and deploy to multiple hosts) or for single hosts via an Archiver tool:


1. Using split command Git for Windows (Bash) MINGW64 shell 

Download Git for Windows – https://git-scm.com/download install it and you will get the MINGW64 bash for Windows executable.

Run it either invoke bash command from command line or trigger Windows Run command prompt (Windows button + R) and type full path to executable
 

C:\Program Files\Git\git-bash.exe


Git-for-Windows-bash-for-windows-MINGW64-windows-11-screenshot

Use the integrated program split and to cut it into pieces use:


# split MyVeryLargeFileVM.vdi -b 800m


To split the .VDI virtualbox file to lets say 5 Gigabite pieces:

# split MyVeryLargeFile.vdi -b 5g

The output files will be named pieces will be named as in a normal UNIX / GNU split command in the format and each piece of 5GB will be named like:

xaa
xab
xac
xad

If you want to get a more meaningful name for the spilitted files you can set a generated split file prefix with suffixes to be 5 digits long:

# split MyVeryLargeFile.vdi MyVeryLargeFileVM-parts_ -b 5g -d -a 5

  • the -d flag for using numerical suffixes (instead of default aa, ab, ac, etc…),
  • and the option -a 5 to tell it I want the suffixes to be 5 digits long:

2. Split large files by Archiving them with Winrar (ShareWare) tool

If you have already Winrar installed and you don't want to bother with too much typing from the command line, You can use good old WinRAR as a file splitter/joiner as well.

To split a file into smaller files, select "Store" as the compression method and enter the desired value (bytes) into "Split to volumes" box.
This way you can have split files named as filename.part1.rar, filename.part2.rar, etc.

WinRAR_cut-split-large-files-into-pieces-screenshot-Windows

3. Split files with 7-Zip (FreeWare)

Assuming you have the 7-Zip installed on the PC, you can do the archiving of the Big file to a smaller pieces one, you can create the splitted file from 7Zip interfaces menus:

7zip-file-split-files-into-multiple-pieces-windows-screenshot

Or directly cut the single file into multiple volumes, directly from Windows Explorer by Selecting the file and using fall down menus :
7zip-creation-of-multiple-parts-file-from-single-one-screenshot-Windows

7-zip-split-huge-files-to-lower-parts-set-volume-size

Sum it up what learned ? 

What we learned is how to cut large files into multiple single consequential ones for easy copy between Network sides, via both Git 4 Windows and manual copy paste of parted multiple files to OneDrive / DropBox / pCloud or Google Drive.
There is a plenty of other approaches to take as there is also file GUI tools, besides using GNU Win / Gnu Tools for Windows or Cygwin / Gsplit GUI tool  or some kind of the many Archiver toolsavailable for Windows, another option to split the large files is to use a bunch of PowerShell and Batch scripts written that can help you do the file split for both binaries files or Text files. but i'll stop here as I believe that is pretty much enough for most basic needs.


How to Copy / Backup Windows USB drive from one USB to a second

Friday, October 18th, 2024

Did you know that when you copy all the files from a USB Drive you don’t copy all the data?

Did you know that there may be files that are not even visible?

In this tutorial you will discover how to copy all of your USB Drive sector by sector, that is to say, that you will see how to create a copy identical to your USB drive without missing anything!

This can be useful if you have formatted your USB stick in error and want to use it, you can create an image for the USB Drive on your computer and then you can recover the formatted data in the image afterward!

The software used in this tutorial is called ImageUSB, it is free, portable, and easy to use.

Don’t use this method if you want only to copy some files, use this to clone/backup your USB Drive with all its master boot record, partition tables, and data.

Let’s go!

Clone Your USB Drive with ImageUSB on Windows 10

Start by downloading and extracting ImageUSB from this official URL: https://www.osforensics.com/tools/write-usb-images.html

Double-click on  imageUSB.exe .

Select your USB Drive from the list, select “Create image from USB drive“. Choose the location for the binary image file (.bin) that will be created from the USB drive.

Click on “Create“.Click “Yes” to confirm your choices.

imageusb clone usb flash drive backup restore 3 create image

Click “Yes” to overwrite the bin file in case it’s already there.

Wait for a couple of minutes…

After the image is created you should see this message. Click “OK“.

Now if you want to restore an image to your USB Drive, just select your USB Drive and choose “Write image to USB drive“. Choose your bin image and click on “Write“.

imageusb clone usb flash drive backup restore 7 write

This program is not recommended on different sizes USB Drives…
Use it mostly for backup/restore on the same USB Drive for your bootable software.

There you have it, the copy of USB to second USB completed !

Enjoy ! 


All Debian Linux package repository apt sources.list file for Debian versions 6, 7, 8, 9, 10, 11 and 12

Friday, May 31st, 2024

debian-package-management-repositories-for-all-distributions

If you have to administrate legacy Debian servers, that keeps hanging either for historical reasons or just because you didn't have time to upgrade it up to latest versions, machines that are hanging in the hangar or a mid office building Old server room, doing nothing but simply NAT (Network Address Translation), Proxying, serving  traffic via Squid / Haproxy / Apache / Varnish or Nginx server but you still want to have the possibility to extend the OS even though it is out of date / End of Life reached and out of support as well as perhaps full of security holes, but due to its unvisibility on the Internet hanging in a Demilitarized network the machine stayed on the Local (DMZ)-ed network and still for example you need to install simple things for administration reasons locally on the machine, for example nmap or netcat or some of the network tools for monitoring such as iftop or iptraf etc. you might find out unfortunately that this is not possible anymore, because the configured /etc/apt/sources.list repository mirror is no longer available at its URL. Thus to restore the functioning of apt and apt-get pkg management tools on Debian you need to correct the broken missing package mirrors due to resructurings on the network with a correct ones, originally provided by Debian or eventually if this doesn't work a possible Debian package archive URL. 

In this article, I'll simply provide such URLs you might use to correct your no longer functioning package manager due to package repositoriy unavailibility, below are the URLs (most of which that should be working as of year 2024). To resolve the issues edit and place the correct Debian version you're using.

1. Check the version of the Debian Linux

# cat /etc/debian_version


or use the universal way to check the linux OS, that should be working on almost all Linux distributions

# cat /etc/issue
Debian GNU/Linux 9 \n \l

2. Modify /etc/apt/sources.list and place URL according to Debian distro version

# vim /etc/apt/sources.list


3. Repositories URL list Original and Archived for .deb packages according to Debian distro release
Debian 6 (Wheezy)

Original repostiroes (Not Available and Not working anymore as of year 2024)


Old Archived .deb repository for 6 Squeeze

deb http://archive.debian.org/debian squeeze main
deb http://archive.debian.org/debian squeeze-lts main


​Debian 7 (Wheezy)

Original repostiroes (Not Available and Not working anymore as of year 2024)

Old Archived .deb repository for Jessie (still working as of 2024) :

deb http://archive.debian.org/debian wheezy main contrib non-free
deb http://archive.debian.org/debian-security wheezy/updates main

( Security updates are not provided anymore.)

NOTE:  If you get an error about keyrings, just install it
 

# apt-get install debian-archive-keyring


Debian 8 (Jessie)
Original .deb package repository with non-free included for Debian 8 "Jessie"

deb http://deb.debian.org/debian/ jessie main contrib non-free
deb http://ftp.debian.org/debian/ jessie-updates main contrib
deb http://security.debian.org/ jessie/updates main contrib non-free

Old Archived .deb repository for 8 Jessie (still working as of 2024):

deb http://archive.debian.org/debian/ jessie main non-free contrib
deb-src http://archive.debian.org/debian/ jessie main non-free contrib
deb http://archive.debian.org/debian-security/ jessie/updates main non-free contrib
deb-src http://archive.debian.org/debian-security/ jessie/updates main non-free contrib


# echo "Acquire::Check-Valid-Until false;" | tee -a /etc/apt/apt.conf.d/10-nocheckvalid

# apt-get update

# apt-get update && apt-get upgrade


 If you need backports, first be warned that these are archived and no longer being updated; they may have security bugs or other major issues. They are not supported in any way.

deb http://archive.debian.org/debian/ jessie-backports main


Debian 9 (Stretch)
Original .deb package repository with non-free included for Debian 9 "Stretch":


deb http://deb.debian.org/debian/ stretch main contrib non-free
deb http://deb.debian.org/debian/ stretch-updates main contrib non-free
deb http://security.debian.org/ stretch/updates main contrib non-free

Archived old repository .deb for Stretch :

deb http://archive.debian.org/debian/ stretch main contrib non-free
deb http://archive.debian.org/debian/ stretch-proposed-updates main contrib non-free
deb http://archive.debian.org/debian-security stretch/updates main contrib non-free


Debian 10 (Buster)
Origian repository URL:

deb http://deb.debian.org/debian/ buster main non-free contrib
deb http://deb.debian.org/debian/ buster-updates main non-free contrib
deb http://security.debian.org/ buster/updates main non-free contrib


Fixing unworking backports for Debian 10 Buster


Change the /etc/apt/sources.list URL with this one

deb http://archive.debian.org/debian buster-backports main contrib non-free


If you want to list packages installed via the backports repository only, that needs to be replaced with newer versions (if such available from the repository)

# apt list –installed | grep backports
# dpkg –list | grep bpo
# dpkg –list | grep -E '^ii.*bpo.*'

ii  libpopt0:amd64                        1.18-2                         amd64        lib for parsing cmdline parameters
ii  libuutil3linux                        2.0.3-9~bpo10+1                amd64        Solaris userland utility library for Linux
ii  libzfs4linux                          2.0.3-9~bpo10+1                amd64        OpenZFS filesystem library for Linux


Debian 11 (Bullseye)
Origianl repository address:

deb http://deb.debian.org/debian bullseye main contrib non-free
deb http://deb.debian.org/debian bullseye-updates main contrib non-free
deb http://security.debian.org/debian-security bullseye-security main contrib non-free

Debian 12 (Bookworm)
Original Repository :


deb http://deb.debian.org/debian bookworm main contrib non-free-firmware non-free
deb http://deb.debian.org/debian bookworm-updates main contrib non-free-firmware non-free
deb http://security.debian.org/debian-security bookworm-security main contrib non-free-firmware non-free

Add Backports to sources.list

deb http://deb.debian.org/debian bookworm-backports main


Thats all, hopefully that would help some sysadmin out there. Enjoy !

Improve haproxy logging with custom log-format for better readiability

Friday, April 12th, 2024

Haproxy logging is a very big topic, worthy of many articles, but unfortunately not enough is written on the topic, perhaps for the reason haproxy is free software and most people who use it doesn't follow the philosophy of free software sharing but want to keep, the acquired knowledge on the topic for their own and if possible in the capitalist world most of us live to use it for a Load Balancer haproxy consultancy, consultancy fee or in their daily job as system administrators (web and middleware) or cloud specialist etc. 🙂

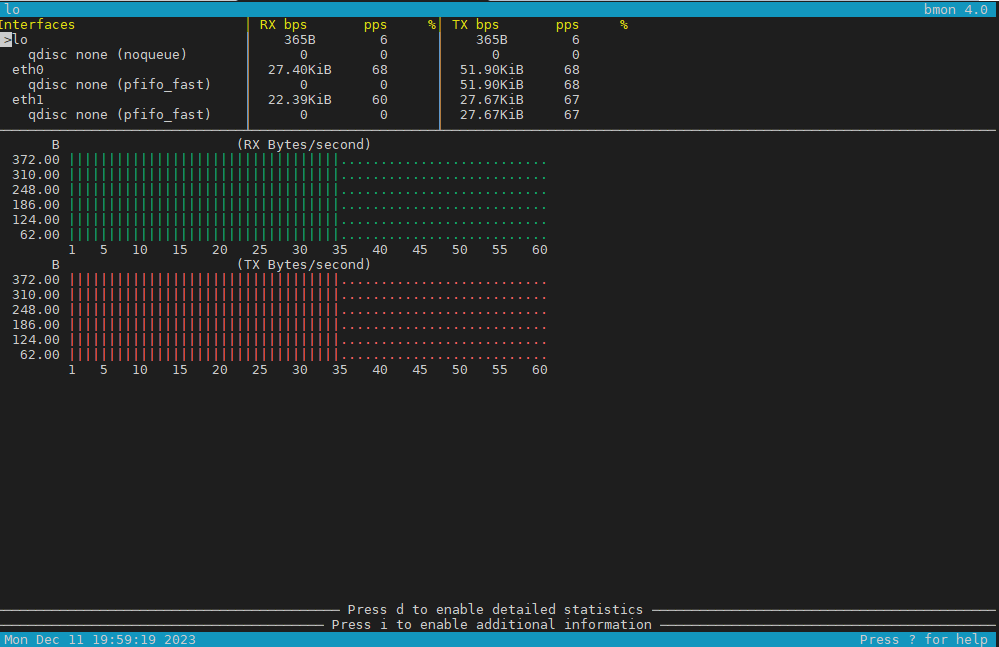
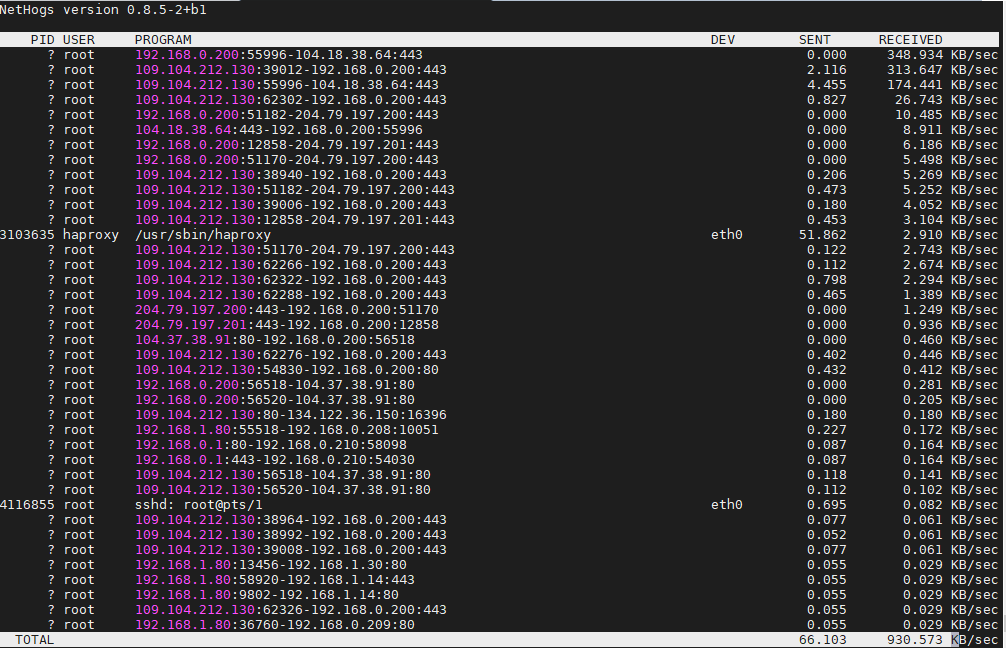
Having a good haproxy logging is very important as you need to debug issues with backend machines or some other devices throwing traffic to the HA Proxy.
Thus it is important to build a haproxy logging in a way that it provides most important information and the information is as simple as possible, so everyone can understand what is in without much effort and same time it contains enough debug information, to help you if you want to use the output logs with Graylog filters or process data with some monitoring advanced tool as Prometheus etc.

In our effort to optimize the way haproxy logs via a configured handler that sends the haproxy output to logging handler configured to log through rsyslog, we have done some experiments with logging arguments and came up with few variants, that we liked. In that article the idea is I share this set of logging  parameters with hope to help some other guy that starts with haproxy to build a good logging readable and easy to process with scripts log output from haproxy.

The criterias for a decent haproxy logging used are:

1. Log should be simple but not dumb
2. Should be concrete (and not too much complicated)
3. Should be easy to read for the novice and advanced sysadmin

Before starting, have to say that building the logging format seems tedious task but to make it fit your preference could take a lot of time, especially as logging parameters naming is hard to remember, thus the haproxy logging documentation log-format description table comes really handy:

Haproxy log-format paremeters ASCII table
 

 Please refer to the table for log-format defined variables :
 

+---+------+-----------------------------------------------+-------------+
| R | var  | field name (8.2.2 and 8.2.3 for description)  | type        |
+---+------+-----------------------------------------------+-------------+
|   | %o   | special variable, apply flags on all next var |             |
+---+------+-----------------------------------------------+-------------+
|   | %B   | bytes_read           (from server to client)  | numeric     |
| H | %CC  | captured_request_cookie                       | string      |
| H | %CS  | captured_response_cookie                      | string      |
|   | %H   | hostname                                      | string      |
| H | %HM  | HTTP method (ex: POST)                        | string      |
| H | %HP  | HTTP request URI without query string (path)  | string      |
| H | %HQ  | HTTP request URI query string (ex: ?bar=baz)  | string      |
| H | %HU  | HTTP request URI (ex: /foo?bar=baz)           | string      |
| H | %HV  | HTTP version (ex: HTTP/1.0)                   | string      |
|   | %ID  | unique-id                                     | string      |
|   | %ST  | status_code                                   | numeric     |
|   | %T   | gmt_date_time                                 | date        |
|   | %Ta  | Active time of the request (from TR to end)   | numeric     |
|   | %Tc  | Tc                                            | numeric     |
|   | %Td  | Td = Tt - (Tq + Tw + Tc + Tr)                 | numeric     |
|   | %Tl  | local_date_time                               | date        |
|   | %Th  | connection handshake time (SSL, PROXY proto)  | numeric     |
| H | %Ti  | idle time before the HTTP request             | numeric     |
| H | %Tq  | Th + Ti + TR                                  | numeric     |
| H | %TR  | time to receive the full request from 1st byte| numeric     |
| H | %Tr  | Tr (response time)                            | numeric     |
|   | %Ts  | timestamp                                     | numeric     |
|   | %Tt  | Tt                                            | numeric     |
|   | %Tw  | Tw                                            | numeric     |
|   | %U   | bytes_uploaded       (from client to server)  | numeric     |
|   | %ac  | actconn                                       | numeric     |
|   | %b   | backend_name                                  | string      |
|   | %bc  | beconn      (backend concurrent connections)  | numeric     |
|   | %bi  | backend_source_ip       (connecting address)  | IP          |
|   | %bp  | backend_source_port     (connecting address)  | numeric     |
|   | %bq  | backend_queue                                 | numeric     |
|   | %ci  | client_ip                 (accepted address)  | IP          |
|   | %cp  | client_port               (accepted address)  | numeric     |
|   | %f   | frontend_name                                 | string      |
|   | %fc  | feconn     (frontend concurrent connections)  | numeric     |
|   | %fi  | frontend_ip              (accepting address)  | IP          |
|   | %fp  | frontend_port            (accepting address)  | numeric     |
|   | %ft  | frontend_name_transport ('~' suffix for SSL)  | string      |
|   | %lc  | frontend_log_counter                          | numeric     |
|   | %hr  | captured_request_headers default style        | string      |
|   | %hrl | captured_request_headers CLF style            | string list |
|   | %hs  | captured_response_headers default style       | string      |
|   | %hsl | captured_response_headers CLF style           | string list |
|   | %ms  | accept date milliseconds (left-padded with 0) | numeric     |
|   | %pid | PID                                           | numeric     |
| H | %r   | http_request                                  | string      |
|   | %rc  | retries                                       | numeric     |
|   | %rt  | request_counter (HTTP req or TCP session)     | numeric     |
|   | %s   | server_name                                   | string      |
|   | %sc  | srv_conn     (server concurrent connections)  | numeric     |
|   | %si  | server_IP                   (target address)  | IP          |
|   | %sp  | server_port                 (target address)  | numeric     |
|   | %sq  | srv_queue                                     | numeric     |
| S | %sslc| ssl_ciphers (ex: AES-SHA)                     | string      |
| S | %sslv| ssl_version (ex: TLSv1)                       | string      |
|   | %t   | date_time      (with millisecond resolution)  | date        |
| H | %tr  | date_time of HTTP request                     | date        |
| H | %trg | gmt_date_time of start of HTTP request        | date        |
| H | %trl | local_date_time of start of HTTP request      | date        |
|   | %ts  | termination_state                             | string      |
| H | %tsc | termination_state with cookie status          | string      |
+---+------+-----------------------------------------------+-------------+
R = Restrictions : H = mode http only ; S = SSL only


Our custom log-format built in order to fulfill our needs is as this:

log-format %ci:%cp\ %H\ [%t]\ [%f\ %fi:%fp]\ [%b/%s\ %si:%sp]\ %Tw/%Tc/%Tt\ %B\ %ts\ %ac/%fc/%bc/%sc/%sq/%bq


Once you place the log-format as a default for all haproxy frontend / backends or for a custom defined ones, the output you will get when tailing the log is:

# tail -f /var/log/haproxy.log

Apr  5 21:47:19  10.42.73.83:23262 haproxy-fqdn-hostname.com [05/Apr/2024:21:46:23.879] [ft_FRONTEND_NAME 10.46.108.6:61310] [bk_BACKEND_NAME/bk_appserv3 10.75.226.88:61310] 1/0/55250 55 sD 4/2/1/0/0/0
Apr  5 21:48:14  10.42.73.83:57506 haproxy-fqdn-hostname.com [05/Apr/2024:21:47:18.925] [ft_FRONTEND_NAME 10.46.108.6:61310] [bk_BACKEND_NAME//bk_appserv1 10.35.242.134:61310] 1/0/55236 55 sD 4/2/1/0/0/0
Apr  5 21:49:09  10.42.73.83:46520 haproxy-fqdn-hostname.com [05/Apr/2024:21:48:13.956] [ft_FRONTEND_NAME 10.46.108.6:61310] [bk_BACKEND_NAME//bk_appserv2 10.75.226.89:61310] 1/0/55209 55 sD 4/2/1/0/0/0


If you don't care about extra space and logs being filled with more naming, another variant of above log-format, that makes it even more readable even for most novice sys admin or programmer would look like this:

log-format [%t]\ %H\ [IN_IP]\ %ci:%cp\ [FT_NAME]\ %f:%fp\ [FT_IP]\ %fi:%fp\ [BK_NAME]\ [%b/%s:%sp]\ [BK_IP]\ %si:%sp\ [TIME_WAIT]\ {%Tw/%Tc/%Tt}\ [CONN_STATE]\ {%B\ %ts}\ [STATUS]\ [%ac/%fc/%bc/%sc/%sq/%bq]

Once you apply the config test the haproxy.cfg to make sure no syntax errors during copy / paste from this page

haproxy-serv:~# haproxy -c -f /etc/haproxy/haproxy.cfg
Configuration file is valid


Next restart graceously haproxy 

haproxy-serv:~# /usr/sbin/haproxy -D -f /etc/haproxy/haproxy.cfg -p /var/run/haproxy.pid -sf $(cat /var/run/haproxy.pid)


Once you reload haproxy graceously without loosing the established connections in stead of restarting it completely via systemd sysctl restart haproxy:


2024-04-05T21:46:03+02:00 localhost haproxy[1897731]: 193.200.198.195:50714 haproxy-fqdn-hostname.com [05/Apr/2024:21:46:03.012] [FrotnendProd 10.55.0.20:27800] [BackendProd/<NOSRV> -:-] -1/-1/0 0 — 4/1/0/0/0/0
2024-04-05T21:46:03+02:00 localhost haproxy[1897731]: 193.100.193.189:54290 haproxy-fqdn-hostname.com
[05/Apr/2024:21:46:03.056] [FrotnendProd 10.55.0.20:27900] [BackendProd/<NOSRV> -:-] -1/-1/0 0 — 4/4/3/0/0/0
2024-04-05T21:46:03+02:00 localhost haproxy[1897731]: 193.100.193.190:26778 haproxy-fqdn-hostname.com
[05/Apr/2024:21:46:03.134] [FrotnendProd 10.55.0.20:27900] [BackendProd/tsefas02s 10.35.242.134:27900] 1/-1/0 0 CC 4/4/3/0/0/0

Note that in that log localhost haproxy[pid] is written by rsyslog, you can filter it out by modifying rsyslogd configurations

The only problem with this log-format is not everyone wants to have to much repeating information pointer on which field is what, but I personally liked this one as well because using it even though occuping much more space, makes the log much easier to process with perl or python scripting for data visualize and very for programs that does data or even "big data" analysis.

A Biography of one big Heart + His Holiness Patriarch Neophyte (Neofit) head of Bulgarian Orthodox Church

Friday, March 22nd, 2024


His-Holiness-Patriarch-Neofitos-with-Dikiri-and-Thrikiri-blessing-the-people

Patriarch Neophyte (Simeon Nikolov Dimitrov) was born on October 15, 1945 in Sofia from a highly pious family. His father was a simple railway man and his mother a maid (cleaner). His Mother was a famous in the Church as a good christian who was singing on the Church choire in some churches and had a great perseverance and love for the Christian faith, she was the one to push further his two boys Simeon and Dimitar to take the spiritual path within the Orthodox Church. One of them the older brother Dimitar Nikolov Dimitrov to later become A Proto-Psalt and Director and Head of Sofia's Saint Alexander Nevsky Cathedral Church choire for many years (the most prestigious place for people who graduated Church music) and the other to become our 7th Patriarch in order from the times of Physical Liberation of Bulgaria From Turkish Slavery and Spiritual liberation from the dictatorship of the Greek Orthodox Church with the restoration of the Bulgarian Church with the Bulgarian Exarchate.

 At the age of twenty in 1965, he graduated from the Sofia Theological Seminary "St. Ioan Rilski / Saint John of Rila"  (then the seminary moved due to communist party decision) at the Cherepish station nearby the Cherepish monastery, Vrachansko. He served two years of military mandatory service, and in 1971 he graduated from the Theological Academy "St. Kliment Ohridski".

After his specialization at the Moscow Theological Academy in Russia, where he received the title of "Candidate of Theology (COT)" in Church Music (COT equal to our Bulgarian "Phd / doctor") , in 1973 he was appointed a teacher of Choral Church Singing and became the conductor of the student choir at the Theological Academy.

Archimandrite-Gelasij-of-new-York-later-picture-as-metropolitan-of-New-York-America

He began his monastic journey under the Spiritual eldership of Archimandrite Gelasius then abbot of the Troyan Monastery.

His monastic ordination in monkship was performed on August 3, 1975 by the previous Bulgarian Patriarch Maxim on the feast of Assumption of the Virgin Mary, August 15, 1975 , he was ordained to the rank of hierodeacon immediately, on March 25, 1976, Annunciation, he was raised in the Church hierarchy to hieromonk, and on November 21, 1977 ., Presentation of the Theotokos (The Entry of Most Holy Theotokos into the Temple), was raised to the Archimandrite dignity.

He then was assigned the obedience to be Protosyncellus (Protosingel) of the Sofia Metropolia in years 1981 to 1985.

His-All-Holiness-Patriarch-Neophytos-picture-as-young-Bishop-Levkijski-of-Bulgarian-Orthodox-Church

On December 18, 1985, he was ordained as the Bishop of Lefkias (Levkijski) a title earlier held by the all famous Levkijski Bishop Partenius (Partenij)  in the Patriarchal Cathedral "Saint Alexander Nevsky" and was appointed as vicar  bishop of the Metropolia of Sofia.

In 1989, he became rector of Sofia Theological Academy part of (Sofia University at that time), and in July 1991, when the Theological Academy returned to be the pre-revolutinary Faculty of Theology of the Sofia University "St. Kliment Ohridski", was elected the first dean of the restored Faculty of Theology.

His-Holiness-Neophytos-picture-as-Metropolitan-of-Ruse

Since January 27, 1992, he has been the chief Secretary of Holy Synod (A prestioug position) until March 27, 1994, when Bishop  Neophyte was elected Metropolitan of Dorostolo-Cherven.eparchy (which is now separated in two separate aparchies (The Eparchy of Ruse and Eparchy of Dorostol – the ancient Roman area Dorostorum)  

By decision of the Fifth Church-People's Council in 2001, with the consent and approval of the Holy Synod Assembly of metropolitans, the diocese was divided into two (the Dorostol diocese was separated with the city of Silistra -the Ancient Istrum (Histria ancient city) and he began to be titled Metropolitan of Ruse.
In the function of metropolitan he has won the respect of both church and authorities.and he was given the respectful medal "Respected citizen of Ruse".

In 2008 metropolitan Neophyte received the very prestigious academic title "doctor honoris causa" of the Sofia University "Saint Kliment Ohridski". More about it here.

His-All-Holiness-Patriarch-Neophytos-Patriarch-of-Bulgaria-and-Metropolitan-of-Sofia

On 22 June 2010 he was given a medal "St. St. Cyril and Methodius" as a respectful act for his big contribution to development of Bulgarian Music and Culture.

On February 24, 2013, a Patriarchal Electoral Church Council was convened in Sofia and the people and all people were mostly troubled on who will be the next Patriarch in this muddy times.

Soon after his arise to patriarchical throne in 2013 he was given another medal he received "Glory and Honour" in 2013 by Russian Orthodox Church.
Every Church member of that time was troubled about the future of the Bulgarian Orthodox Church, and everyone felt a big relief as The Synodal Elders elected Metropolitan Neophyte of Ruse to become the 7th Patriarch of Bulgaria after the restoration of the BPC-BP Bulgarian Church (Bulgarian Patriarchate) after so many years of being under the yoke of Byzantine Church and after liberation of Bulgaria, due to politics delicions and the harsh and anti-bulgarian activities of the Greeks in attempt to own the Church the church suffered its schism and returned its full communion to the family of national members of Holy Eastern Orthodox Church.
After his election His Holiness Patriarch Neofit is titled  Metropolitan of Sofia.and Patriarch of Bulgaria.

Patriarch-Neophyte_signature-podpis

His-Holiness-Patriarch-Neophytos-head-of-Bulgarian-Orthodox-Church

Patriarch Neophyte has the fame of being one of the best church singers in Bulgaria and one of the best and most famous Church Hymns has been circulating throughout the public space the Internet / TV and Radio for the last 10+ years as they are invaluable due to the unique voice qualities of the Patriarch. I guess there is no person in Bulgaria and outside of it who did not heard his Paschal (Katavasia and Stychorions) Hymns.

Resurrection of Christ Katavasios and Stychorion Playlist with Patriarch Neophytos (Sung) Famous Eastern Orthodox Hymns Patriarch Neofit passed away on 13 of March 2024 after a months of sickness after being hospitalized on 29 November 2023 in VMA (Army Medical Academy) due to pulmonary disease (later to understand it is a cancer in its latests stages). In his last days in hospital, the Holy Synod summoned all the Churches and people to pray fervently for the quick recovery of the patriarch through a miracle.
Patriarch Neofit passed away silently his clean holy Soul to Christ on 13 of March 2024
His brother Proto-Psalt (associated professor) Dimitar also passed on on 11 January 2024.

Protopsalt-Dimitar-associated-professor-in-Music-Director-of-st-Alexander-Nevsky-Choire
Patriarch Neophytos and his brothre Proto-Psalt Dimitar

Protopsalt Dimitar Dimitrov a brother of the Patriarch passed just 2 days after a famous Metropolitan of Joanichius has passed away to Christ on 9 January 2024 in 82 years of old.

His-Holiness-Mitropolit-Ioanikij-JoanichiusSlivenski
His Holiness Metropolitan Joanichius


Patriarch Neofit and Metropolitan Joanichius

The personality of Patriarch Neophytos was non-conflict, a lover of peace and compromises, anti-war (i would say pacifist in modern terms) and was among the few patriarchs not being in fear or influenced by the overall Church politics of the Russian Church and he publicly condemned the war as a great evil in his Theophany preach.

"The Lord God and the Holy Church bless only that army that does not show aggression, and whose sole purpose is to protect and defend its people and country within its internationally recognized territorial borders," said the patriarch for the feast of Epiphany water sanctification and sprinkling of battle flags.

The patriarch position was to try to reconcile the clergy and try to heal the misunderstandings and human conflicts between his God given flock of Priest, Monks, Bishops and Clergy with true fatherhood love, prayer and a lot of patience that we the people of 21 century miss so badly.
With a lot of sadness we send our beloved Patriarch Neophytos (Neofit) of Bulgaria to the All Mighty God and Pray if he has received a Grace from God to Pray fervently and Always for us his poor pupils and childs!

his-Holiness-Patriarh-Neofit-treti-mart-pic

God Have Mercy on the Soul of Patriarch Neophytos ! Blessed and Eternal to be his Memory ! Amen !

Monitoring network traffic tools to debug network issues in console interactively on Linux

Thursday, December 14th, 2023

transport-layer-fourth-layer-data-transport-diagram


In my last article Debugging and routing network issues on Linux (common approaches), I've given some step by step methology on how to debug a network routing or unreachability issues between network hosts. As the article was mostly targetting a command line tools that can help debugging the network without much interactivity. I've decided to blog of a few other tools that might help the system administrator to debug network issues by using few a bit more interactive tools. Throughout the years of managing multitude of Linux based laptops and servers, as well as being involved in security testing and penetration in the past, these tools has always played an important role and are worthy to be well known and used by any self respecting sys admin or network security expert that has to deal with Linux and *Unix operating systems.
 

1. Debugging what is going on on a network level interactively with iptraf-ng

Historically iptraf and today's iptraf is also a great tool one can use to further aid the arsenal debug a network issue or Protocol problem, failure of packets or network interaction issues SYN -> ACK etc. proto interactions and check for Flag states and packets flow.

To use iptraf-ng which is a ncurses based tool just install it and launch it and select the interface you would like to debug trafic on.

To install On Debians distros

# apt install iptraf-ng –yes

# iptraf-ng


iptraf-ng-linux-select-interface-screen
 

iptraf-ng-listen-all-interfaces-check-tcp-flags-and-packets


Session-Layer-in-OSI-Model-diagram
 

2. Use hackers old tool sniffit to monitor current ongoing traffic and read plain text messages

Those older who remember the rise of Linux to the masses, should remember sniffit was a great tool to snoop for traffic on the network.

root@pcfreak:~# apt-cache show sniffit|grep -i description -A 10 -B10
Package: sniffit
Version: 0.5-1
Installed-Size: 139
Maintainer: Joao Eriberto Mota Filho <eriberto@debian.org>
Architecture: amd64
Depends: libc6 (>= 2.14), libncurses6 (>= 6), libpcap0.8 (>= 0.9.8), libtinfo6 (>= 6)
Description-en: packet sniffer and monitoring tool
 Sniffit is a packet sniffer for TCP/UDP/ICMP packets over IPv4. It is able
 to give you a very detailed technical info on these packets, as SEQ, ACK,
 TTL, Window, etc. The packet contents also can be viewed, in different
 formats (hex or plain text, etc.).
 .
 Sniffit is based in libpcap and is useful when learning about computer
 networks and their security.
Description-md5: 973beeeaadf4c31bef683350f1346ee9
Homepage: https://github.com/resurrecting-open-source-projects/sniffit
Tag: interface::text-mode, mail::notification, role::program, scope::utility,
 uitoolkit::ncurses, use::monitor, use::scanning, works-with::mail,
 works-with::network-traffic
Section: net
Priority: optional
Filename: pool/main/s/sniffit/sniffit_0.5-1_amd64.deb
Size: 61796
MD5sum: ea4cc0bc73f9e94d5a3c1ceeaa485ee1
SHA256: 7ec76b62ab508ec55c2ef0ecea952b7d1c55120b37b28fb8bc7c86645a43c485


Sniffit is not installed by default on deb distros, so to give it a try install it

# apt install sniffit –yes
# sniffit


sniffit-linux-check-tcp-traffic-screenshot
 

3. Use bmon to monitor bandwidth and any potential traffic losses and check qdisc pfifo
Linux network stack queues


root@pcfreak:~# apt-cache show bmon |grep -i description
Description-en: portable bandwidth monitor and rate estimator
Description-md5: 3288eb0a673978e478042369c7927d3f
root@pcfreak:~# apt-cache show bmon |grep -i description -A 10 -B10
Package: bmon
Version: 1:4.0-7
Installed-Size: 146
Maintainer: Patrick Matthäi <pmatthaei@debian.org>
Architecture: amd64
Depends: libc6 (>= 2.17), libconfuse2 (>= 3.2.1~), libncursesw6 (>= 6), libnl-3-200 (>= 3.2.7), libnl-route-3-200 (>= 3.2.7), libtinfo6 (>= 6)
Description-en: portable bandwidth monitor and rate estimator
 bmon is a commandline bandwidth monitor which supports various output
 methods including an interactive curses interface, lightweight HTML output but
 also simple ASCII output.
 .
 Statistics may be distributed over a network using multicast or unicast and
 collected at some point to generate a summary of statistics for a set of
 nodes.
Description-md5: 3288eb0a673978e478042369c7927d3f
Homepage: http://www.infradead.org/~tgr/bmon/
Tag: implemented-in::c, interface::text-mode, network::scanner,
 role::program, scope::utility, uitoolkit::ncurses, use::monitor,
 works-with::network-traffic
Section: net
Priority: optional
Filename: pool/main/b/bmon/bmon_4.0-7_amd64.deb
Size: 47348
MD5sum: c210f8317eafa22d9e3a8fb8316e0901
SHA256: 21730fc62241aee827f523dd33c458f4a5a7d4a8cf0a6e9266a3e00122d80645


root@pcfreak:~# apt install bmon –yes

root@pcfreak:~# bmon

bmon_monitor_qdisc-network-stack-bandwidth-on-linux

4. Use nethogs net diagnosis text interactive tool

NetHogs is a small 'net top' tool. 
Instead of breaking the traffic down per protocol or per subnet, like most tools do, it groups bandwidth by process.
 

root@pcfreak:~# apt-cache show nethogs|grep -i description -A10 -B10
Package: nethogs
Source: nethogs (0.8.5-2)
Version: 0.8.5-2+b1
Installed-Size: 79
Maintainer: Paulo Roberto Alves de Oliveira (aka kretcheu) <kretcheu@gmail.com>
Architecture: amd64
Depends: libc6 (>= 2.15), libgcc1 (>= 1:3.0), libncurses6 (>= 6), libpcap0.8 (>= 0.9.8), libstdc++6 (>= 5.2), libtinfo6 (>= 6)
Description-en: Net top tool grouping bandwidth per process
 NetHogs is a small 'net top' tool. Instead of breaking the traffic down per
 protocol or per subnet, like most tools do, it groups bandwidth by process.
 NetHogs does not rely on a special kernel module to be loaded.
Description-md5: 04c153c901ad7ca75e53e2ae32565ccd
Homepage: https://github.com/raboof/nethogs
Tag: admin::monitoring, implemented-in::c++, role::program,
 uitoolkit::ncurses, use::monitor, works-with::network-traffic
Section: net
Priority: optional
Filename: pool/main/n/nethogs/nethogs_0.8.5-2+b1_amd64.deb
Size: 30936
MD5sum: 500047d154a1fcde5f6eacaee45148e7
SHA256: 8bc69509f6a8c689bf53925ff35a5df78cf8ad76fff176add4f1530e66eba9dc

root@pcfreak:~# apt install nethogs –yes

# nethogs


nethogs-tool-screenshot-show-user-network--traffic-by-process-name-ID

5;.Use iftop –  to display network interface usage


root@pcfreak:~# apt-cache show iftop |grep -i description -A10 -B10
Package: iftop
Version: 1.0~pre4-7
Installed-Size: 97
Maintainer: Markus Koschany <apo@debian.org>
Architecture: amd64
Depends: libc6 (>= 2.29), libncurses6 (>= 6), libpcap0.8 (>= 0.9.8), libtinfo6 (>= 6)
Description-en: displays bandwidth usage information on an network interface
 iftop does for network usage what top(1) does for CPU usage. It listens to
 network traffic on a named interface and displays a table of current bandwidth
 usage by pairs of hosts. Handy for answering the question "Why is my Internet
 link so slow?".
Description-md5: f7e93593aba6acc7b5a331b49f97466f
Homepage: http://www.ex-parrot.com/~pdw/iftop/
Tag: admin::monitoring, implemented-in::c, interface::text-mode,
 role::program, scope::utility, uitoolkit::ncurses, use::monitor,
 works-with::network-traffic
Section: net
Priority: optional
Filename: pool/main/i/iftop/iftop_1.0~pre4-7_amd64.deb
Size: 42044
MD5sum: c9bb9c591b70753880e455f8dc416e0a
SHA256: 0366a4e54f3c65b2bbed6739ae70216b0017e2b7421b416d7c1888e1f1cb98b7


root@pcfreak:~# apt install –yes iftop

iftop-interactive-network-traffic-output-linux-screenshot


6. Ettercap (tool) to active and passive dissect network protocols for in depth network and host analysis

root@pcfreak:/var/www/images# apt-cache show ettercap-common|grep -i description -A10 -B10
Package: ettercap-common
Source: ettercap
Version: 1:0.8.3.1-3
Installed-Size: 2518
Maintainer: Debian Security Tools <team+pkg-security@tracker.debian.org>
Architecture: amd64
Depends: ethtool, geoip-database, libbsd0 (>= 0.0), libc6 (>= 2.14), libcurl4 (>= 7.16.2), libgeoip1 (>= 1.6.12), libluajit-5.1-2 (>= 2.0.4+dfsg), libnet1 (>= 1.1.6), libpcap0.8 (>= 0.9.8), libpcre3, libssl1.1 (>= 1.1.1), zlib1g (>= 1:1.1.4)
Recommends: ettercap-graphical | ettercap-text-only
Description-en: Multipurpose sniffer/interceptor/logger for switched LAN
 Ettercap supports active and passive dissection of many protocols
 (even encrypted ones) and includes many feature for network and host
 analysis.
 .
 Data injection in an established connection and filtering (substitute
 or drop a packet) on the fly is also possible, keeping the connection
 synchronized.
 .
 Many sniffing modes are implemented, for a powerful and complete
 sniffing suite. It is possible to sniff in four modes: IP Based, MAC Based,
 ARP Based (full-duplex) and PublicARP Based (half-duplex).
 .
 Ettercap also has the ability to detect a switched LAN, and to use OS
 fingerprints (active or passive) to find the geometry of the LAN.
 .
 This package contains the Common support files, configuration files,
 plugins, and documentation.  You must also install either
 ettercap-graphical or ettercap-text-only for the actual GUI-enabled
 or text-only ettercap executable, respectively.
Description-md5: f1d894b138f387661d0f40a8940fb185
Homepage: https://ettercap.github.io/ettercap/
Tag: interface::text-mode, network::scanner, role::app-data, role::program,
 uitoolkit::ncurses, use::scanning
Section: net
Priority: optional
Filename: pool/main/e/ettercap/ettercap-common_0.8.3.1-3_amd64.deb
Size: 734972
MD5sum: 403d87841f8cdd278abf20bce83cb95e
SHA256: 500aee2f07e0fae82489321097aee8a97f9f1970f6e4f8978140550db87e4ba9


root@pcfreak:/ # apt install ettercap-text-only –yes

root@pcfreak:/ # ettercap -C


ettercap-text-interface-unified-sniffing-screenshot-linux

7. iperf and netperf to measure connecitivity speed on Network LAN and between Linux server hosts

iperf and netperf are two very handy tools to measure the speed of a network and various aspects of the bandwidth. It is mostly useful when designing network infrastructure or building networks from scratch.
 

If you never used netperf in the past here is a description from man netperf

NAME
       netperf – a network performance benchmark

SYNOPSIS
       netperf [global options] — [test specific options]

DESCRIPTION
       Netperf  is  a benchmark that can be used to measure various aspects of
       networking performance.  Currently, its focus is on bulk data  transfer
       and  request/response  performance  using  either  TCP  or UDP, and the
       Berkeley Sockets interface. In addition, tests for DLPI, and  Unix  Do‐
       main Sockets, tests for IPv6 may be conditionally compiled-in.


root@freak:~# netperf
MIGRATED TCP STREAM TEST from 0.0.0.0 (0.0.0.0) port 0 AF_INET to localhost () port 0 AF_INET : demo
Recv   Send    Send
Socket Socket  Message  Elapsed
Size   Size    Size     Time     Throughput
bytes  bytes   bytes    secs.    10^6bits/sec

 87380  65536  65536    10.00    17669.96


Testing UDP network throughput using NetPerf

Change the test name from TCP_STREAM to UDP_STREAM. Let’s use 1024 (1MB) as the message size to be sent by the client.
If you receive the following error send_data: data send error: Network is unreachable (errno 101) netperf: send_omni:

send_data failed: Network is unreachable, add option -R 1 to remove the iptable rule that prohibits NetPerf UDP flow.

$ netperf -H 172.31.56.48 -t UDP_STREAM -l 300 — -R 1 -m 1024
MIGRATED UDP STREAM TEST from 0.0.0.0 (0.0.0.0) port 0 AF_INET to 172.31.56.48 () port 0 AF_INET
Socket Message Elapsed Messages
Size Size Time Okay Errors Throughput
bytes bytes secs # # 10^6bits/sec

212992 1024 300.00 9193386 0 251.04
212992 300.00 9131380 249.35

UDP Throughput in a WAN

$ netperf -H HOST -t UDP_STREAM -l 300 — -R 1 -m 1024
MIGRATED UDP STREAM TEST from (null) (0.0.0.0) port 0 AF_INET to (null) () port 0 AF_INET : histogram : spin interval
Socket Message Elapsed Messages
Size Size Time Okay Errors Throughput
bytes bytes secs # # 10^6bits/sec

9216 1024 300.01 35627791 0 972.83
212992 300.01 253099 6.91


Testing TCP throughput using iPerf


Here is a short description of iperf

NAME
       iperf – perform network throughput tests

SYNOPSIS
       iperf -s [options]

       iperf -c server [options]

       iperf -u -s [options]

       iperf -u -c server [options]

DESCRIPTION
       iperf  2  is  a tool for performing network throughput and latency mea‐
       surements. It can test using either TCP or UDP protocols.  It  supports
       both  unidirectional  and  bidirectional traffic. Multiple simultaneous
       traffic streams are also supported. Metrics are displayed to help  iso‐
       late the causes which impact performance. Setting the enhanced (-e) op‐
       tion provides all available metrics.

       The user must establish both a both a server (to discard traffic) and a
       client (to generate traffic) for a test to occur. The client and server
       typically are on different hosts or computers but need not be.


Run iPerf3 as server on the server:

$ iperf3 –server –interval 30
———————————————————–
Server listening on 5201
———————————————————–


Test TCP Throughput in Local LAN


$ iperf3 –client 172.31.56.48 –time 300 –interval 30
Connecting to host 172.31.56.48, port 5201
[ 4] local 172.31.100.5 port 44728 connected to 172.31.56.48 port 5201
[ ID] Interval Transfer Bandwidth Retr Cwnd
[ 4] 0.00-30.00 sec 1.70 GBytes 488 Mbits/sec 138 533 KBytes
[ 4] 30.00-60.00 sec 260 MBytes 72.6 Mbits/sec 19 489 KBytes
[ 4] 60.00-90.00 sec 227 MBytes 63.5 Mbits/sec 15 542 KBytes
[ 4] 90.00-120.00 sec 227 MBytes 63.3 Mbits/sec 13 559 KBytes
[ 4] 120.00-150.00 sec 228 MBytes 63.7 Mbits/sec 16 463 KBytes
[ 4] 150.00-180.00 sec 227 MBytes 63.4 Mbits/sec 13 524 KBytes
[ 4] 180.00-210.00 sec 227 MBytes 63.5 Mbits/sec 14 559 KBytes
[ 4] 210.00-240.00 sec 227 MBytes 63.5 Mbits/sec 14 437 KBytes
[ 4] 240.00-270.00 sec 228 MBytes 63.7 Mbits/sec 14 516 KBytes
[ 4] 270.00-300.00 sec 227 MBytes 63.5 Mbits/sec 14 524 KBytes
– – – – – – – – – – – – – – – – – – – – – – – – –
[ ID] Interval Transfer Bandwidth Retr
[ 4] 0.00-300.00 sec 3.73 GBytes 107 Mbits/sec 270 sender
[ 4] 0.00-300.00 sec 3.73 GBytes 107 Mbits/sec receiver

Test TCP Throughput in a WAN Network

$ iperf3 –client HOST –time 300 –interval 30
Connecting to host HOST, port 5201
[ 5] local 192.168.1.73 port 56756 connected to HOST port 5201
[ ID] Interval Transfer Bitrate
[ 5] 0.00-30.00 sec 21.2 MBytes 5.93 Mbits/sec
[ 5] 30.00-60.00 sec 27.0 MBytes 7.55 Mbits/sec
[ 5] 60.00-90.00 sec 28.6 MBytes 7.99 Mbits/sec
[ 5] 90.00-120.00 sec 28.7 MBytes 8.02 Mbits/sec
[ 5] 120.00-150.00 sec 28.5 MBytes 7.97 Mbits/sec
[ 5] 150.00-180.00 sec 28.6 MBytes 7.99 Mbits/sec
[ 5] 180.00-210.00 sec 28.4 MBytes 7.94 Mbits/sec
[ 5] 210.00-240.00 sec 28.5 MBytes 7.97 Mbits/sec
[ 5] 240.00-270.00 sec 28.6 MBytes 8.00 Mbits/sec
[ 5] 270.00-300.00 sec 27.9 MBytes 7.81 Mbits/sec
– – – – – – – – – – – – – – – – – – – – – – – – –
[ ID] Interval Transfer Bitrate
[ 5] 0.00-300.00 sec 276 MBytes 7.72 Mbits/sec sender
[ 5] 0.00-300.00 sec 276 MBytes 7.71 Mbits/sec receiver


$ iperf3 –client 172.31.56.48 –interval 30 -u -b 100MB
Accepted connection from 172.31.100.5, port 39444
[ 5] local 172.31.56.48 port 5201 connected to 172.31.100.5 port 36436
[ ID] Interval Transfer Bandwidth Jitter Lost/Total Datagrams
[ 5] 0.00-30.00 sec 354 MBytes 98.9 Mbits/sec 0.052 ms 330/41774 (0.79%)
[ 5] 30.00-60.00 sec 355 MBytes 99.2 Mbits/sec 0.047 ms 355/41903 (0.85%)
[ 5] 60.00-90.00 sec 354 MBytes 98.9 Mbits/sec 0.048 ms 446/41905 (1.1%)
[ 5] 90.00-120.00 sec 355 MBytes 99.4 Mbits/sec 0.045 ms 261/41902 (0.62%)
[ 5] 120.00-150.00 sec 354 MBytes 99.1 Mbits/sec 0.048 ms 401/41908 (0.96%)
[ 5] 150.00-180.00 sec 353 MBytes 98.7 Mbits/sec 0.047 ms 530/41902 (1.3%)
[ 5] 180.00-210.00 sec 353 MBytes 98.8 Mbits/sec 0.059 ms 496/41904 (1.2%)
[ 5] 210.00-240.00 sec 354 MBytes 99.0 Mbits/sec 0.052 ms 407/41904 (0.97%)
[ 5] 240.00-270.00 sec 351 MBytes 98.3 Mbits/sec 0.059 ms 725/41903 (1.7%)
[ 5] 270.00-300.00 sec 354 MBytes 99.1 Mbits/sec 0.043 ms 393/41908 (0.94%)
– – – – – – – – – – – – – – – – – – – – – – – – –
[ ID] Interval Transfer Bandwidth Jitter Lost/Total Datagrams
[ 5] 0.00-300.04 sec 3.45 GBytes 98.94 Mbits/sec 0.043 ms 4344/418913 (1%)

UDP Throughput in a WAN

$ iperf3 –client HOST –time 300 -u -b 7.7MB
Accepted connection from 45.29.190.145, port 60634
[ 5] local 172.31.56.48 port 5201 connected to 45.29.190.145 port 52586
[ ID] Interval Transfer Bandwidth Jitter Lost/Total Datagrams
[ 5] 0.00-30.00 sec 27.4 MBytes 7.67 Mbits/sec 0.438 ms 64/19902 (0.32%)
[ 5] 30.00-60.00 sec 27.5 MBytes 7.69 Mbits/sec 0.446 ms 35/19940 (0.18%)
[ 5] 60.00-90.00 sec 27.5 MBytes 7.68 Mbits/sec 0.384 ms 39/19925 (0.2%)
[ 5] 90.00-120.00 sec 27.5 MBytes 7.68 Mbits/sec 0.528 ms 70/19950 (0.35%)
[ 5] 120.00-150.00 sec 27.4 MBytes 7.67 Mbits/sec 0.460 ms 51/19924 (0.26%)
[ 5] 150.00-180.00 sec 27.5 MBytes 7.69 Mbits/sec 0.485 ms 37/19948 (0.19%)
[ 5] 180.00-210.00 sec 27.5 MBytes 7.68 Mbits/sec 0.572 ms 49/19941 (0.25%)
[ 5] 210.00-240.00 sec 26.8 MBytes 7.50 Mbits/sec 0.800 ms 443/19856 (2.2%)
[ 5] 240.00-270.00 sec 27.4 MBytes 7.66 Mbits/sec 0.570 ms 172/20009 (0.86%)
[ 5] 270.00-300.00 sec 25.3 MBytes 7.07 Mbits/sec 0.423 ms 1562/19867 (7.9%)
– – – – – – – – – – – – – – – – – – – – – – – – –
[ ID] Interval Transfer Bandwidth Jitter Lost/Total Datagrams
[ 5] 0.00-300.00 sec 272 MBytes 7.60 Mbits/sec 0.423 ms 2522/199284 (1.3%)
[SUM] 0.0-300.2 sec 31 datagrams received out-of-order


Sum it up what learned


Debugging network issues and snooping on a Local LAN (DMZ) network on a server or home LAN is useful  to debug for various network issues and more importantly track and know abou tsecurity threads such as plain text passowd communication via insecure protocols a failure of proper communication between Linux network nodes at times, or simply to get a better idea on what kind of network is your new purchased dedicated server living in .It can help you also strenghten your security and close up any possible security holes, or even help you start thinking like a security intruder (cracker / hacker) would do. In this article we went through few of my favourite tools I use for many years quite often. These tools are just part of the tons of useful *Unix free tools available to do a network debug. Tools mentioned up are worthy to install on every server you have to administratrate or even your home desktop PCs, these are iptraf, sniffit, iftop, bmon, nethogs, nmon, ettercap, iperf and netperf.
 If you have some other useful tools used on Linux sys admin tasks please share, I'll be glad to know it and put them in my arsenal of used tools.

Enjoy ! 🙂

Check the Type and Model of available installed Memory on Linux / Unix / BSD Server howto

Monday, October 30th, 2023

how-linux-kernel-manages-memory-picture

As a system administrator one of the common task, one has to do is Add / Remove or Replace (of Broken or failing Bank of RAM memory) a piece of additional Bank of memory Bank to a Linux / BSD / Unix server.  Lets say you need to fullfil the new RAM purchase and provide some information to the SDM (Service Delivery Manager) of the compnay you're hirder in or you need to place the purchase yourself. Then you  need to know the exact speed and type of RAM currently installed on the server installed.

In this article i'll shortly explain how do I find out ram (SDRAM) information from a via ordinary remote ssh shell session cmd prompt. In short will be shown how can one check RAM speed configured and detected by Linux / Unix kernel ? 
As well as  how to Check the type of memory (if it is DDR / DDR2 / DDR or DDR4) or ECC with no access to Hardware Console.  Please note this article will be definitely boring for the experienced sysadmins but might help to a starter sysadmins to get on board with a well know basic stuff.

There are several approaches, of course easiest one is to use remote hardware access interrace statistics web interface of ILO (on IBM machine) or the IDRAC on (Dell Server) or Fujitsu's servers iRMC. However as not always access to remote Remote hardware management interface is available to admin. Linux comes with few commands that can do the trick, that are available to most Linux distributions straight for the default package repositories.

Since mentioning about ECC a bit up, most old school admins and computer users knows pretty well about DDRs as they have been present over time but ECC is being used over actively on servers perhaps over the last 10 / 15 years and for those not dealt with it below is a short description on what is ECC RAM Memory.

ECC RAM, short for Error Correcting Code Random Access Memory, is a kind of RAM can detect most common kinds of memory errors and correct a subset of them. ECC RAM is common in enterprise deployments and most server-class hardware. Above a certain scale and memory density, single-bit errors which were up to this point are sufficiently statistically unlikely begin to occur with enough frequency that they can no longer be ignored. At certain scales and densities of memory arbitrary memory errors that are literally "one in a million chances" (or more) may in fact occur several times throughout a system's operational life.

Putting some basics, Lets proceed and Check RAM speed and type (line DDR or DDR2 or DDR3 or DDR4) without having to physically go to the the Data Center numbered rack that is containing the server.


Most famous and well known (also mentioned) on few occasions in my previous articles are: dmidecode and lshw

Quickest way to get a quick overview of installed servers memory is with:
 

root@server:~# dmidecode -t memory | grep -E "Speed:|Type:" | sort | uniq -c
      4     Configured Memory Speed: 2133 MT/s
     12     Configured Memory Speed: Unknown
      4     Error Correction Type: Multi-bit ECC
      2     Speed: 2133 MT/s
      2     Speed: 2400 MT/s
     12     Speed: Unknown
     16     Type: DDR4


To get more specifics on the exact type of memory installed on the server, the respective slots that are already taken and the free ones:

root@server:~# dmidecode –type 17 | less

Usually the typical output the command would produce regarding lets say 4 installed Banks of RAM memory on the server will be like:

Handle 0x002B, DMI type 17, 40 bytes
Memory Device
        Array Handle: 0x0029
        Error Information Handle: Not Provided
        Total Width: 72 bits
        Data Width: 64 bits
       
Size: 16 GB
        Form Factor: RIMM
        Set: None
        Locator: CPU1 DIMM A1
        Bank Locator: A1_Node0_Channel0_Dimm1
       
Type: DDR4
        Type Detail: Synchronous
       
Speed: 2400 MT/s
        Manufacturer: Micron
       
Serial Number: 15B36358
        Asset Tag: CPU1 DIMM A1_AssetTag
       
Part Number: 18ASF2G72PDZ-2G3B1 
        Rank: 2
       
Configured Memory Speed: 2133 MT/s
        Minimum Voltage: Unknown
        Maximum Voltage: Unknown
        Configured Voltage: Unknown

Handle 0x002E, DMI type 17, 40 bytes
Memory Device
        Array Handle: 0x0029
        Error Information Handle: Not Provided
        Total Width: Unknown
        Data Width: Unknown
        Size: No Module Installed
        Form Factor: RIMM
        Set: None
        Locator: CPU1 DIMM A2
        Bank Locator: A1_Node0_Channel0_Dimm2
        Type: DDR4
        Type Detail: Synchronous
        Speed: Unknown
        Manufacturer: NO DIMM
        Serial Number: NO DIMM
        Asset Tag: NO DIMM
        Part Number: NO DIMM
        Rank: Unknown
        Configured Memory Speed: Unknown
        Minimum Voltage: Unknown
        Maximum Voltage: Unknown
        Configured Voltage: Unknown


Handle 0x002D, DMI type 17, 40 bytes
Memory Device
        Array Handle: 0x0029
        Error Information Handle: Not Provided
        Total Width: 72 bits
        Data Width: 64 bits
        Size: 16 GB
        Form Factor: RIMM
        Set: None
        Locator: CPU1 DIMM B1
        Bank Locator: A1_Node0_Channel1_Dimm1
        Type: DDR4
        Type Detail: Synchronous
        Speed: 2400 MT/s
        Manufacturer: Micron
        Serial Number: 15B363AF
        Asset Tag: CPU1 DIMM B1_AssetTag
        Part Number: 18ASF2G72PDZ-2G3B1 
        Rank: 2
        Configured Memory Speed: 2133 MT/s
        Minimum Voltage: Unknown
        Maximum Voltage: Unknown
        Configured Voltage: Unknown

Handle 0x0035, DMI type 17, 40 bytes
Memory Device
        Array Handle: 0x0031
        Error Information Handle: Not Provided
        Total Width: 72 bits
        Data Width: 64 bits
        Size: 16 GB
        Form Factor: RIMM
        Set: None
        Locator: CPU1 DIMM D1
        Bank Locator: A1_Node0_Channel3_Dimm1
        Type: DDR4
        Type Detail: Synchronous
        Speed: 2133 MT/s
        Manufacturer: Micron
        Serial Number: 1064B491
        Asset Tag: CPU1 DIMM D1_AssetTag
        Part Number: 36ASF2G72PZ-2G1A2  
        Rank: 2
        Configured Memory Speed: 2133 MT/s
        Minimum Voltage: Unknown
        Maximum Voltage: Unknown
        Configured Voltage: Unknown

Handle 0x0033, DMI type 17, 40 bytes
Memory Device
        Array Handle: 0x0031
        Error Information Handle: Not Provided
        Total Width: 72 bits
        Data Width: 64 bits
        Size: 16 GB
        Form Factor: RIMM
        Set: None
        Locator: CPU1 DIMM C1
        Bank Locator: A1_Node0_Channel2_Dimm1
        Type: DDR4
        Type Detail: Synchronous
        Speed: 2133 MT/s
        Manufacturer: Micron
        Serial Number: 10643A5B
        Asset Tag: CPU1 DIMM C1_AssetTag
        Part Number: 36ASF2G72PZ-2G1A2  
        Rank: 2
        Configured Memory Speed: 2133 MT/s
        Minimum Voltage: Unknown
        Maximum Voltage: Unknown
        Configured Voltage: Unknown


The marked in green are the banks of memory that are plugged in the server. The

field Speed: and Configured Memory Speed: are fields indicating respectively the Maximum speed on which a plugged-in RAM bank can operate and the the actual Speed the Linux kernel has it configured and uses is at.

It is useful for the admin to usually check the complete number of available RAM slots on a server, this can be done with command like:

root@server:~#  dmidecode –type 17 | grep -i Handle | grep 'DMI'|wc -l
16


As you can see at this specific case 16 Memory slots are avaiable (4 are already occupied and working configured on the machine at 2133 Mhz and 12 are empty and can have installed a memory banks in).


Perhaps the most interesting information for the RAM replacement to be ordered is to know the data communication SPEED on which the Memory is working on the server and interacting with Kernel and Processor to find out.

root@server:~#  dmidecode –type 17 | grep -i "speed"|grep -vi unknown
    Speed: 2400 MT/s
    Configured Memory Speed: 2133 MT/s
    Speed: 2400 MT/s
    Configured Memory Speed: 2133 MT/s
    Speed: 2133 MT/s
    Configured Memory Speed: 2133 MT/s
    Speed: 2133 MT/s
    Configured Memory Speed: 2133 MT/s


If you're lazy to remember the exact dmidecode memory type 17 you can use also memory keyword:

root@server:~# dmidecode –type memory | more

For servers that have the lshw command installed, a quick overview of RAM installed and Full slots available for memory placement can be done with:
 

root@server:~#  lshw -short -C memory
H/W path                 Device        Class          Description
=================================================================
/0/0                                   memory         64KiB BIOS
/0/29                                  memory         64GiB System Memory
/0/29/0                                memory         16GiB RIMM DDR4 Synchronous 2400 MHz (0.4 ns)
/0/29/1                                memory         RIMM DDR4 Synchronous [empty]
/0/29/2                                memory         16GiB RIMM DDR4 Synchronous 2400 MHz (0.4 ns)
/0/29/3                                memory         RIMM DDR4 Synchronous [empty]
/0/29/4                                memory         16GiB RIMM DDR4 Synchronous 2133 MHz (0.5 ns)
/0/29/5                                memory         RIMM DDR4 Synchronous [empty]
/0/29/6                                memory         16GiB RIMM DDR4 Synchronous 2133 MHz (0.5 ns)
/0/29/7                                memory         RIMM DDR4 Synchronous [empty]
/0/29/8                                memory         RIMM DDR4 Synchronous [empty]
/0/29/9                                memory         RIMM DDR4 Synchronous [empty]
/0/29/a                                memory         RIMM DDR4 Synchronous [empty]
/0/29/b                                memory         RIMM DDR4 Synchronous [empty]
/0/29/c                                memory         RIMM DDR4 Synchronous [empty]
/0/29/d                                memory         RIMM DDR4 Synchronous [empty]
/0/29/e                                memory         RIMM DDR4 Synchronous [empty]
/0/29/f                                memory         RIMM DDR4 Synchronous [empty]
/0/43                                  memory         768KiB L1 cache
/0/44                                  memory         3MiB L2 cache
/0/45                                  memory         30MiB L3 cache

Now once we know the exact model and RAM Serial and Part number you can google it online and to purchase more of the same RAM Model and Type you need so the installed memory work on the same Megaherzes as the installed ones.
 

Improve MobaXterm Best Windows terminal client with some additional settings tune ups / Install extra Linux Cygwin tools on MobaXterm and various post install configuration goodies

Friday, January 20th, 2023

mobaxterm-logo_400x400-terminal-client-tune-up-howto-for-a-new-install

Earlier I've written a an article MobaXTerm: A good gnome-terminal like tabbed SSH client for Windows / Windows Putty Tabs Alternative in which I've introduced the best in my opinion SSH / Telnet / VNC / RDP / Xserver in one Terminal client emulator for Windows operating systems.

The client has been around for quite some time and it has been improving rapidly over the last 10 years, where it now more looks like a separate Operating System than a single terminal client. It's size is quite compact as well and my opinion and every self respectiving developer, system administrator, IT geek or a hacker would definitely
use the mobaxterm at home or at work place on a daily. I guess some of my readers, who have already migrated SuperPutty / SecureCRT or Putty / XMing or whatever kind of exotic Remote SSH Console terminal is used could validate this 🙂

Therefore as I've set up Mobaxterm on a multiple computers all around, I've found it useful to write a small article with some post-install hints (tune ups) one can do immediately once he has installed the Desktop or Portable Apps version of mobaxterm on desktop PC / notebook.
 

1. Set up your bashrc server / command aliases

Lets say you need to setup some rules for connectivity via a socks proxy to dig holes over a harsh company firewalls or add
custom options to every ssh client attempt to remote server, or simply alias some of your servers with custom connectivity options
and so on simply open vi / vim text editor from mobaxterm local terminal and place inside your rules, for example that could be anything like:


alias ssh='ssh -o stricthostkeychecking=no -o passwordauthentication=yes -o PreferredAuthentications=password  -v'
alias sftp='sftp -o stricthostkeychecking=no -o passwordauthentication=yes -o PreferredAuthentications=password'

alias work-server='ssh UserName@work-server -v -o passwordauthentication=yes -o PreferredAuthentications=password'

alias proxy='ssh -D 3128 UserName@proxyIP-host1 -o ConnectTimeout=80'
alias proxy1='ssh -D 3128 UserName@proxy-host2 -p 443 -o ConnectTimeout=60'
alias proxy3='ssh -D 3128 Username@proxy-host3 -p 443 -o ConnectTimeout=60'

Simply open the terminal and setup whatever you require
export ftp_proxy="http://proxy-host:8080"
export https_proxy="https://proxy-host:8080"
export http_proxy="http://proxy-host:8080"
export HTTP_PROXY="http://proxy-host:8080"
export HTTPS_PROXY="http://proxy-host:8080"


2. Set mobaxterm presistent directory / persistent root directory and default text editor

Make sure you have properly defined at least Persistent directory / Persistent directory if you want to keep the files under your /home/mobaxterm and root directory be able to save your data from local mobaxterm terminal work you have done.

To do so o to Configuration -> General

MobaXterm-persistent-home-directory
 

3. Change default settings for Opening / Closing Terminal tabs just like in gnome-terminal

MobaXterm is really awesome as the developer, followed pretty much the logic of some common GNU / Linux Terminal clients like Gnome-Terminal and KDE's default Konsole terminal.

One of the first things to do once Mobaxterm is installed on the PC is to set up nice key binds as default onces might be heard to learn at the beginning or you might have already the habit to use the certain set of key combinations on your Linux desktop:

Common once are:

1. Open tab / Close tab common once I bind to are (CTRL + T / CTRL + W)
2. Previous tab move / Next tab move keys common one I use are (ALT + LEFT / ALT + RIGHT)
3. Find in terminal (CTRL + F)

rebind-mobaxterm-standard-keys
 

4. Make MobaXterm to automatically open a terminal to not Start local terminal every time

By default mobaxterm it is really annoying cause every time you run it after system reboot you have to select
Start local terminal
Once you run the terminal you get this prompt and you have to press on Start local terminal

mobaxterm-start-local-terminal


How to make Mobaxterm automatically open local Terminal Tab on every boot?
 

To fix this so every time a local terminal is spawn on MobaXterm you have get to:
 

Settings -> Configuration -> Misc


Open the Following tab at startup by default it will be

<Home (Pinned)>

Change it to:

<Terminal>

mobaxterm-open-the-followintab-tab-in-startup

That's it on next login your Local Terminal with /bin/bash.exe will auto load !
 

[hipo.WINDOWS-PC] ➤ env|grep -i SHELL
SHELL=/bin/bash.exe
PATH=/bin:/drives/c/Users/hipo/DOCUME~1
/MobaXterm/slash/bin:/drives/c/Windows:/drives/c/Windows/system32:/drives/c/Windows/system32:/drives/c/Windows:/drives/c/Windows/System32/Wbem:
/drives/c/Windows/System32/WindowsPowerShell/v1.0:/drives/c/Windows/sysnative
PSModulePath=C:\Windows\system32\WindowsPowerShell\v1.0\Modules\
CMDPATH=C:\Windows\system32;C:\Windows;C:\Windows\System32\Wbem;
C:\Windows\System32\WindowsPowerShell\v1.0\;C:\Windows\sysnative\;
C:\Users\hipo\DOCUME~1\MobaXterm\slash\bin
WINPATH=C:\Windows\system32;C:\Windows;C:\Windows\System32\Wbem;C:\Windows\System32\WindowsPowerShell\v1.0\;C:\Windows\sysnative\


5. Make menu buttons to appear smaller


Go to menu and select
View -> (Small Buttons)

mobaxterm-select-small-buttons-screenshot

6. Disable auto start of XServer to prevent a port listener on the machine on TCP port

By default mobaxterm opens XServer listener, so you can immediately connect from a remote SSH servers missing Xserver and install software requiring an XServer, for example software such as Oracle Database or some MiddleWare WebLogig or IBM's Web Sphere. This is useful but if you want to have a good security only allow this server on a purpose. Otherwise the XServer will run in parallel with rest of your Moba and just load up your PC and eat up some RAM memory. To disable it go to:

mobaxterm-x11-automatically-start-X-server-disable-stop-at-startup

7. Change the mobaxterm Default theme to Dark

This is optional I like to set the Theme to Dark, also as a Theme for Windows as well as for MobaxTerm, the aim of that is simply to not put extra stress on my eye sight. Being on the PC around 8 to 10 hours and spending some 6 to 8 hours on console work is enough. If you want to do as well.

mobaxterm-change-default-theme-to-dark-theme

8. Install additional set of common Linux tools to mobaxterm to use on Windows
 

Tools such as:

1. Midnight Commander (mc)
2. Wget
3. Curl
4. Vim
5. Screen
6. Rsync
7. Perl
8. W3m
9. dosunix
10. unix2dos
11. gnupg
12. diffutils
13. mysql
14. mpg123
15. whois


If you want to have a set of packages pre-installed that are including above as well as the rest of mine, here is a dump of my installed mobapt manager packages:

For more simply use the experimental Mobaxterm  Graphical Package installer
 

[hipo.WINDOWS-PC] ➤  for i in $(cat Downloads/installed-packages-mobaxterm.txt ); do apt-cyg install $i; done
 

Found package GeoIP-database

Installing GeoIP-database
Downloading GeoIP-database-20180505-1.tar.xz…
Unpacking GeoIP-database-20180505-1.tar.xz…


Running postinstall scripts
Package GeoIP-database installed.

Rebasing new libraries

Found package adwaita-icon-theme

Installing adwaita-icon-theme
Downloading adwaita-icon-theme-3.26.1-1.tar.xz…


You will be prompted for a single Yes for the respository

MobApt Packages Manager

mobapt-pkg-manager-install-git-from-gui-mobaxterm-package-installer

Though it is said it is experimental, I have to say the MobApt Apt Manager works quite good, I never had any issues with it so far.

9. Mobaxterm.ini the settings storage file that can help you move your configurations

If you have to prepeare new MobaXterm on multiple PCs frequently perhaps it is best to just copy the Mobaxterm.ini file. 
Here is an example of my mobaxterm.ini for download.
 

10. Change terminal colors and curor type and enable blinking (customizations)


Settings -> Configuration -> Terminal -> (Default Terminal Color Settings)


mobaxterm-change-terminal-colors-and-blinking-cursor-setting-screenshot

11. Use very useful moba Tools
 

mobaxterm-terminal-great-useful-tools-screenshot
For sysadmins Moba has plenty of other jems such as:

  • Network Port scanner such as Nmap with GUI

  • list open network ports (GUI interface to netmap)

  • SSH tunnel tool

  • Moba Diff

  • Wake on Lan

  • Network Packet capturer (such as tcpdump)

  • List running processes (such as taskmgr in simple form)

  • List machine hardware devices (such as Windows Device manager)

 
12. Remote monitoring of opened ssh session


To enable remote monitoring for a Saved session simply use the "Remote monitoring" button on the down left corner of the terminal.

mobaxterm-remote-monitoring-of-remote-ssh-server-screenshot-button

Or to enable it for a new host, open:

1. "Saved sessions"
2. Click over "User sessions"
3. New Session -> (SSH)
4. Basic SSH Settings (Remote host) -> OK
5. Click over the new created session
6. Click on Remote monitoring for the opened session

remote-monitoring-from-mobaxterm-screenshot

13. Play some mobaxterm console games

As you might have pissed off of configuring go on and enjoy some of the great console games, some of which are also present on a normal Linux new distribution installation. 🙂

mobaxterm-list-of-games-screenshot

List of Moba Games

teamwalk-mobaxterm-console-connect-network-routers-game
TeamWalk (Use your mouse or keyboard to connect every server to the central router)

ctris-console-text-game-mobaxterm

Ctris Console tetris from Mobaxterm

solitaire-text-console-game-played-on-mobaxterm-screenshot

Text console Solitaire from Moba
 

Ninvaders-console-game-mobaxterm

Here is NinVaders (Text Version of Space Invaders Arcade Classic)
 

Enjoy ! 🙂